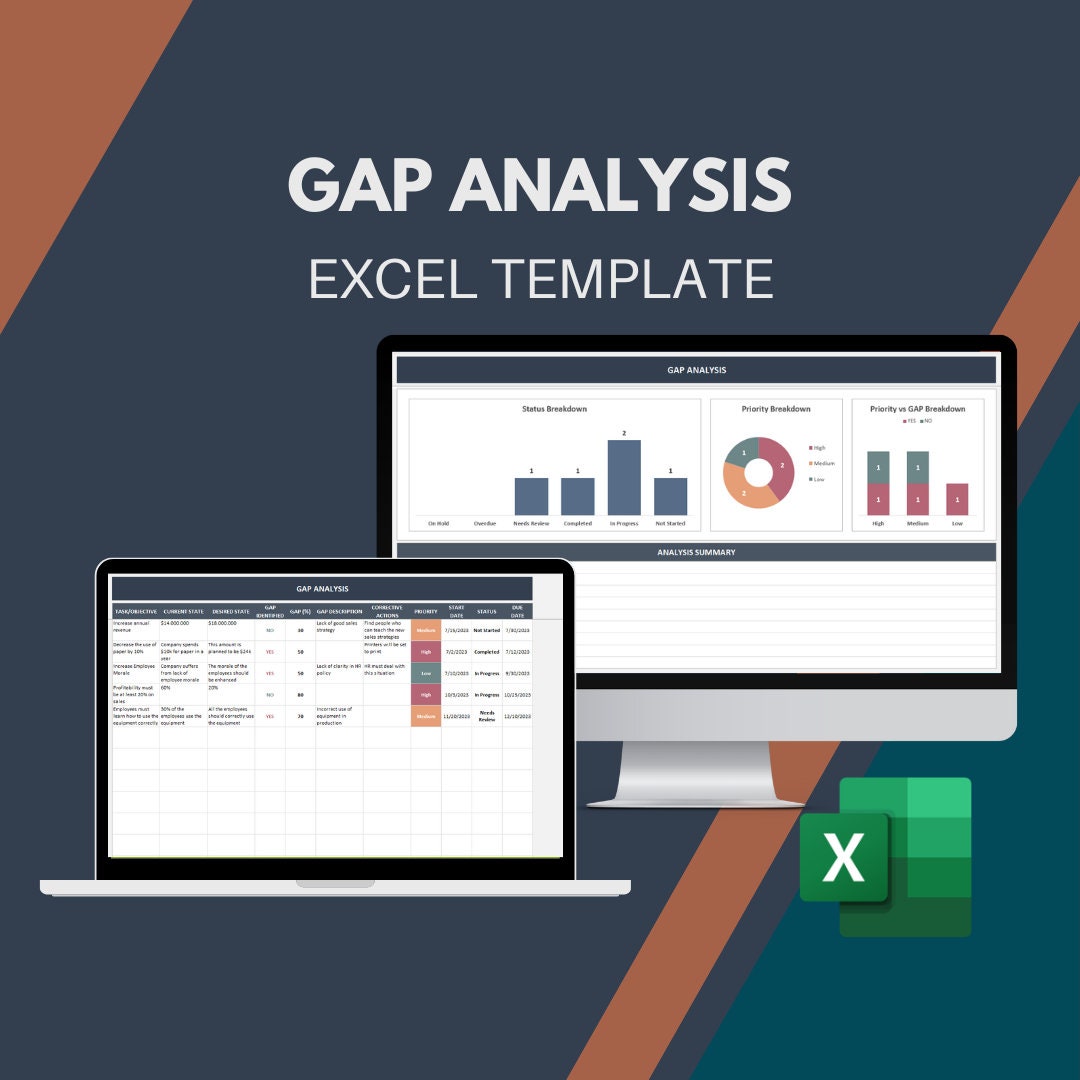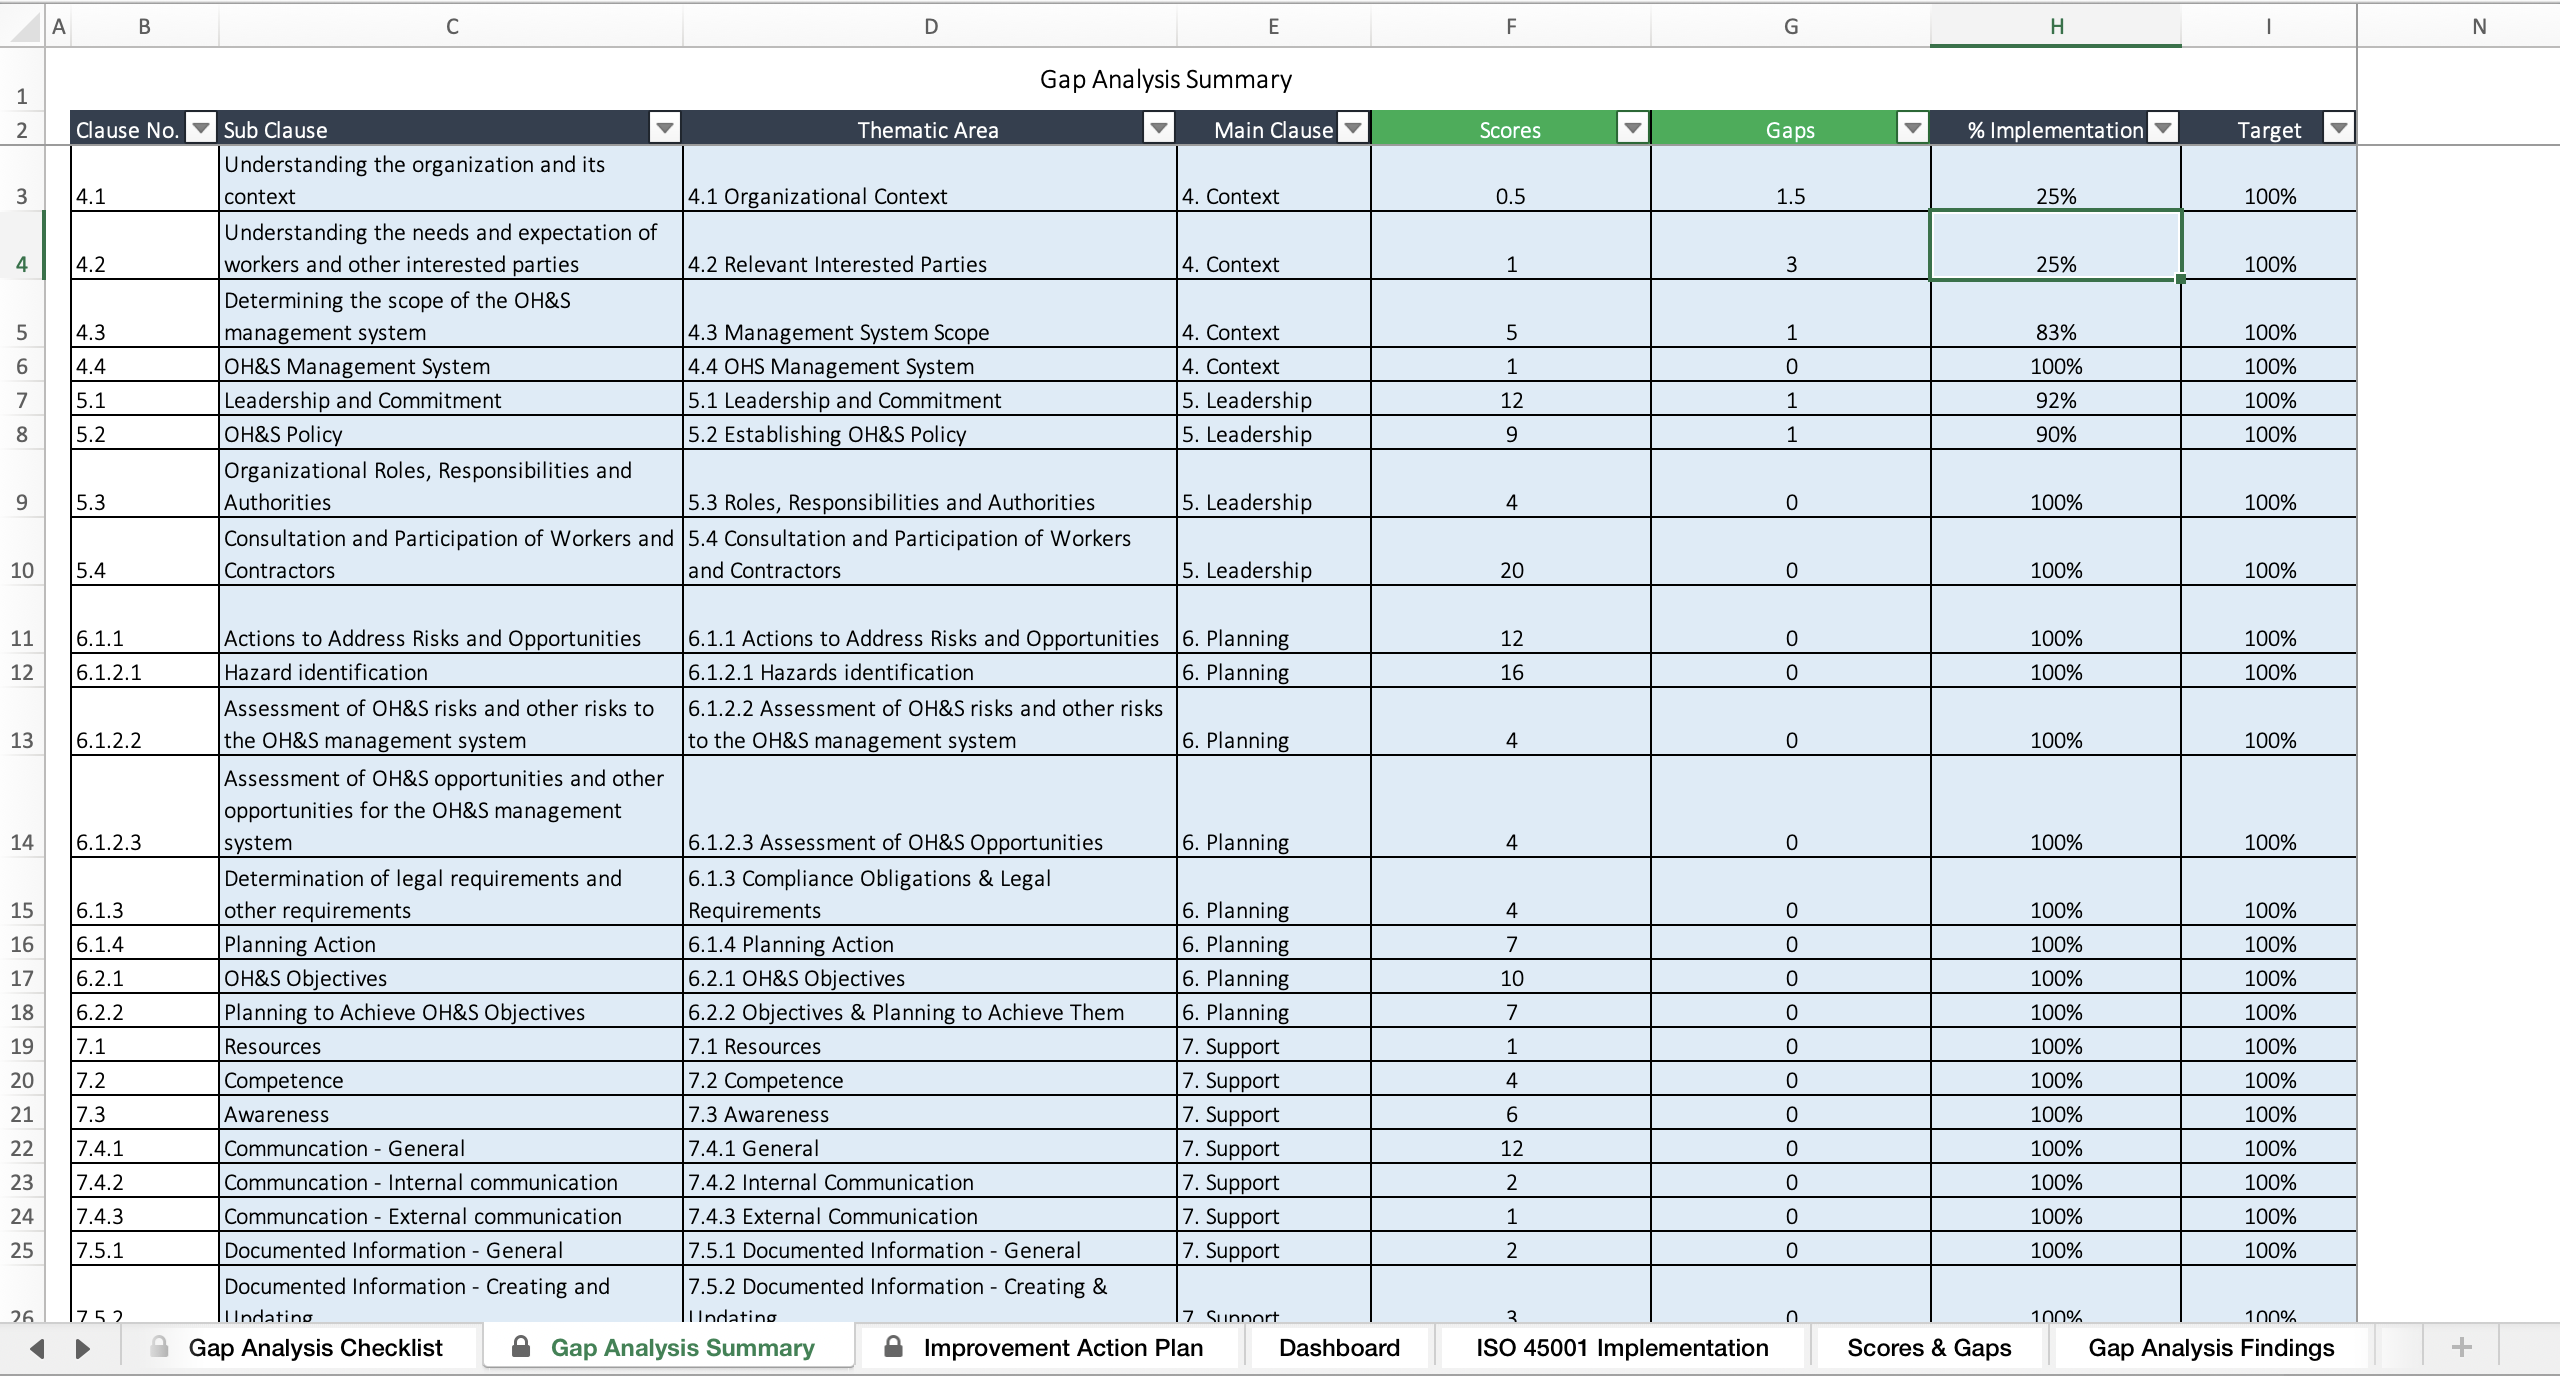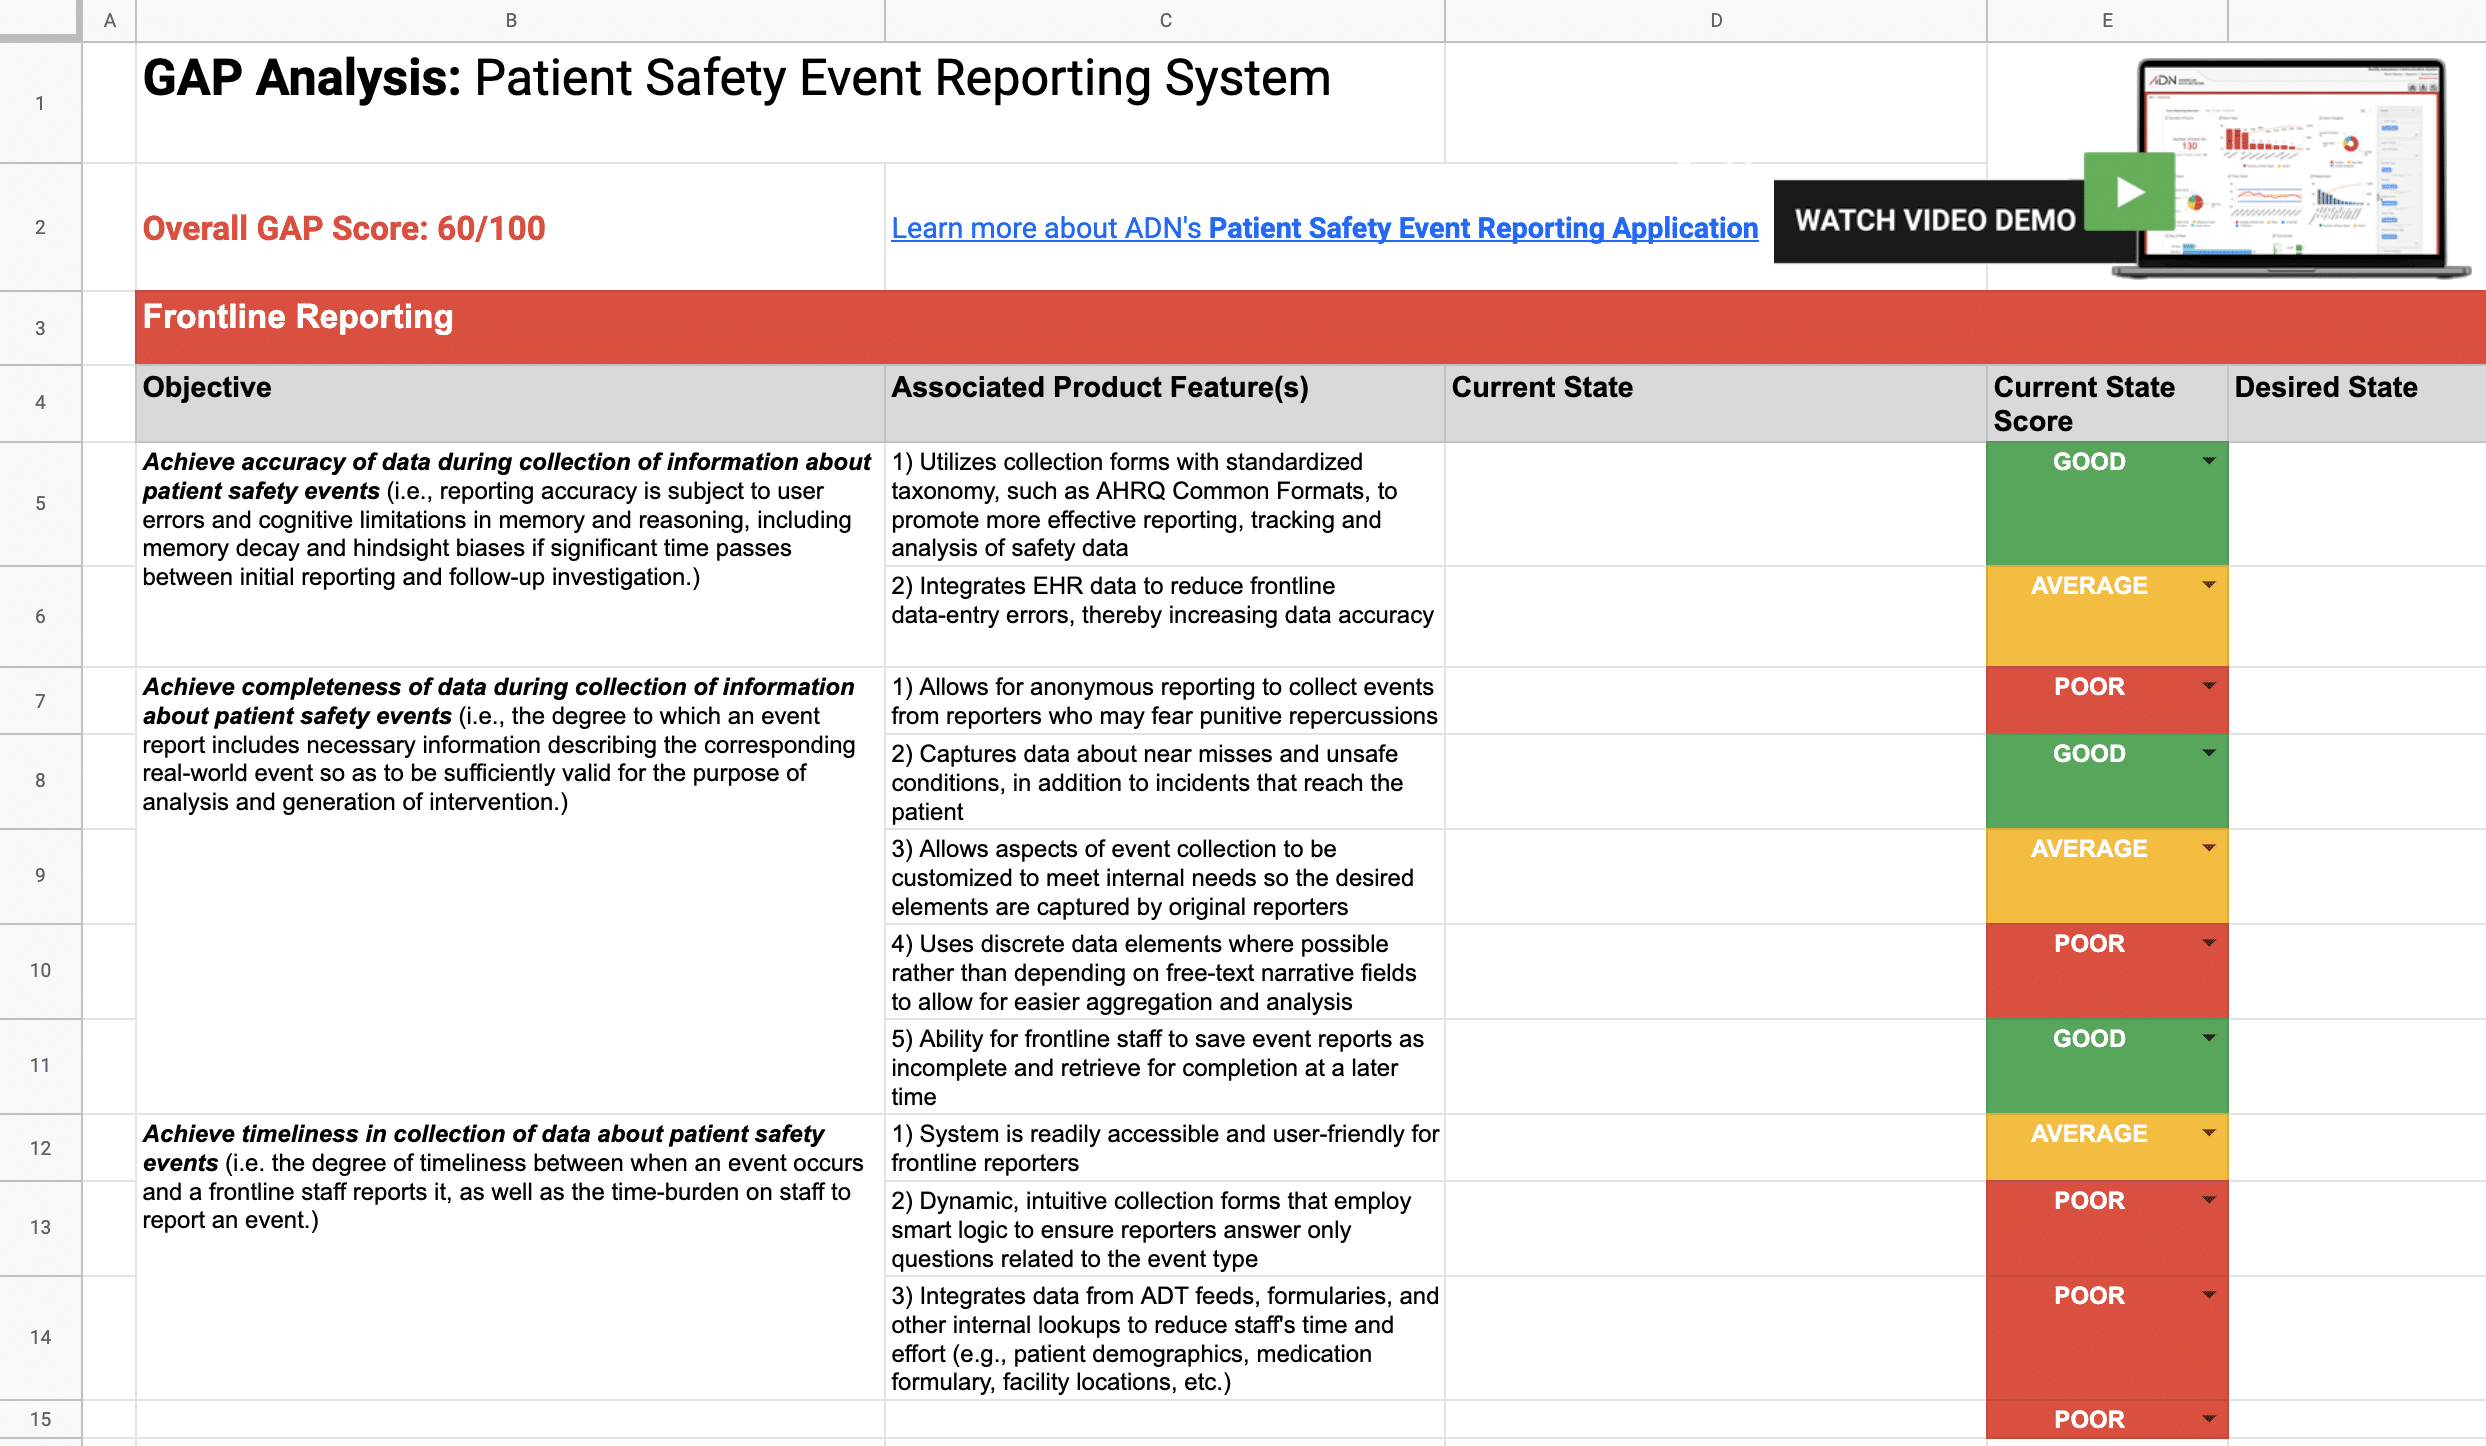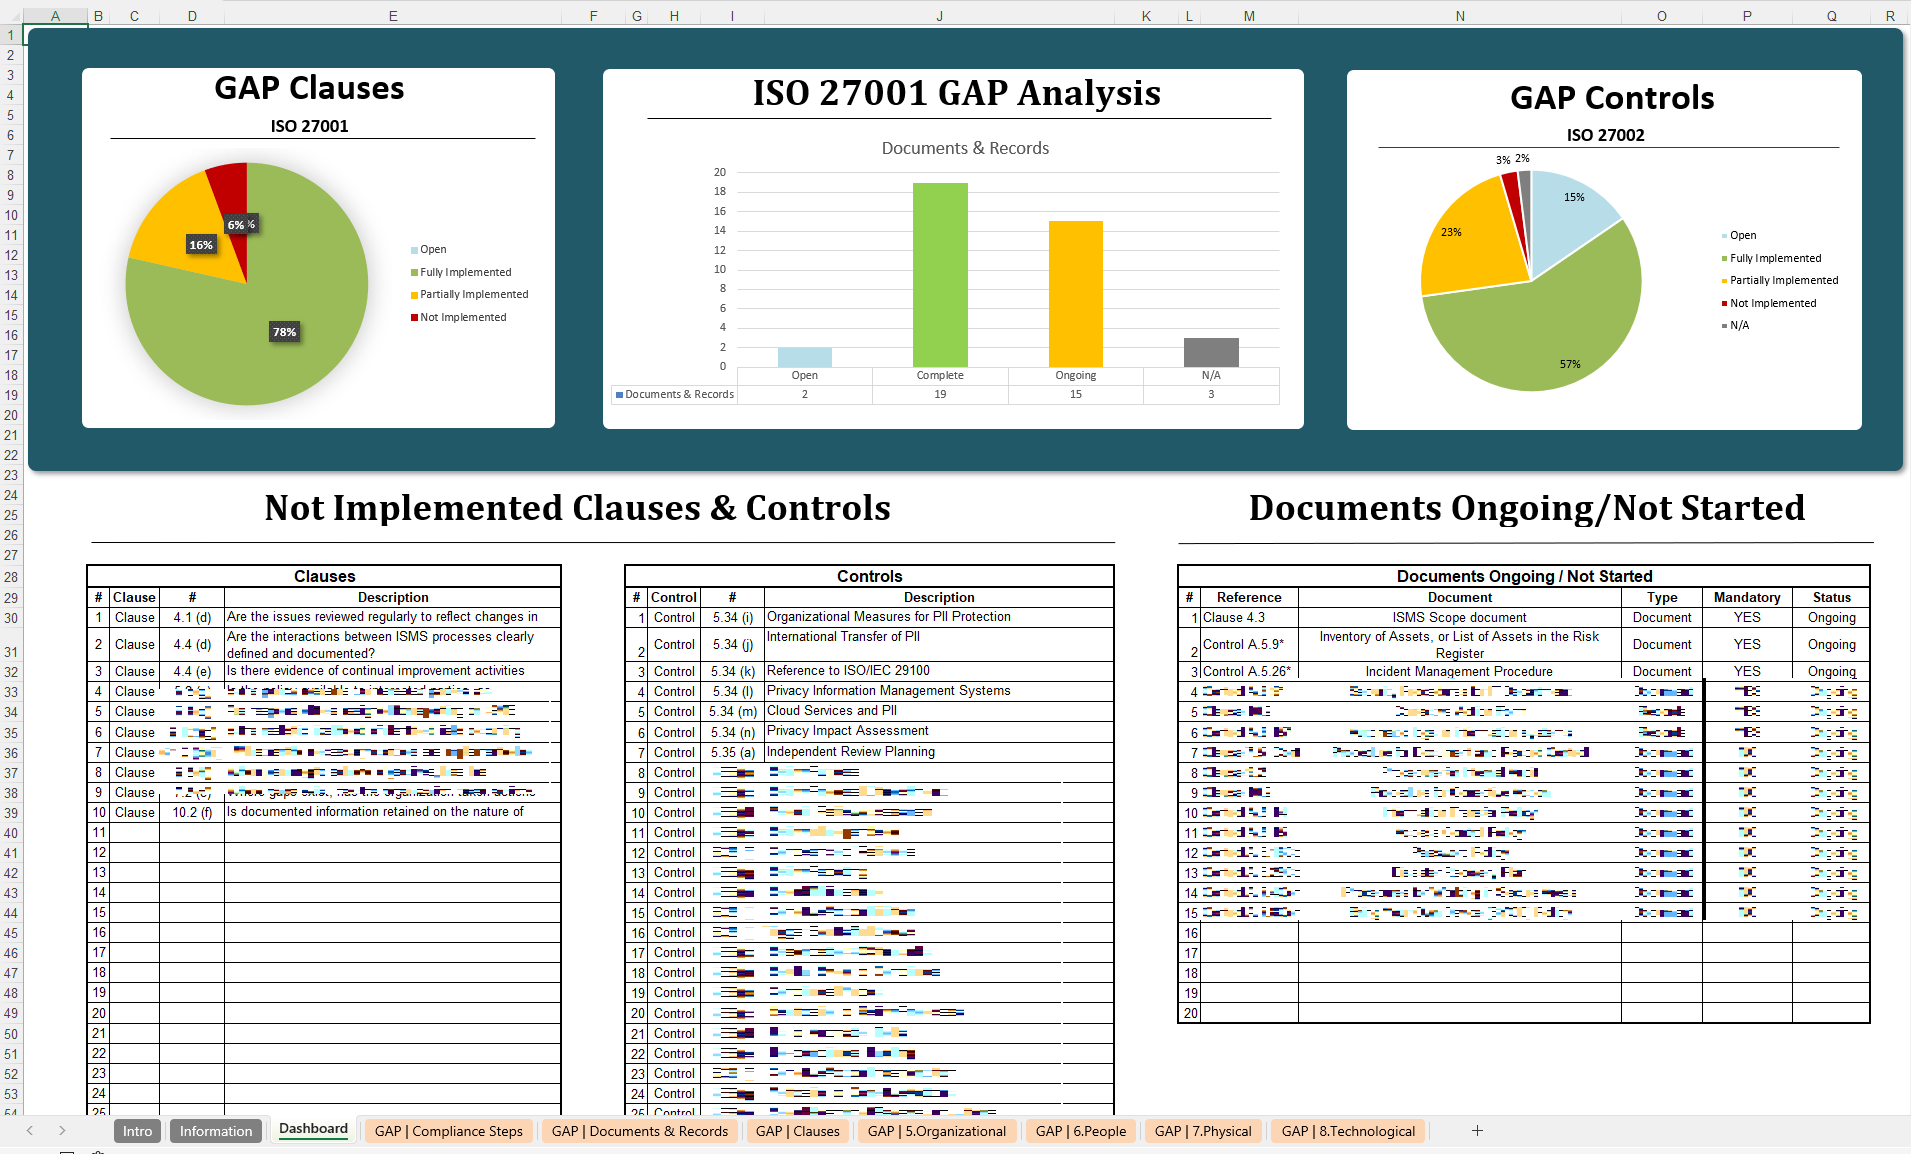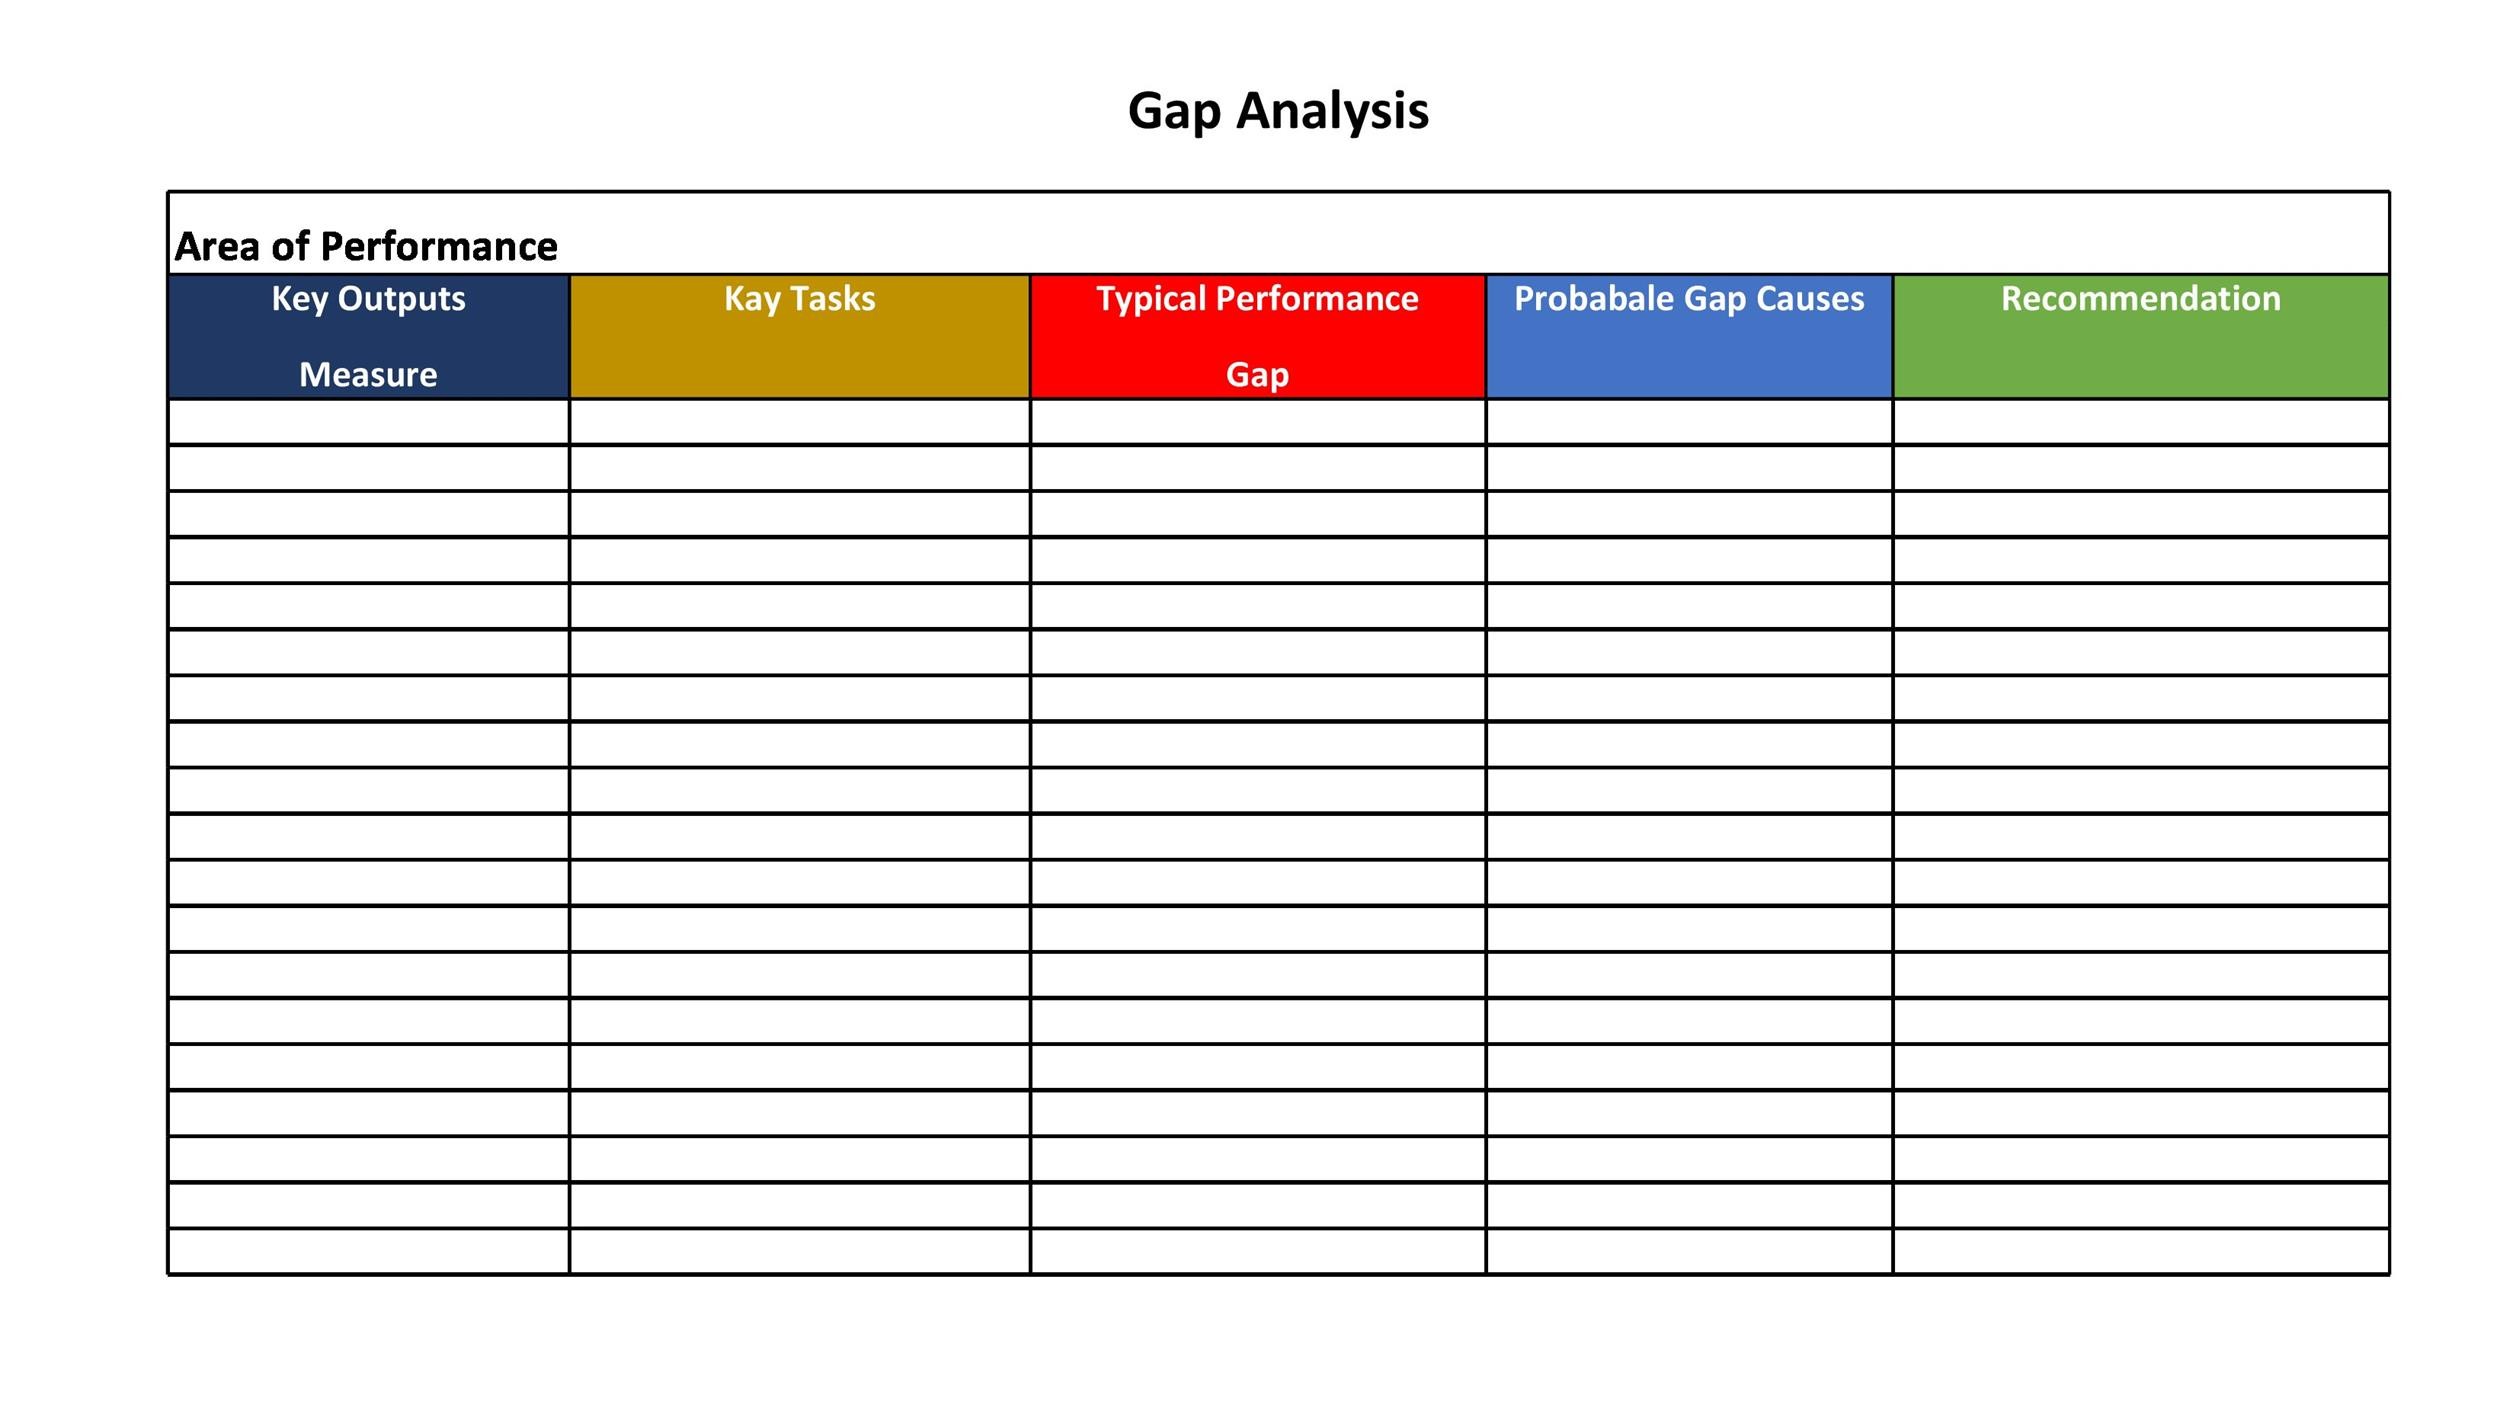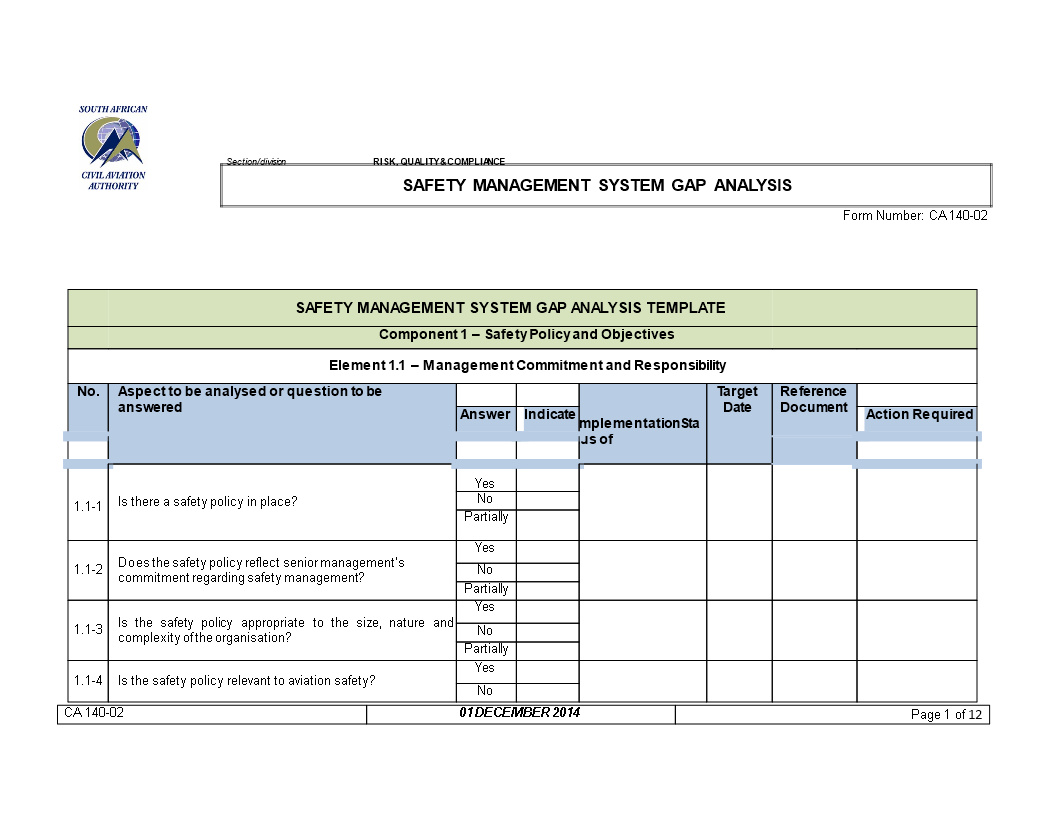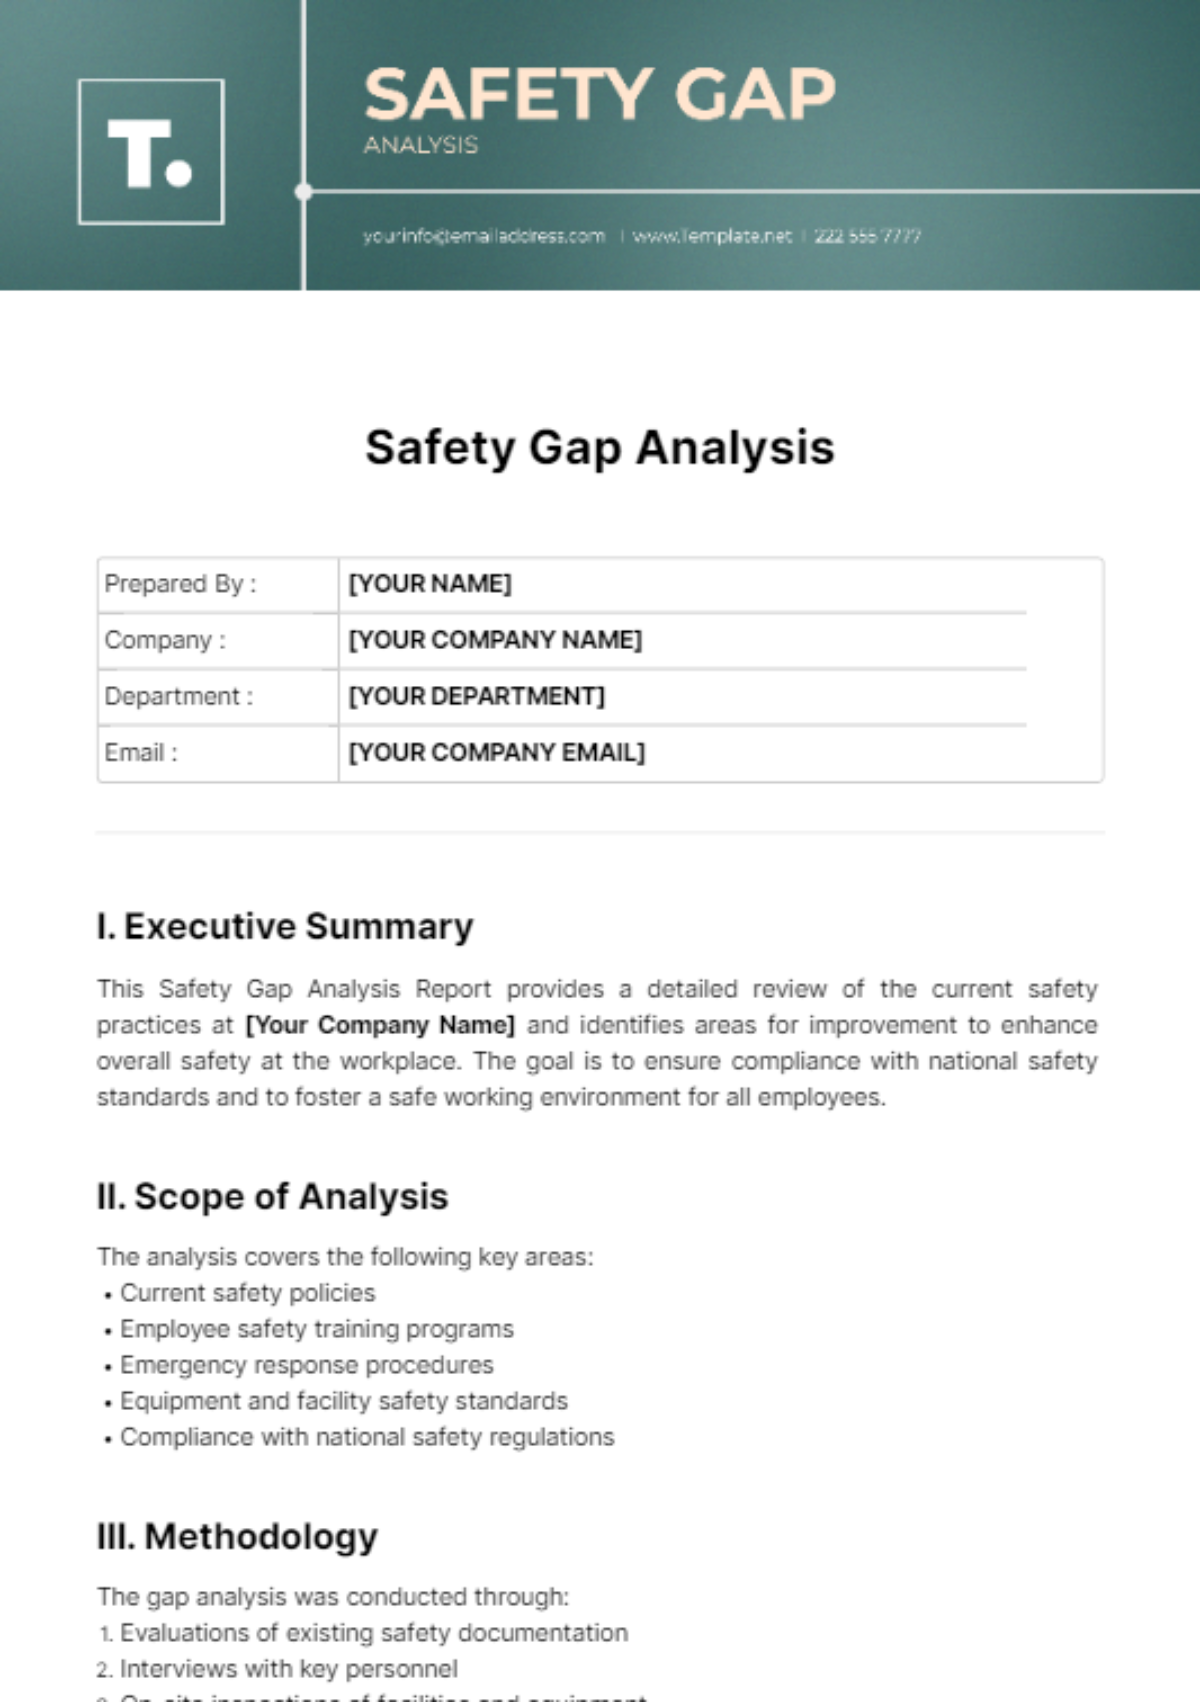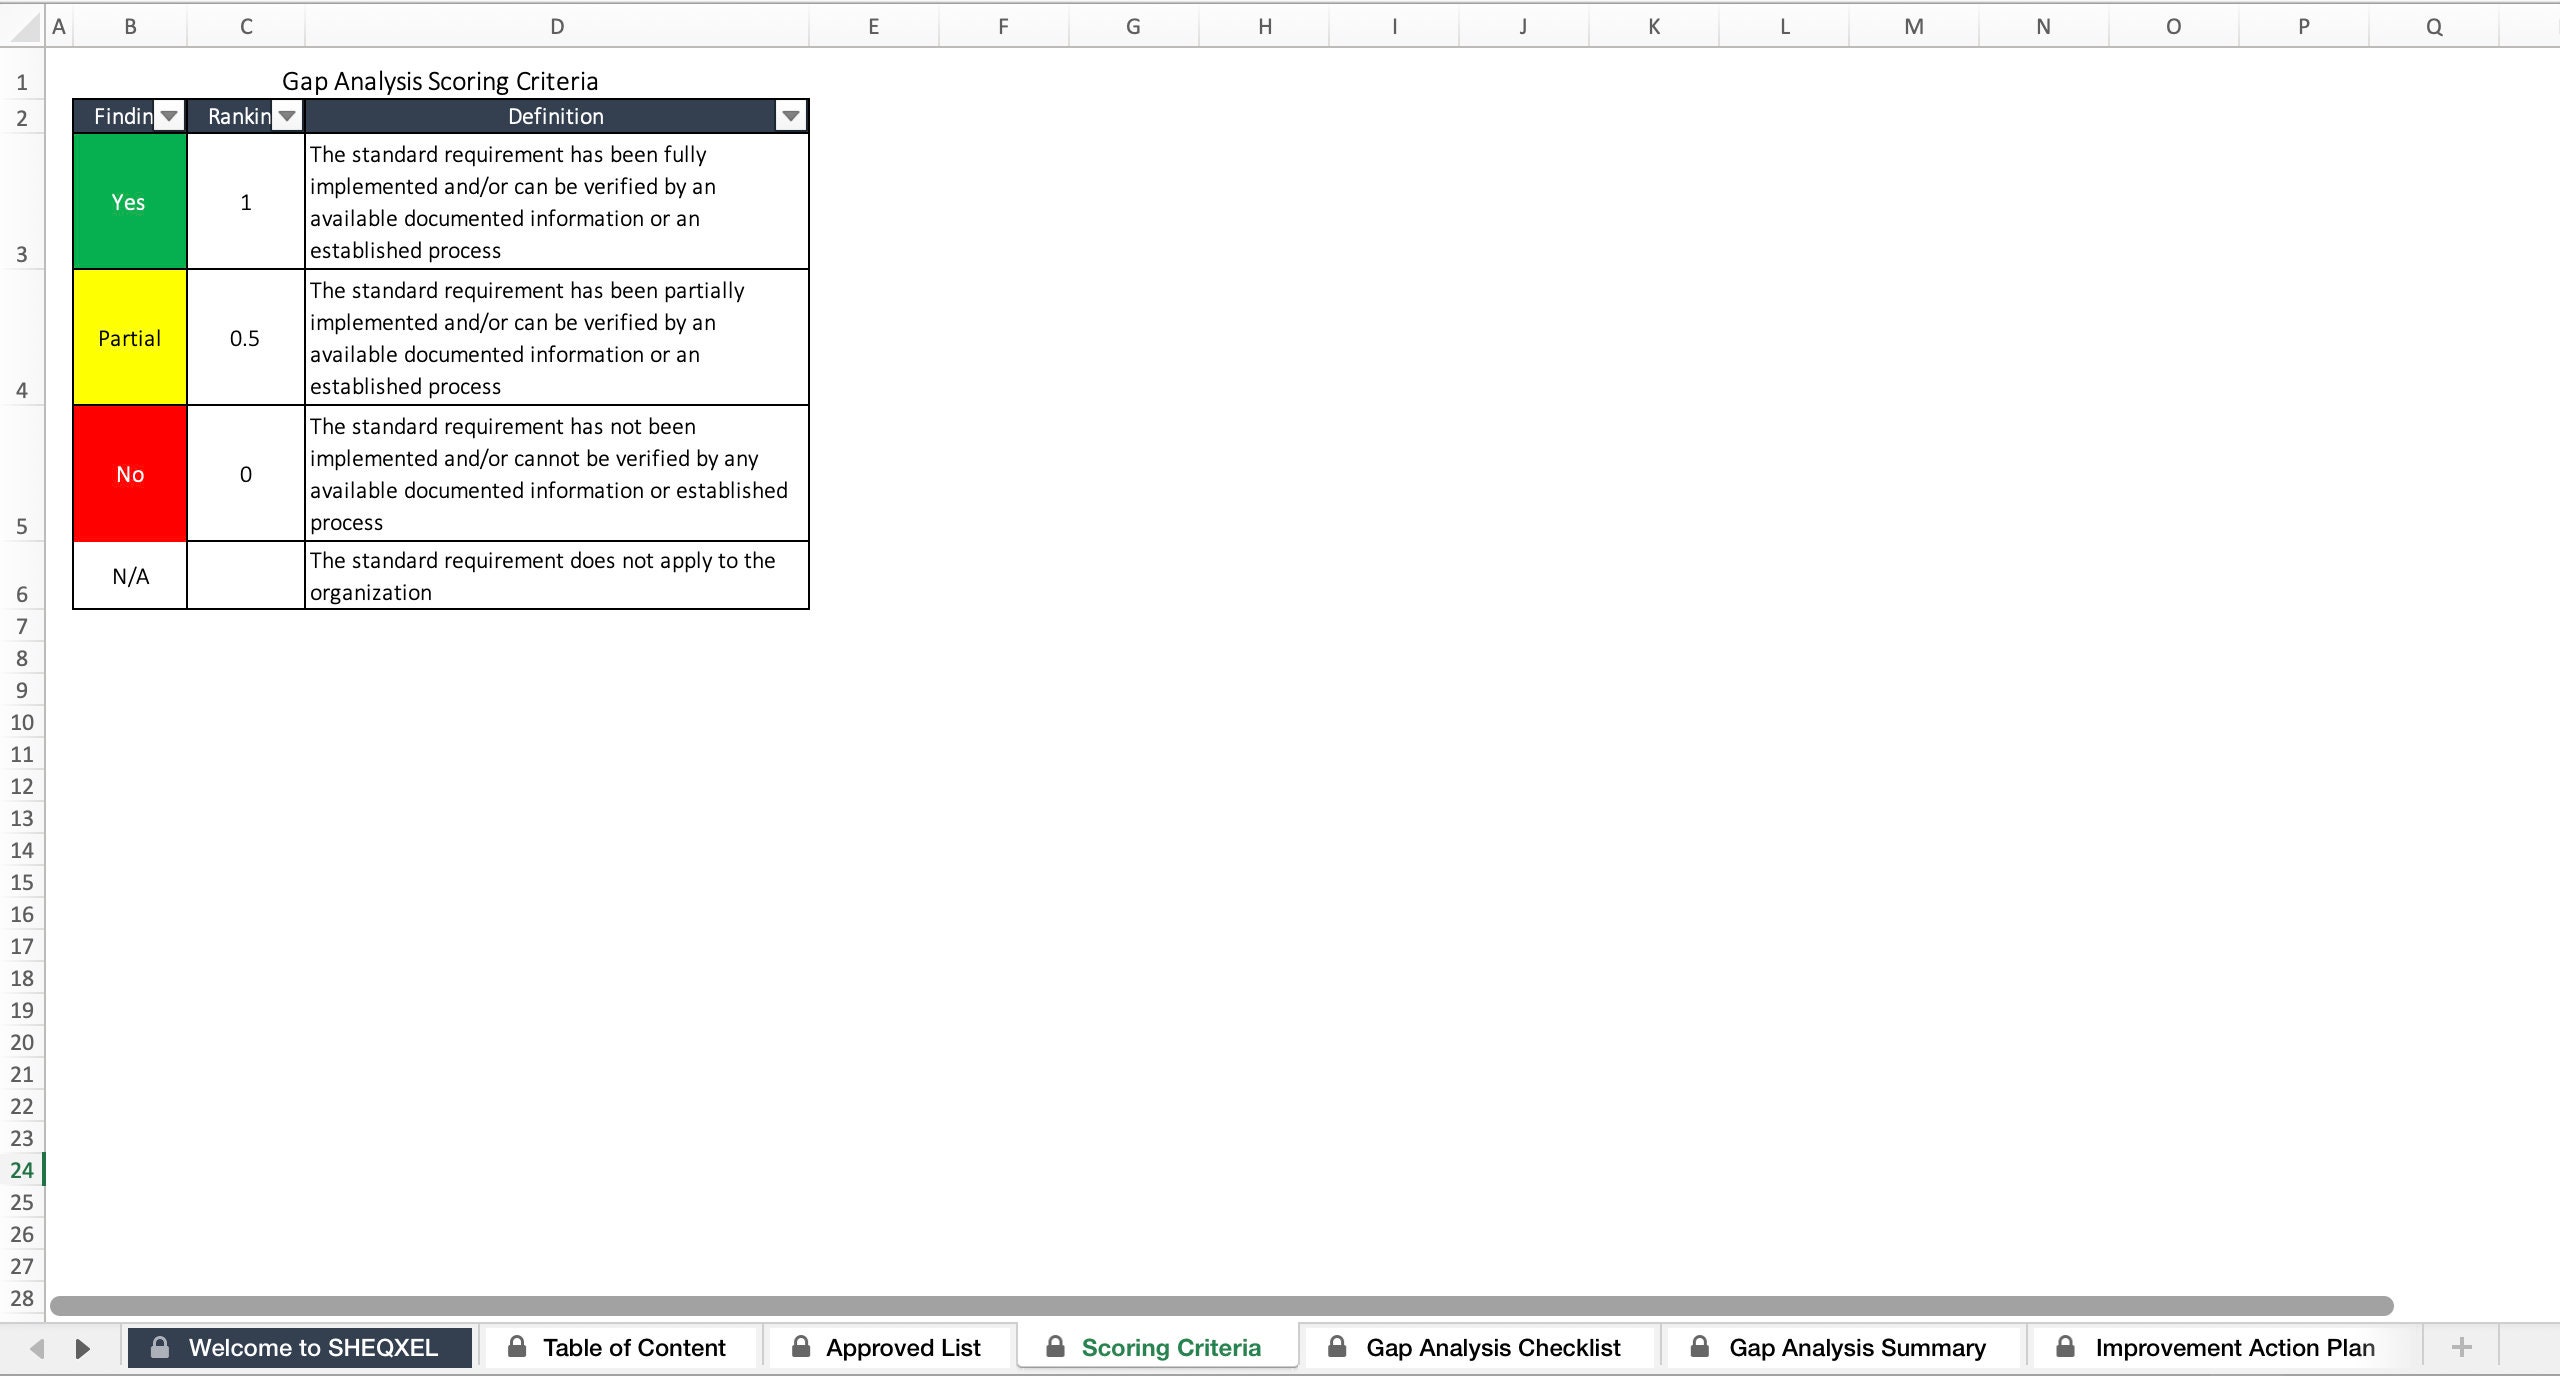
Safety Gap Analysis Template Excel stands as the silent sentinel that separates operational chaos from regulated compliance, a spreadsheet‑driven weapon that cuts through ambiguity and forces every hidden hazard into the harsh light of data‑driven scrutiny. In a world where a single oversight can cascade into catastrophic injury, the right template does more than list items—it creates a living, breathing map of risk, responsibility, and remediation that no manager can afford to ignore.
Why a Safety Gap Analysis Matters
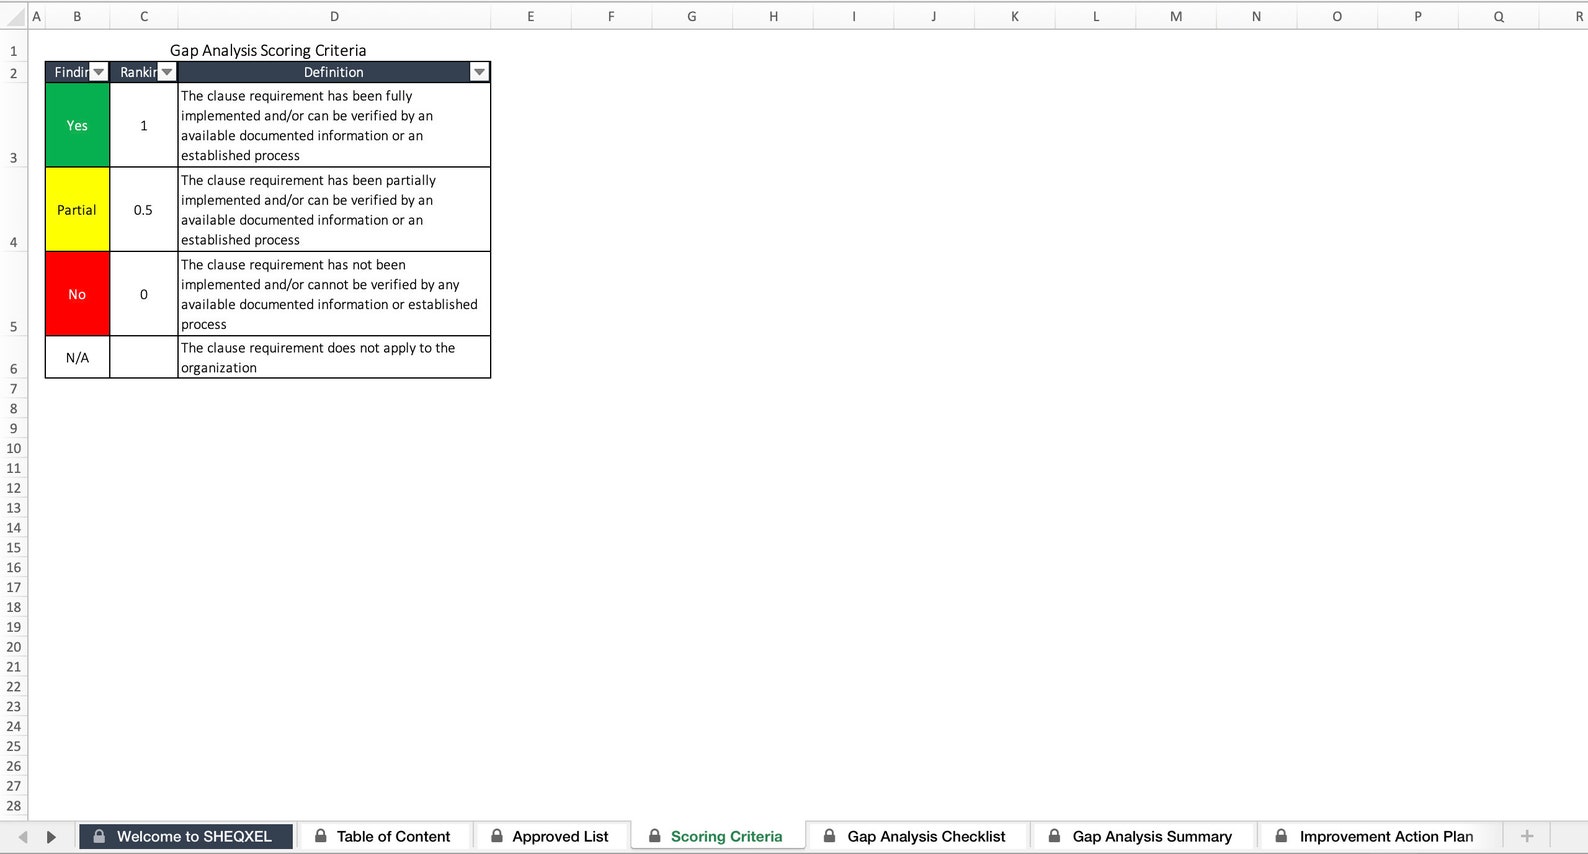
Every organization that touches the lives of workers, customers, or the public is bound by an invisible contract of safety. When that contract is broken, the fallout is not limited to fines or legal battles; it erodes trust, shatters morale, and can permanently scar a brand’s reputation. A gap analysis surfaces the chasms between current practices and the standards set by regulations like ISO 45001, OSHA, or industry‑specific mandates. By quantifying those gaps, leaders can prioritize remediation with surgical precision, allocate resources where they truly matter, and demonstrate due diligence to auditors and stakeholders alike.
The Cost of Ignorance
- Unplanned downtime that bleeds productivity.
- Insurance premiums that climb with each incident.
- Litigation expenses that dwarf preventive budgets.
- Employee turnover driven by a perceived lack of safety culture.
These costs are not abstract—they are the cold, hard reality that a robust Safety Gap Analysis Template Excel can help you avoid by turning guesswork into actionable insight.
Core Components of an Effective Excel Template
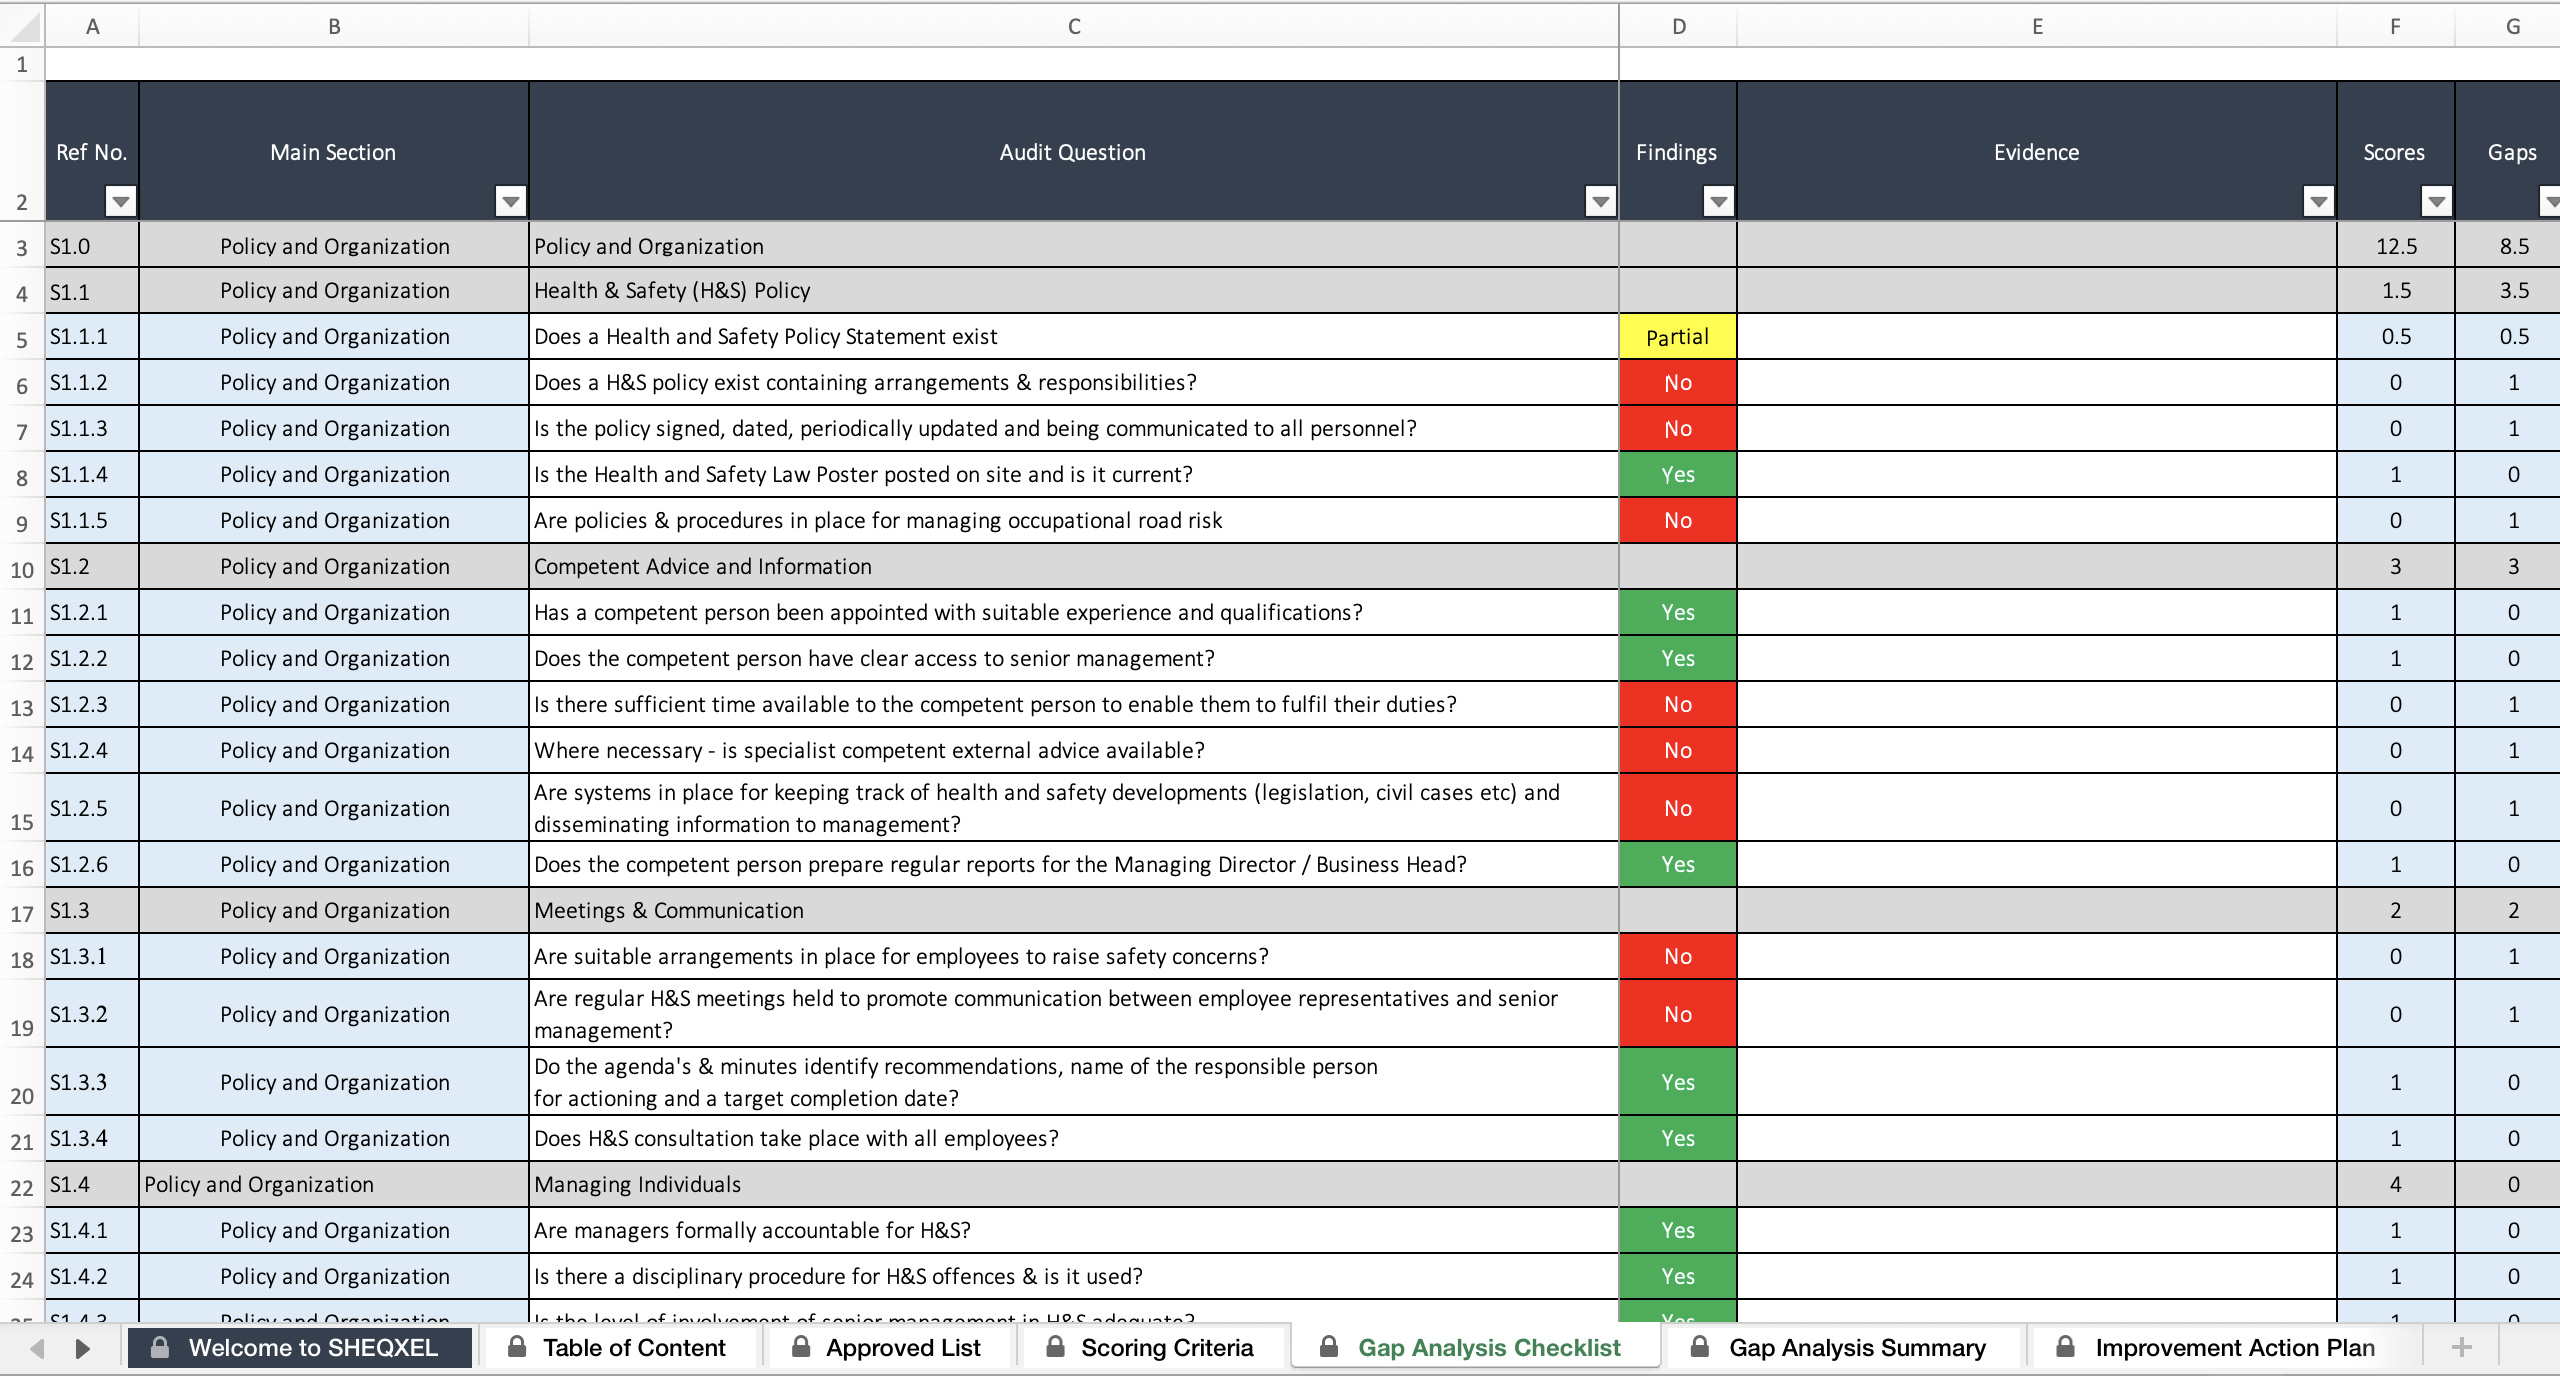
Excel may seem humble, but its flexibility and computational power make it a formidable platform for safety management. A well‑crafted template should weave together four essential pillars: data capture, risk scoring, compliance mapping, and remediation tracking.
Data Capture Matrix
At the heart of the template lies a matrix that logs every hazard, process, or control point. Columns typically include:
- Hazard ID – a unique alphanumeric code for traceability.
- Description – a concise narrative of the identified risk.
- Location – the physical or functional area where the hazard exists.
- Owner – the person or department accountable for mitigation.
- Current Control – existing safeguards, equipment, or procedures.
- Evidence – links to audit reports, photos, or inspection logs.
Risk Scoring Engine
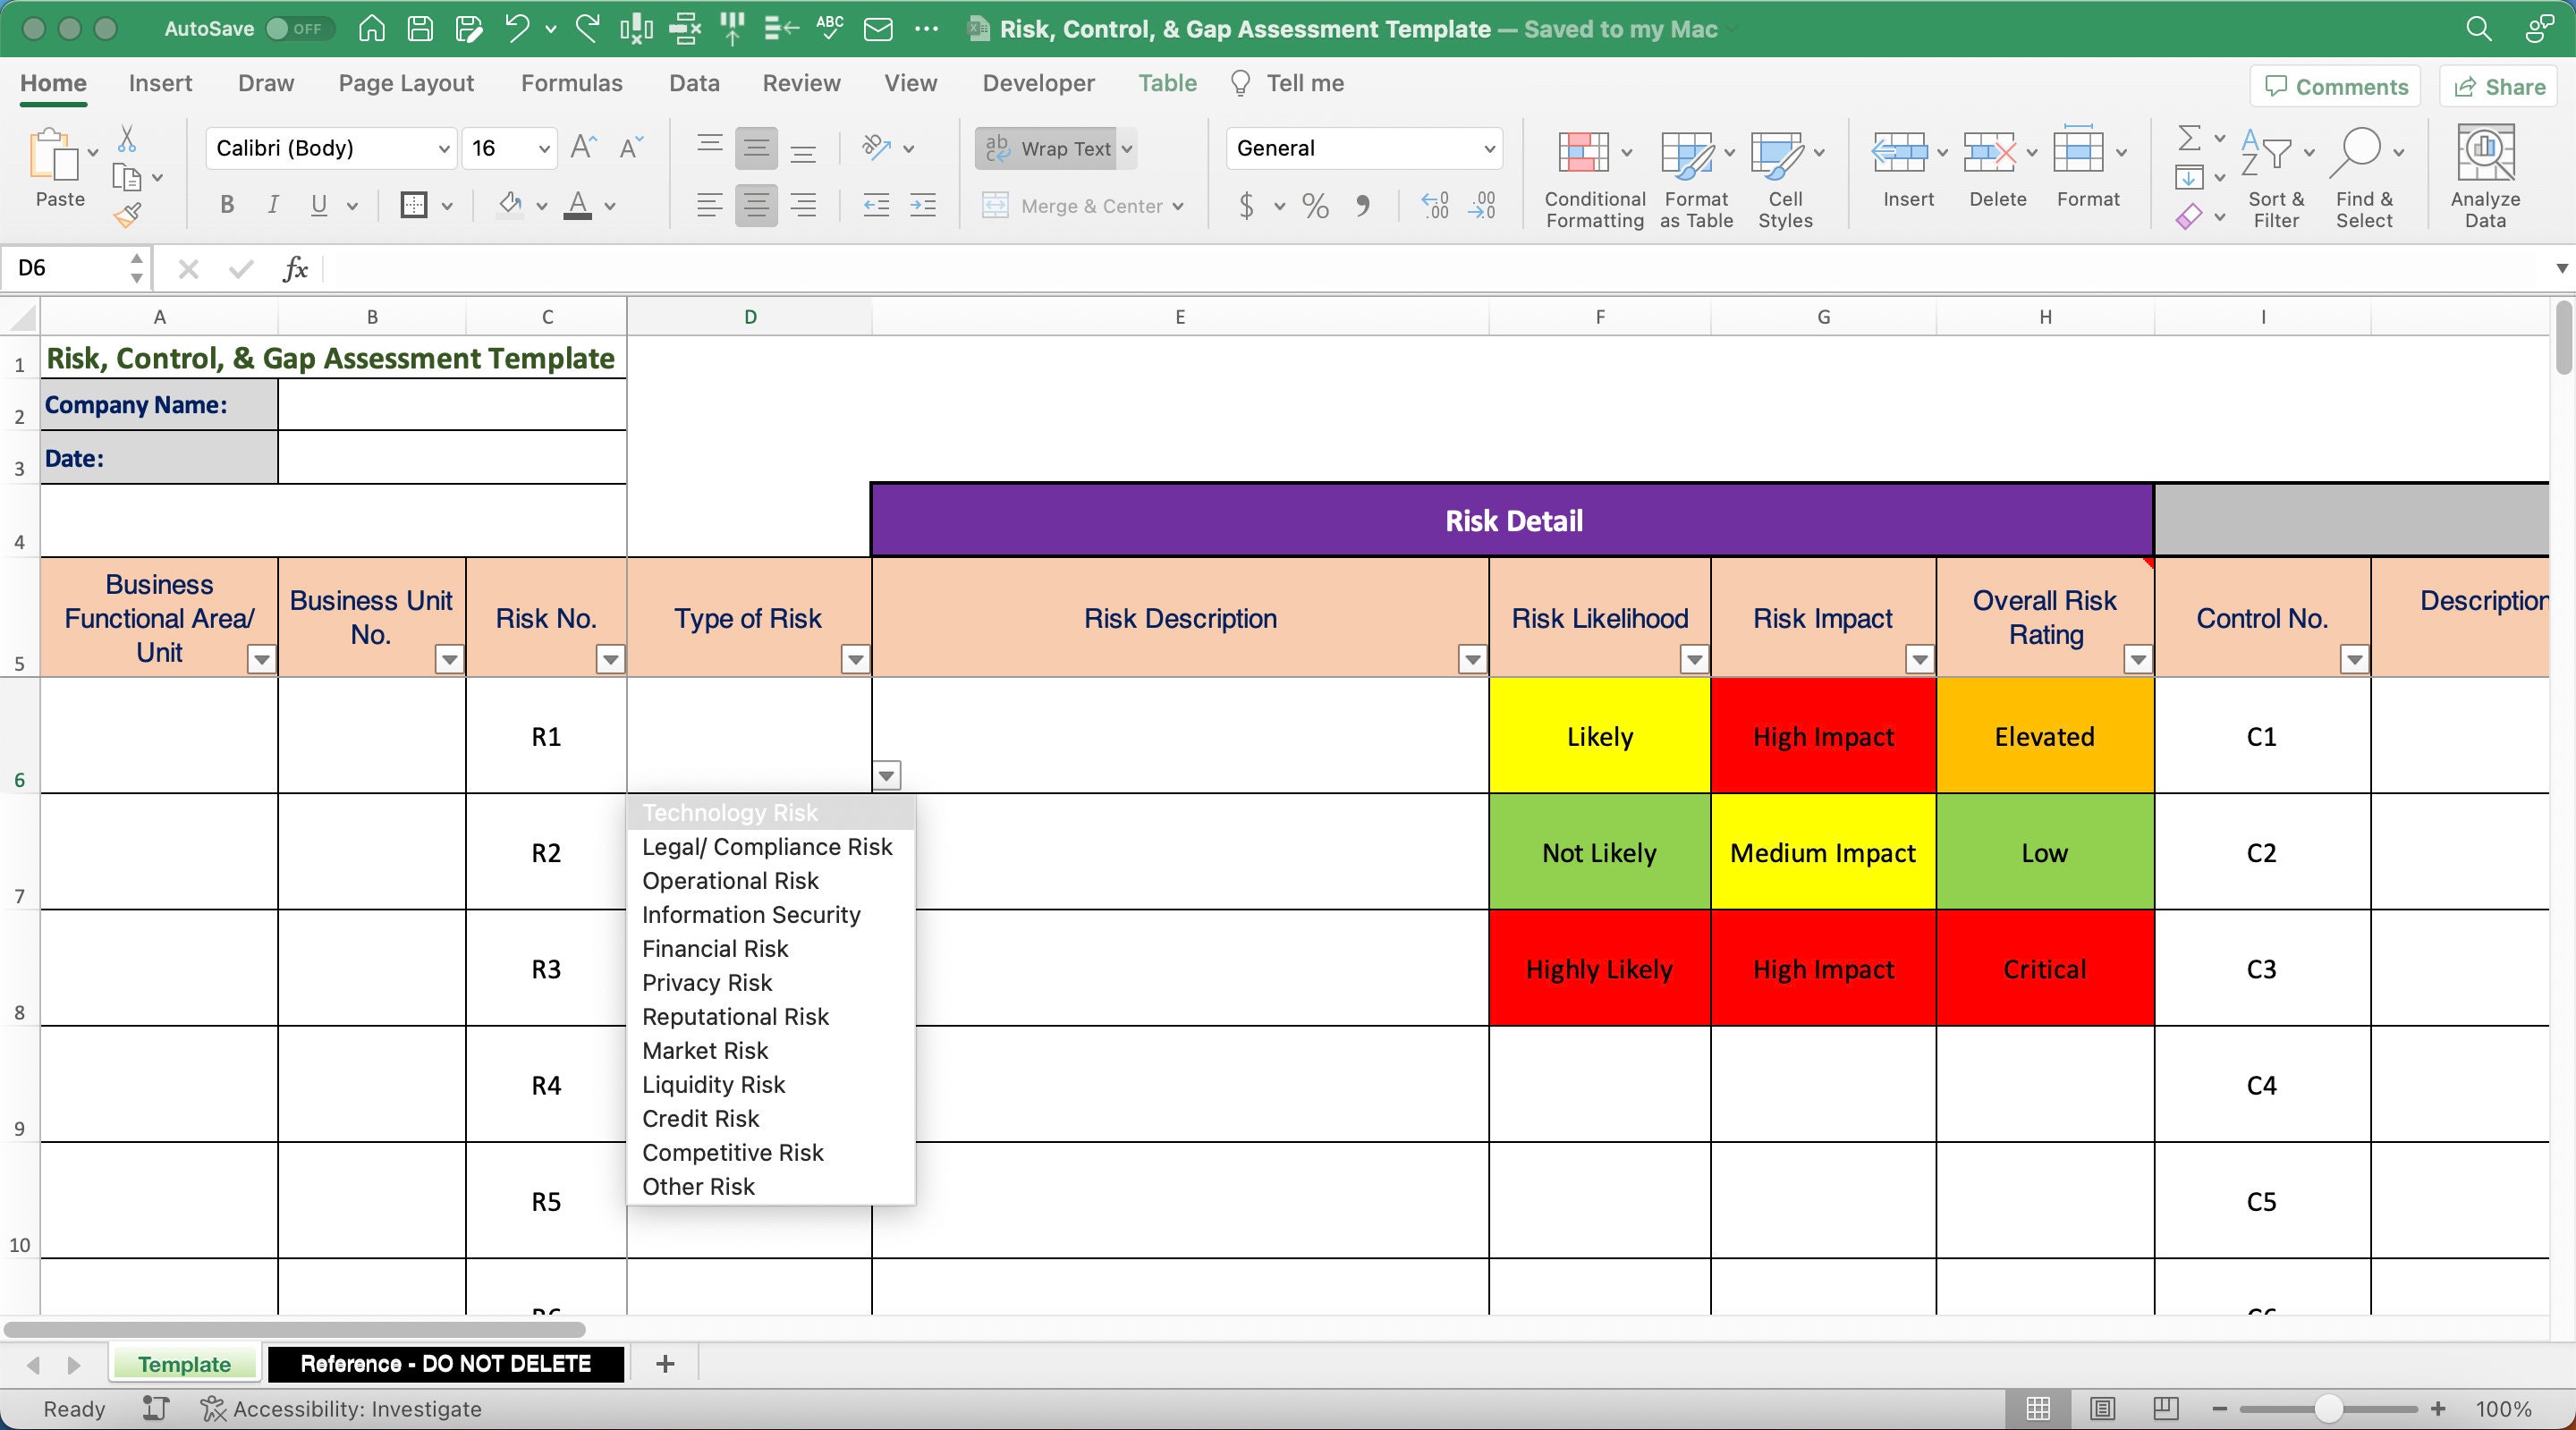
Risk must be quantified to be managed. A common approach pairs Likelihood (probability of occurrence) with Impact (severity of consequences) on a 1‑5 scale, yielding a risk score (Likelihood × Impact). Conditional formatting can instantly highlight high‑risk rows in blood‑red, mid‑risk in amber, and low‑risk in muted green, creating a visual hierarchy that forces attention where it belongs.
Compliance Mapping
Each hazard should be cross‑referenced against relevant standards—ISO 45001 clauses, OSHA regulations, or internal policies. Adding a Compliance Reference column allows auditors to trace how every identified gap aligns with a specific requirement, turning the spreadsheet into a ready‑made audit trail.
Remediation Tracker
The final pillar captures the journey from identification to resolution. Key fields include:
- Action Plan – detailed steps to close the gap.
- Target Date – a firm deadline that drives accountability.
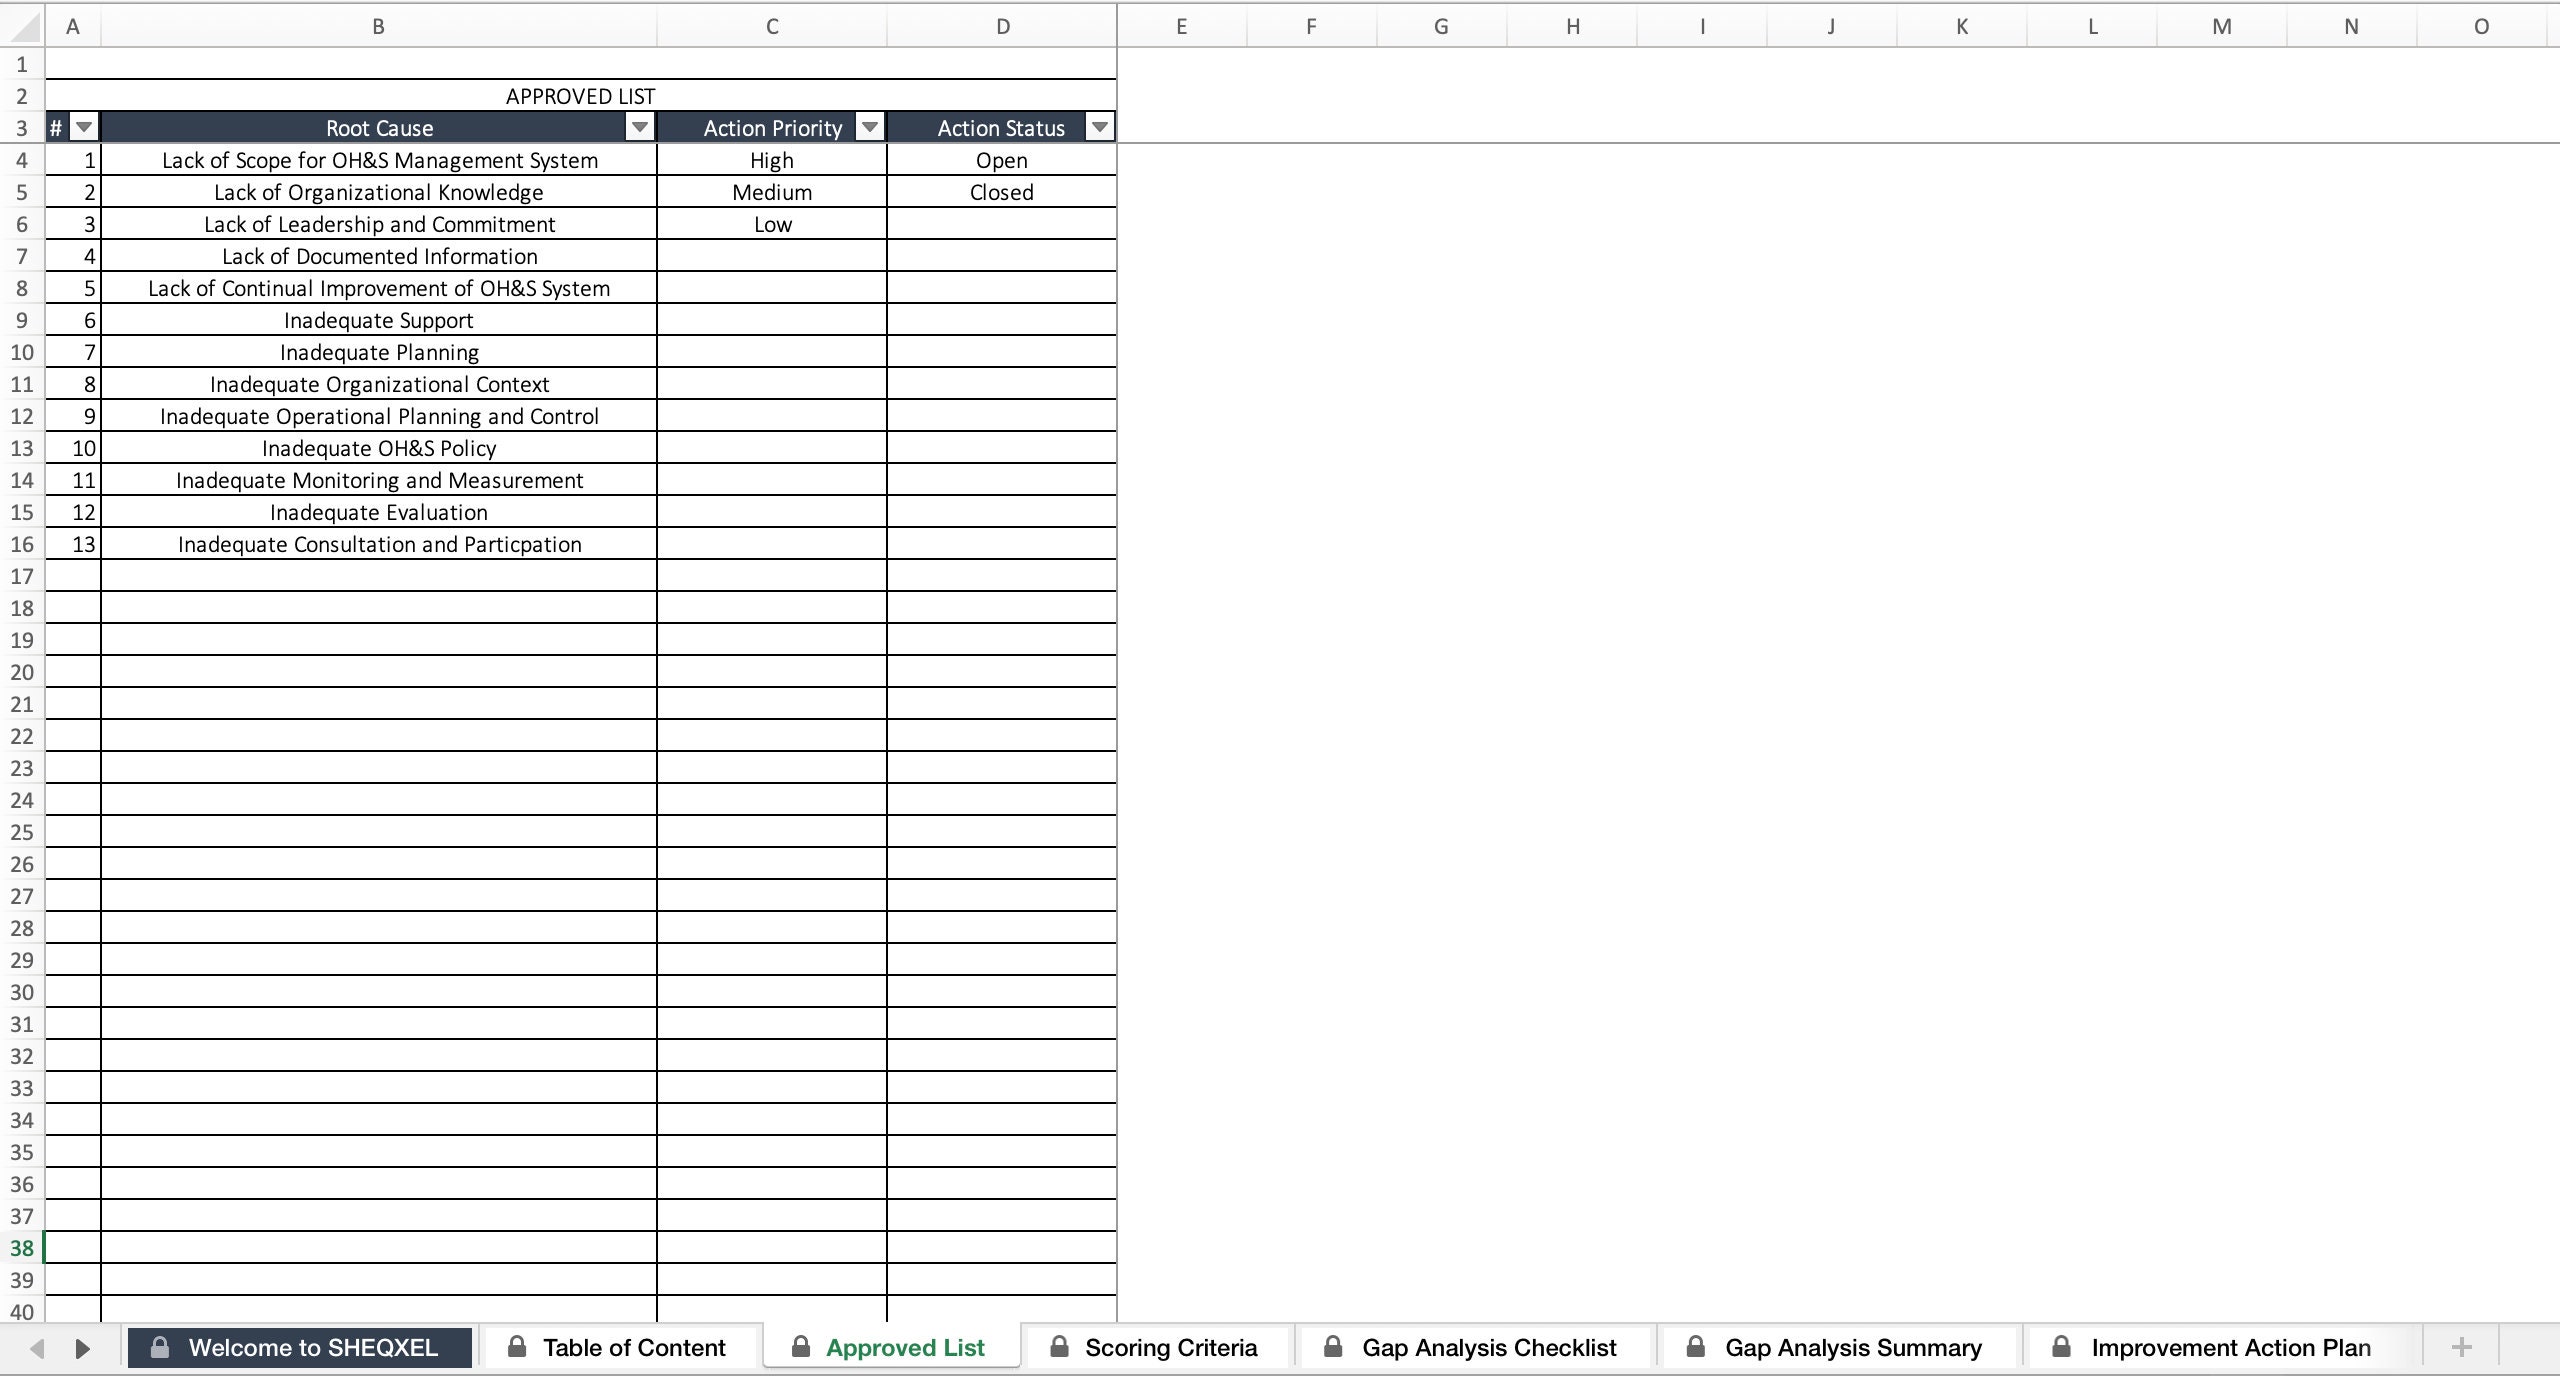
- Status – drop‑down options such as “Not Started,” “In Progress,” “Completed,” or “Deferred.”
- Verification – evidence that the corrective action was effective.
- Residual Risk – a recalculated score after mitigation, indicating whether the risk is now acceptable.
When these pillars are interlinked, the template becomes a living dashboard rather than a static checklist.
Step‑by‑Step Guide to Building Your Template
Transforming a blank workbook into a high‑impact safety instrument requires discipline and a clear roadmap. Follow these steps to avoid common pitfalls and ensure the final product is both robust and user‑friendly.
Step 1: Define Scope and Stakeholders
Begin by outlining the operational boundaries of the analysis. Are you evaluating a single plant, an entire corporate campus, or a fleet of field sites? Identify the key owners—EHS managers, line supervisors, and department heads—who will populate and maintain the data. Document this scope in a dedicated “Metadata” sheet, complete with version control and a change log.
Step 2: Set Up the Data Capture Sheet
Create a sheet named “Hazard Register.” Insert column headers as described in the Core Components section. Apply data validation to enforce consistency—use drop‑down lists for owners, locations, and risk categories. This prevents the chaos of free‑text entries that can cripple later analysis.
Step 3: Build the Risk Scoring Formula
In adjacent columns, insert numeric fields for Likelihood and Impact. Use a simple formula like =B2*C2 to calculate the Risk Score. Then apply conditional formatting rules:
- Score ≥ 15 → red fill.
- Score 8‑14 → orange fill.
- Score ≤ 7 → green fill.
This visual cue turns raw numbers into an immediate, visceral alarm system.
Step 4: Map Compliance Requirements
Develop a master list of applicable standards on a separate sheet titled “Compliance Matrix.” Assign each standard a short code (e.g., ISO45001‑5.1). In the Hazard Register, use a VLOOKUP or XLOOKUP function to auto‑populate the relevant clauses based on hazard type. This ensures that every gap is directly tied to a regulatory mandate.
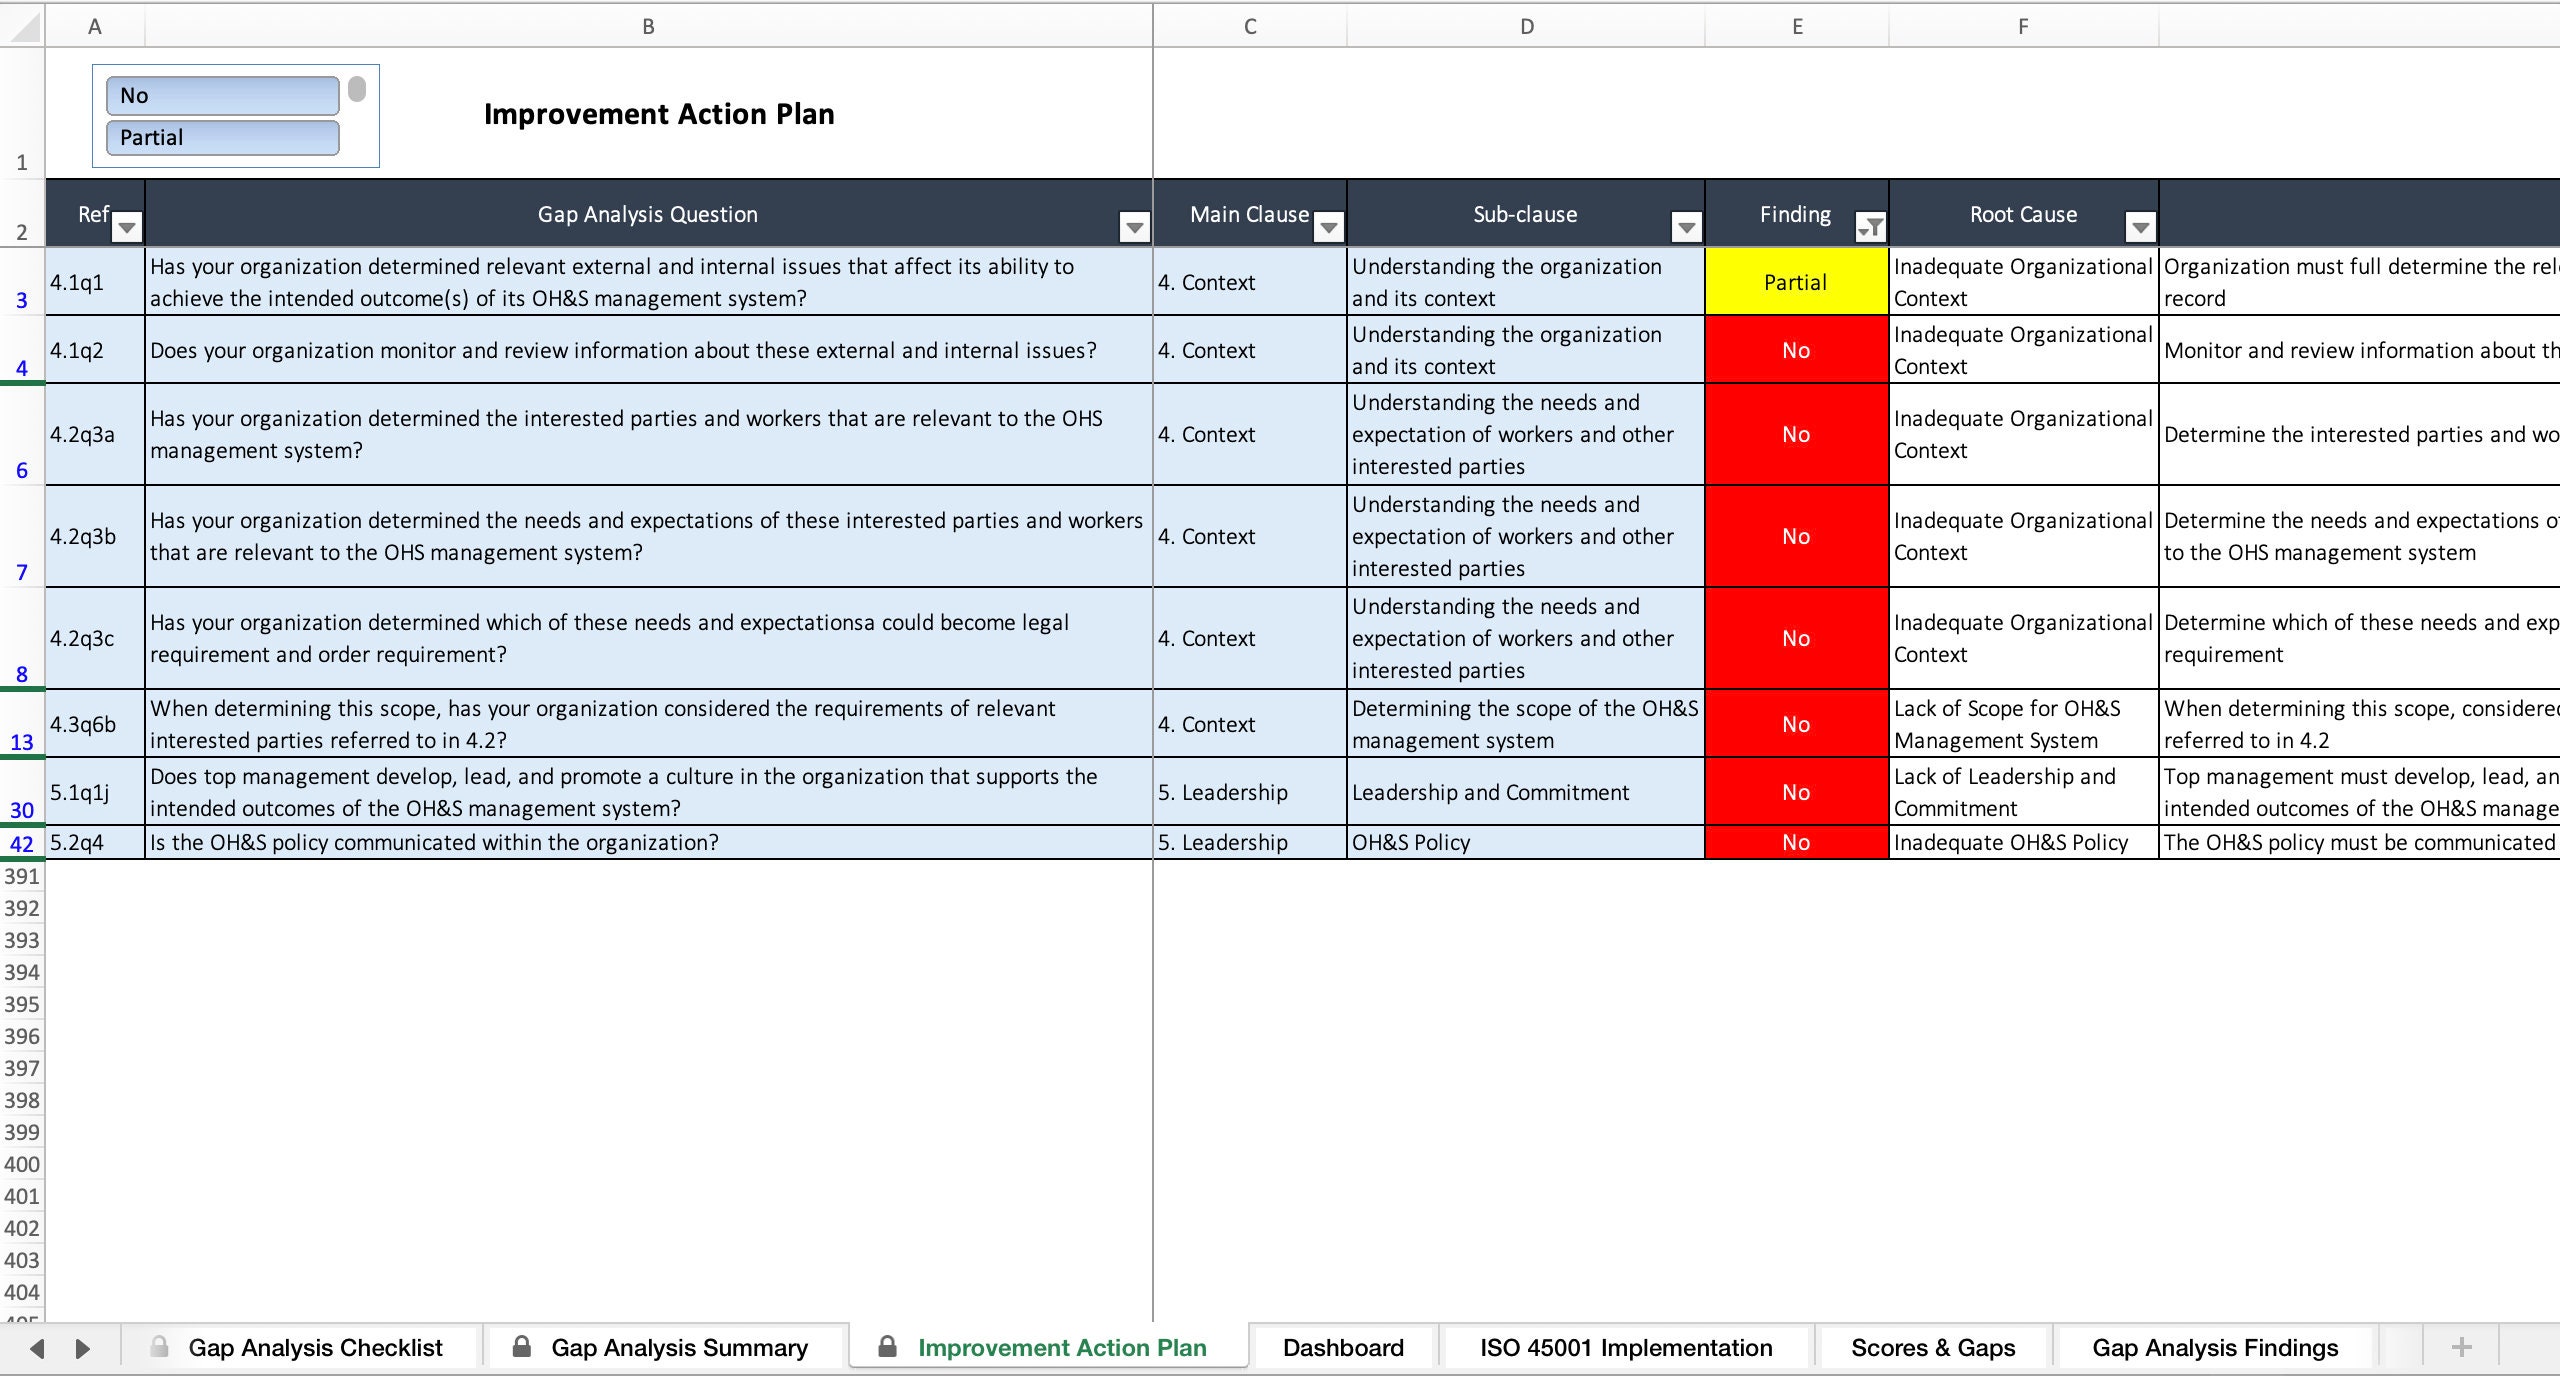
Step 5: Design the Remediation Tracker
Add columns for Action Plan, Target Date, Status, Verification, and Residual Risk. Leverage Excel’s built‑in “Data Validation → List” feature to standardize status entries. Use the TODAY() function combined with conditional formatting to flag overdue actions in bold red text, creating a built‑in escalation mechanism.
Step 6: Consolidate into a Dashboard
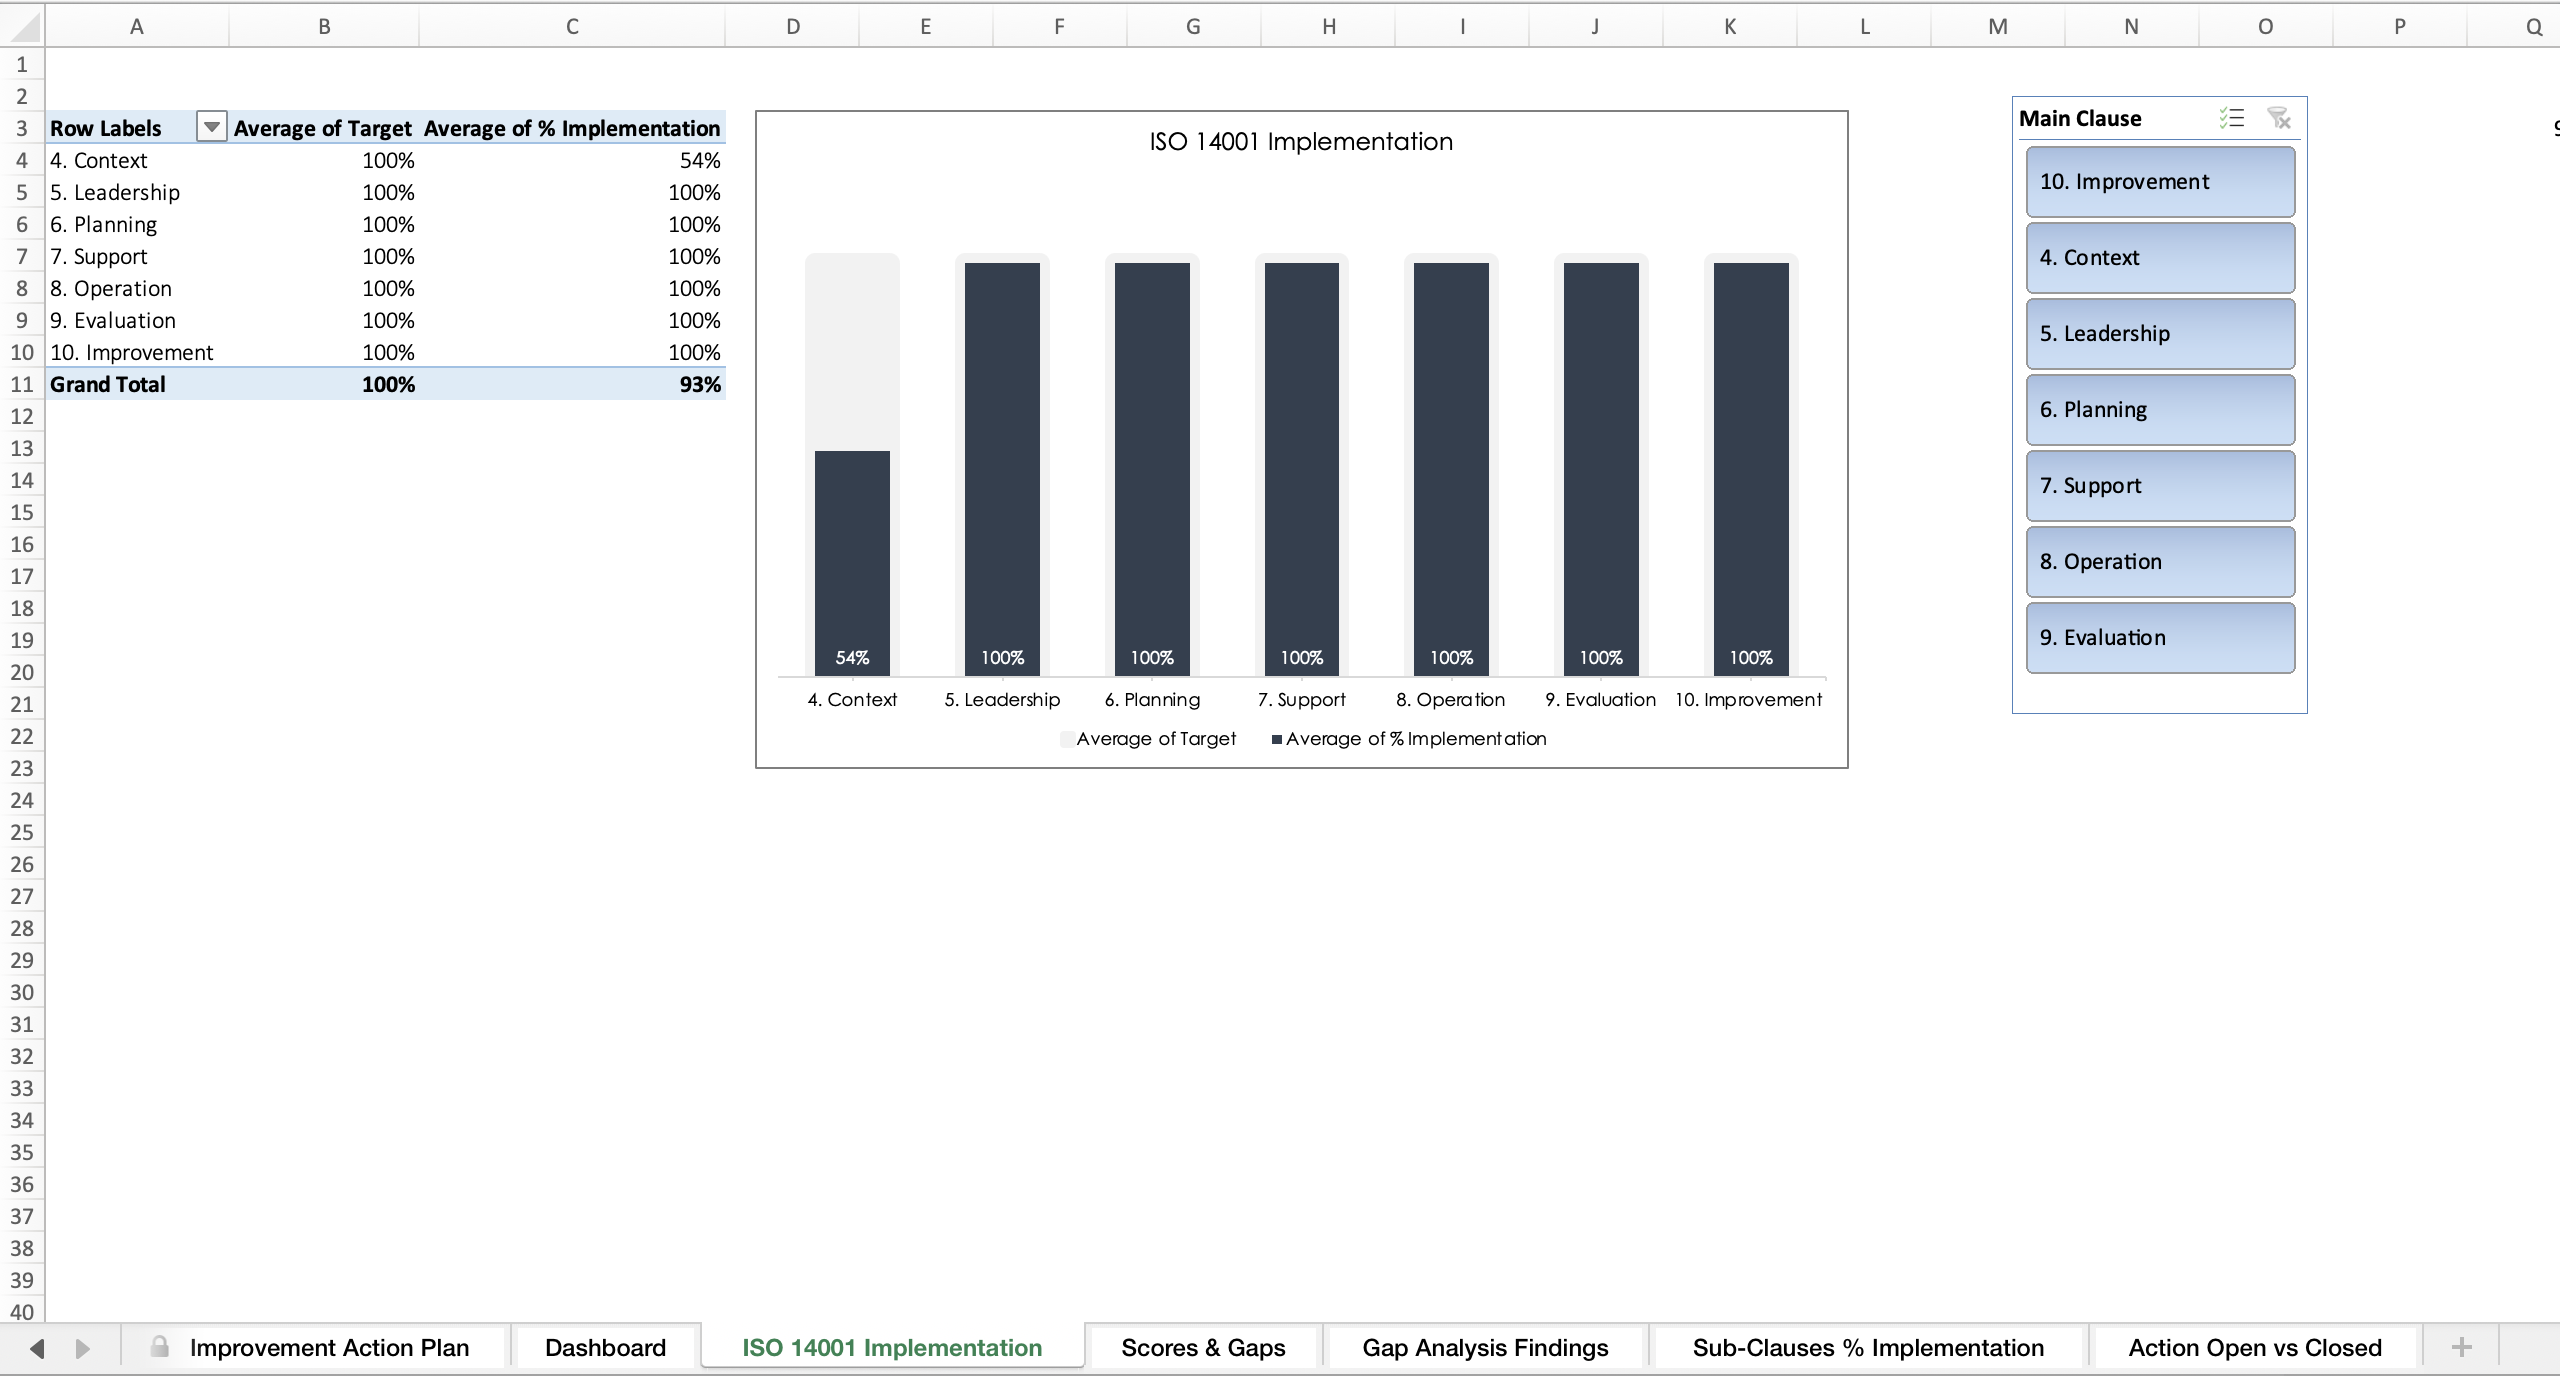
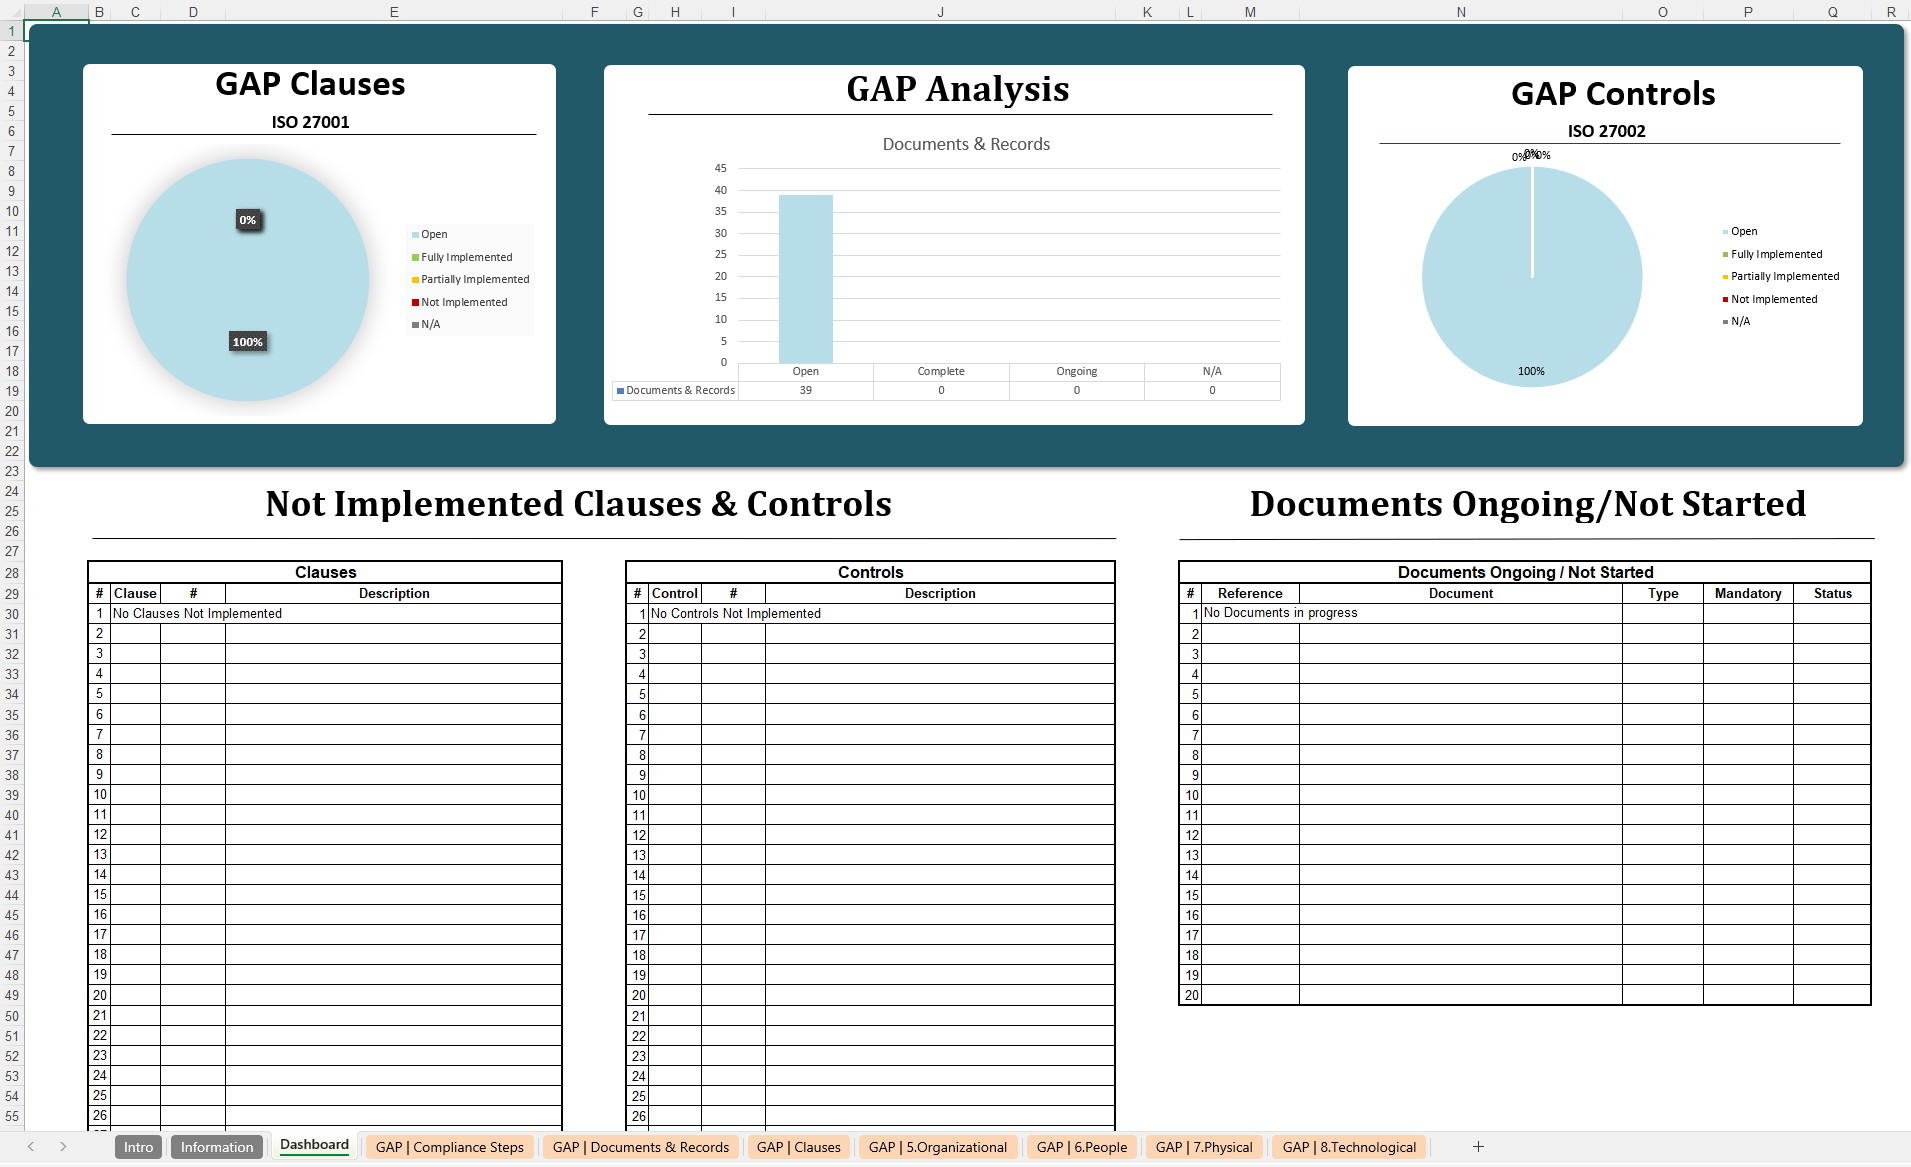
Summarize key metrics on a “Dashboard” sheet using PivotTables and slicers. Include visualizations such as:
- A bar chart of high‑risk hazards by location.
- A pie chart of compliance coverage (e.g., % of hazards mapped to ISO 45001).
- A line graph tracking the reduction of total risk score over time.
This high‑level view enables executives to grasp the safety posture at a glance and make strategic decisions without drowning in spreadsheet minutiae.
Step 7: Protect and Distribute
Lock cells that contain formulas or static reference data to prevent accidental overwrites. Use worksheet protection with a password shared only among senior safety personnel. Finally, store the workbook in a centralized, version‑controlled repository (such as SharePoint or a secure network drive) to guarantee that every stakeholder works from the same, up‑to‑date source.
Integrating ISO 45001 Requirements
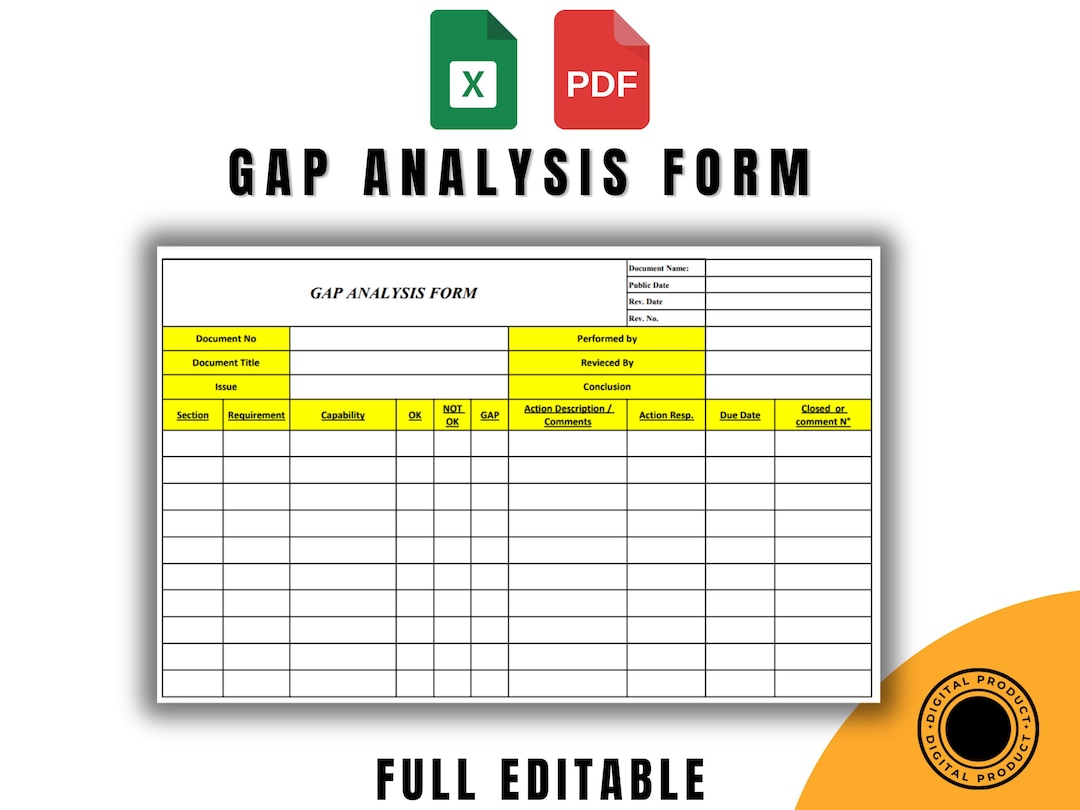
ISO 45001 provides a globally recognized framework for occupational health and safety management. Embedding its clauses within your Excel template bridges the gap between internal risk assessments and external certification standards.
Clause‑by‑Clause Alignment
Map each hazard to the specific ISO 45001 clause it addresses. For instance, a machine guarding deficiency aligns with Clause 8.1 (Operational Planning and Control), while a lack of employee training ties to Clause 7.2 (Competence). By tagging hazards with clause codes, you create a direct line of sight that auditors love and management respects.
Risk Treatment Hierarchy
ISO 45001 emphasizes the hierarchy of controls: elimination, substitution, engineering controls, administrative controls, and personal protective equipment (PPE). Add a “Control Level” column that forces users to select the highest‑order control applied. This not only drives better safety decisions but also provides evidence of compliance with the standard’s preventive philosophy.
Performance Metrics
ISO 45001 requires organizations to monitor and measure OH&S performance. Leverage the dashboard to track key performance indicators (KPIs) such as:
- Number of high‑risk gaps identified versus resolved each quarter.
- Average time to close a corrective action.
- Trend of residual risk scores across all locations.
These metrics can be exported directly to management review presentations, satisfying both internal and external reporting obligations.
Real‑World Application Scenarios
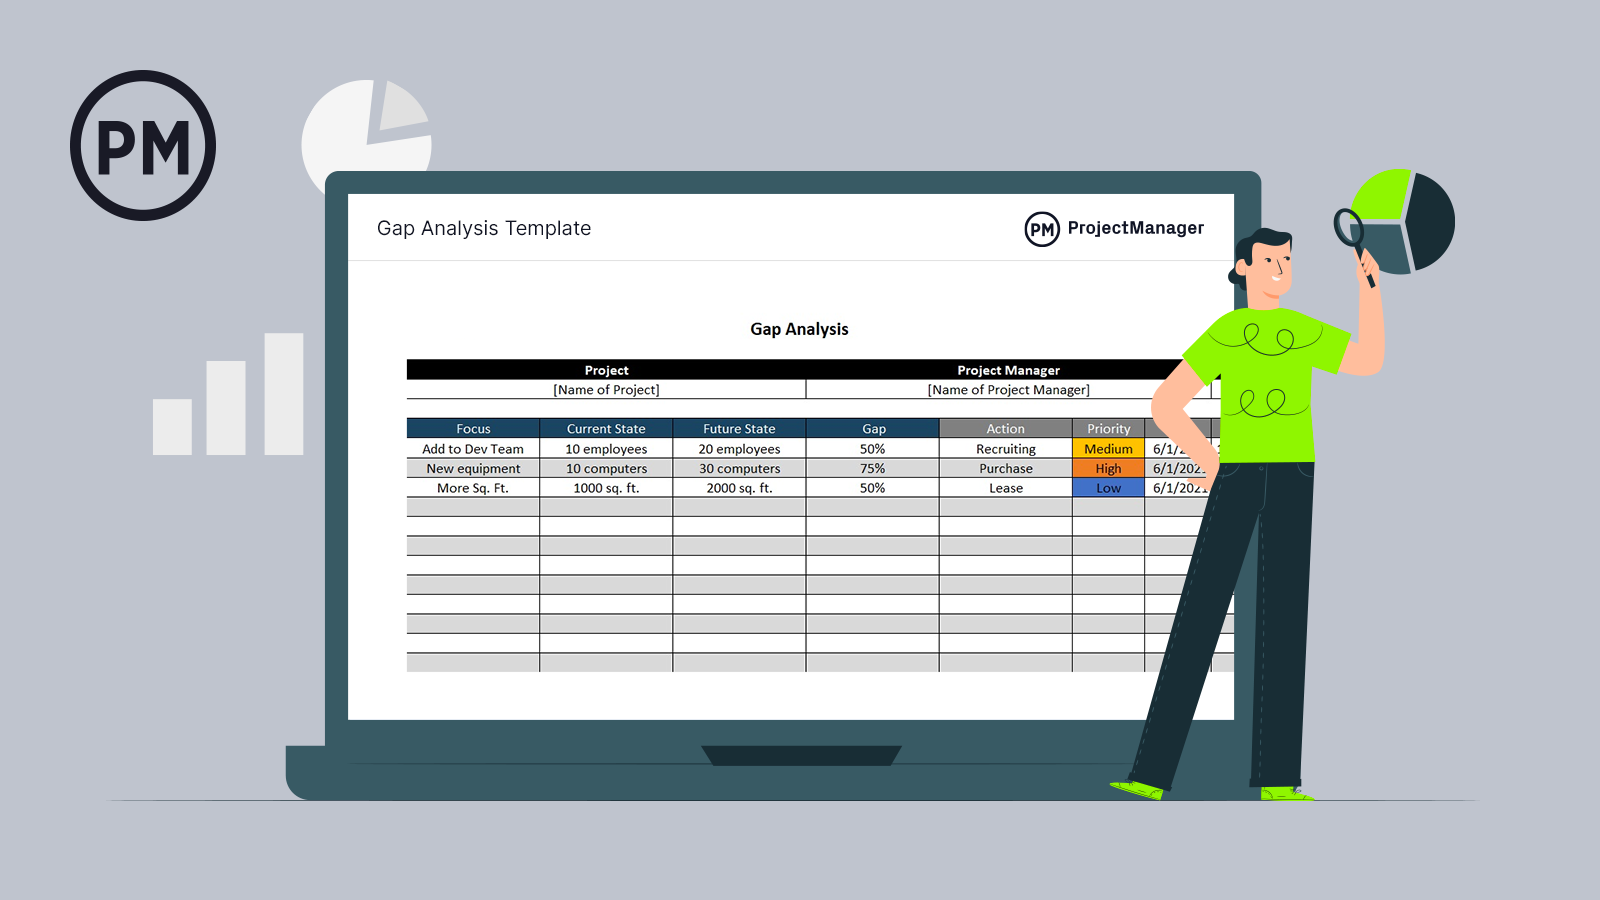
Understanding theory is valuable, but real‑world deployment reveals the true power—and the hidden challenges—of a Safety Gap Analysis Template Excel. Below are three distinct scenarios that illustrate how organizations of varying size and complexity have turned a simple spreadsheet into a strategic safety engine.
Manufacturing Plant Turnaround
A mid‑size automotive parts manufacturer faced a surge in recordable injuries. Their existing safety program was a collection of paper checklists scattered across shifts. By consolidating all hazards into a centralized Excel template, they identified 27 high‑risk gaps, most of which stemmed from outdated machine guarding. The risk scoring highlighted the top 5 critical items, prompting immediate engineering interventions. Within six months, the plant reduced its total recordable incident rate (TRIR) by 38% and passed an unannounced ISO 45001 audit without major findings.
Construction Contractor Compliance Sprint
A regional construction firm needed to demonstrate compliance to a new state safety ordinance within 90 days. The contractor leveraged an Excel template pre‑populated with the ordinance’s 12 compliance clauses. By assigning each site supervisor a subset of hazards and linking them to the clause matrix, the firm achieved 100% gap identification and remediation in the allotted window. The visual dashboard provided the corporate safety director with a real‑time snapshot that satisfied regulators and secured future contract bids.
Remote Energy Facility Risk Management
An offshore wind farm operator manages assets spread across hundreds of miles of ocean. Physical audits are costly and infrequent, so the operator uses a cloud‑linked Excel workbook to capture hazard data from field technicians via mobile devices. The risk scoring algorithm automatically flags any hazard with a residual risk above a defined threshold, triggering an instant alert to the central EHS team. This proactive approach prevented a potential turbine fire, saving millions in equipment loss and reinforcing the operator’s reputation for safety excellence.
Tips for Maintaining and Updating the Template
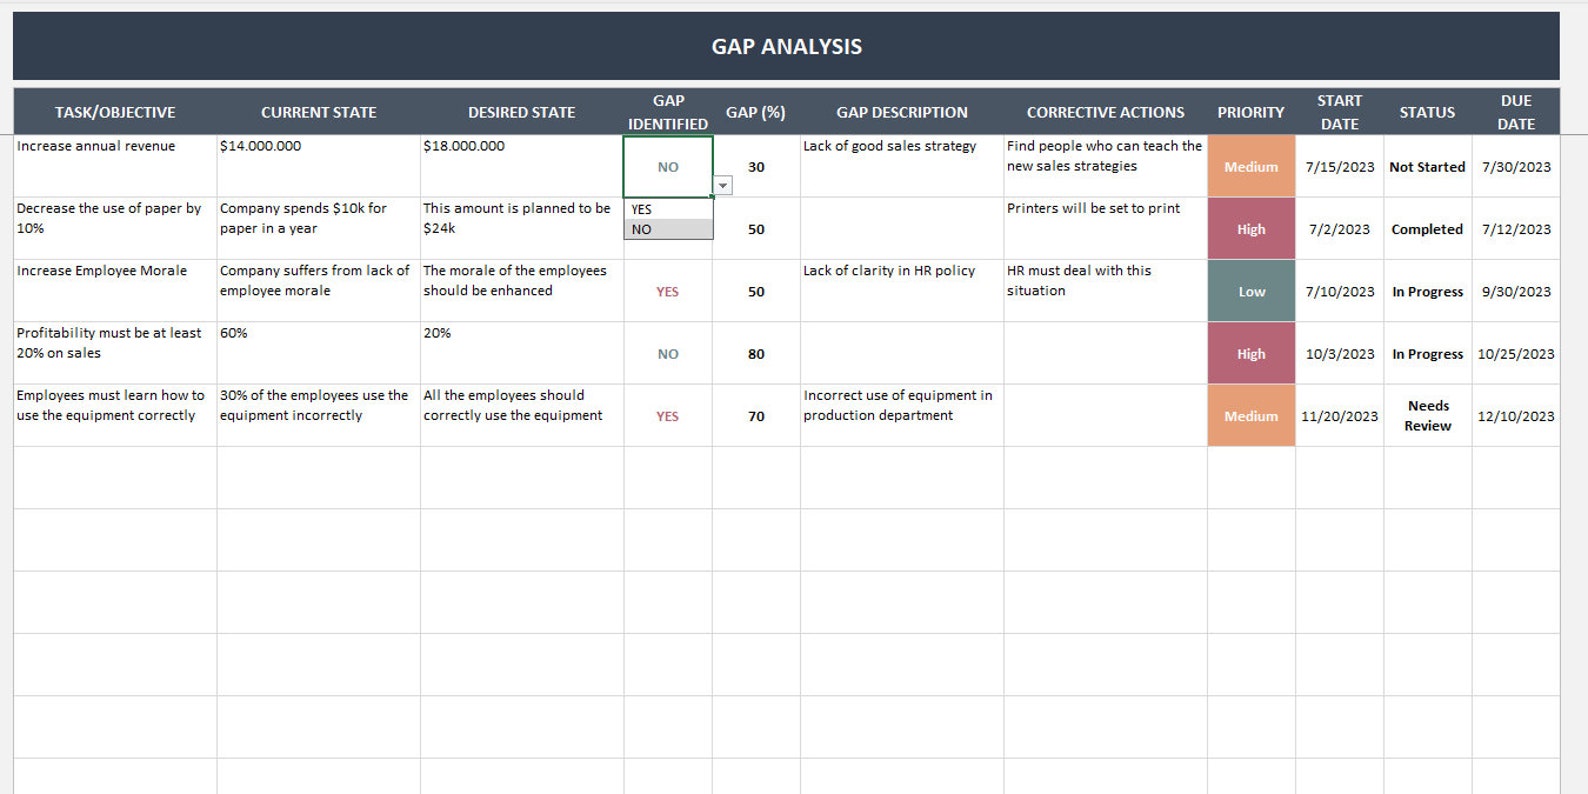
A spreadsheet is only as good as the data it holds. To keep your Safety Gap Analysis Template Excel relevant and reliable, adopt these disciplined maintenance practices.
Schedule Regular Reviews
Set a recurring calendar event—monthly for high‑risk environments, quarterly for lower‑risk operations—to review the hazard register. During each session, verify that owners have updated status fields, attach fresh evidence, and recalculate residual risks.
Automate Data Imports
Where possible, link the template to other data sources (e.g., incident management systems, equipment maintenance logs) using Power Query or external data connections. Automation reduces manual entry errors and ensures that the risk scores reflect the most current reality.
Version Control and Change Log
Maintain a “Version History” sheet that records every major edit: date, author, description of changes, and a snapshot of the previous version. This audit trail is invaluable during external assessments and protects against inadvertent data loss.
Training and Ownership
Invest in short, focused training sessions for all users. Emphasize the importance of accurate data entry, the meaning behind each risk score, and the consequences of neglect. When owners understand that their inputs directly influence corporate safety performance, compliance becomes a shared mission rather than a bureaucratic chore.
Continuous Improvement Loop
Use the insights gained from the dashboard to feed back into the risk assessment methodology. If certain hazard categories consistently show high residual risk, consider revising the underlying control hierarchy or allocating additional resources. This loop transforms the template from a static record into a dynamic improvement engine.
Conclusion
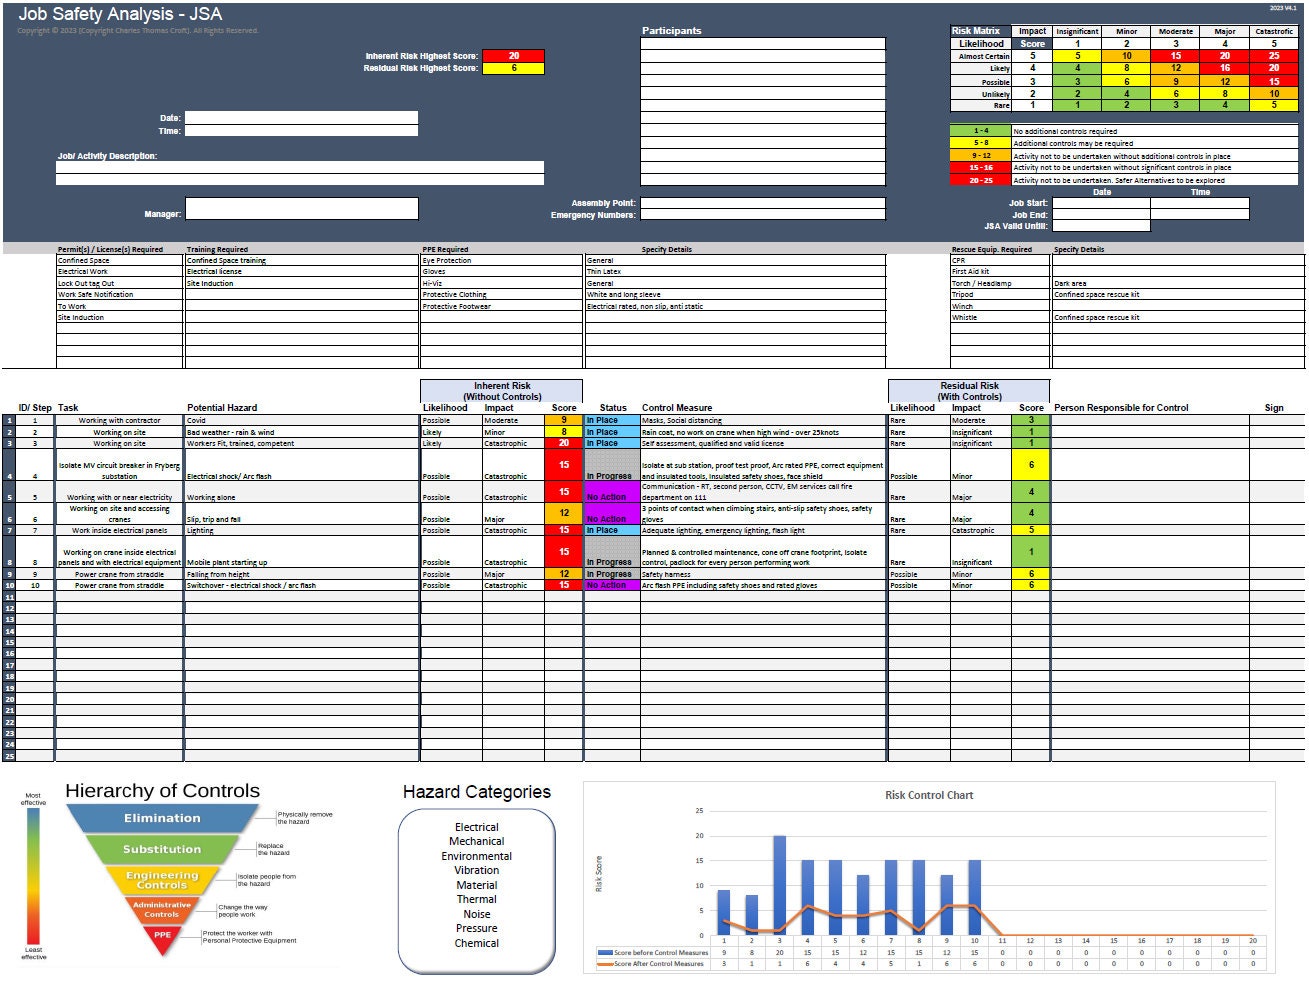
The Safety Gap Analysis Template Excel is not a mere list; it is a strategic instrument that converts vague safety concerns into quantifiable, actionable intelligence. By embedding risk scoring, compliance mapping, and remediation tracking within a single, visual dashboard, organizations can illuminate hidden dangers, prioritize corrective actions, and demonstrate unwavering commitment to occupational health and safety standards. Whether you are a manufacturing plant seeking to lower injury rates, a contractor racing against regulatory deadlines, or an offshore operator managing remote assets, the disciplined use of this Excel‑based tool provides the clarity and control needed to protect people, preserve assets, and uphold reputation. Keep the template current, involve the right stakeholders, and let the data drive your safety culture—because in the unforgiving world of risk, ignorance is the most expensive option.