
Training Report Template Format is the cornerstone of turning raw learning data into actionable insights, and it all begins with a well‑crafted document that captures every nuance of your training initiatives. Whether you’re a HR professional, a learning & development specialist, or a manager overseeing skill‑building programs, the right template not only streamlines reporting but also elevates the strategic impact of your training investments. In this guide we’ll unpack the essential elements, design principles, and practical steps needed to create a training report template that drives clarity, accountability, and continuous improvement.
Why a Structured Training Report Matters
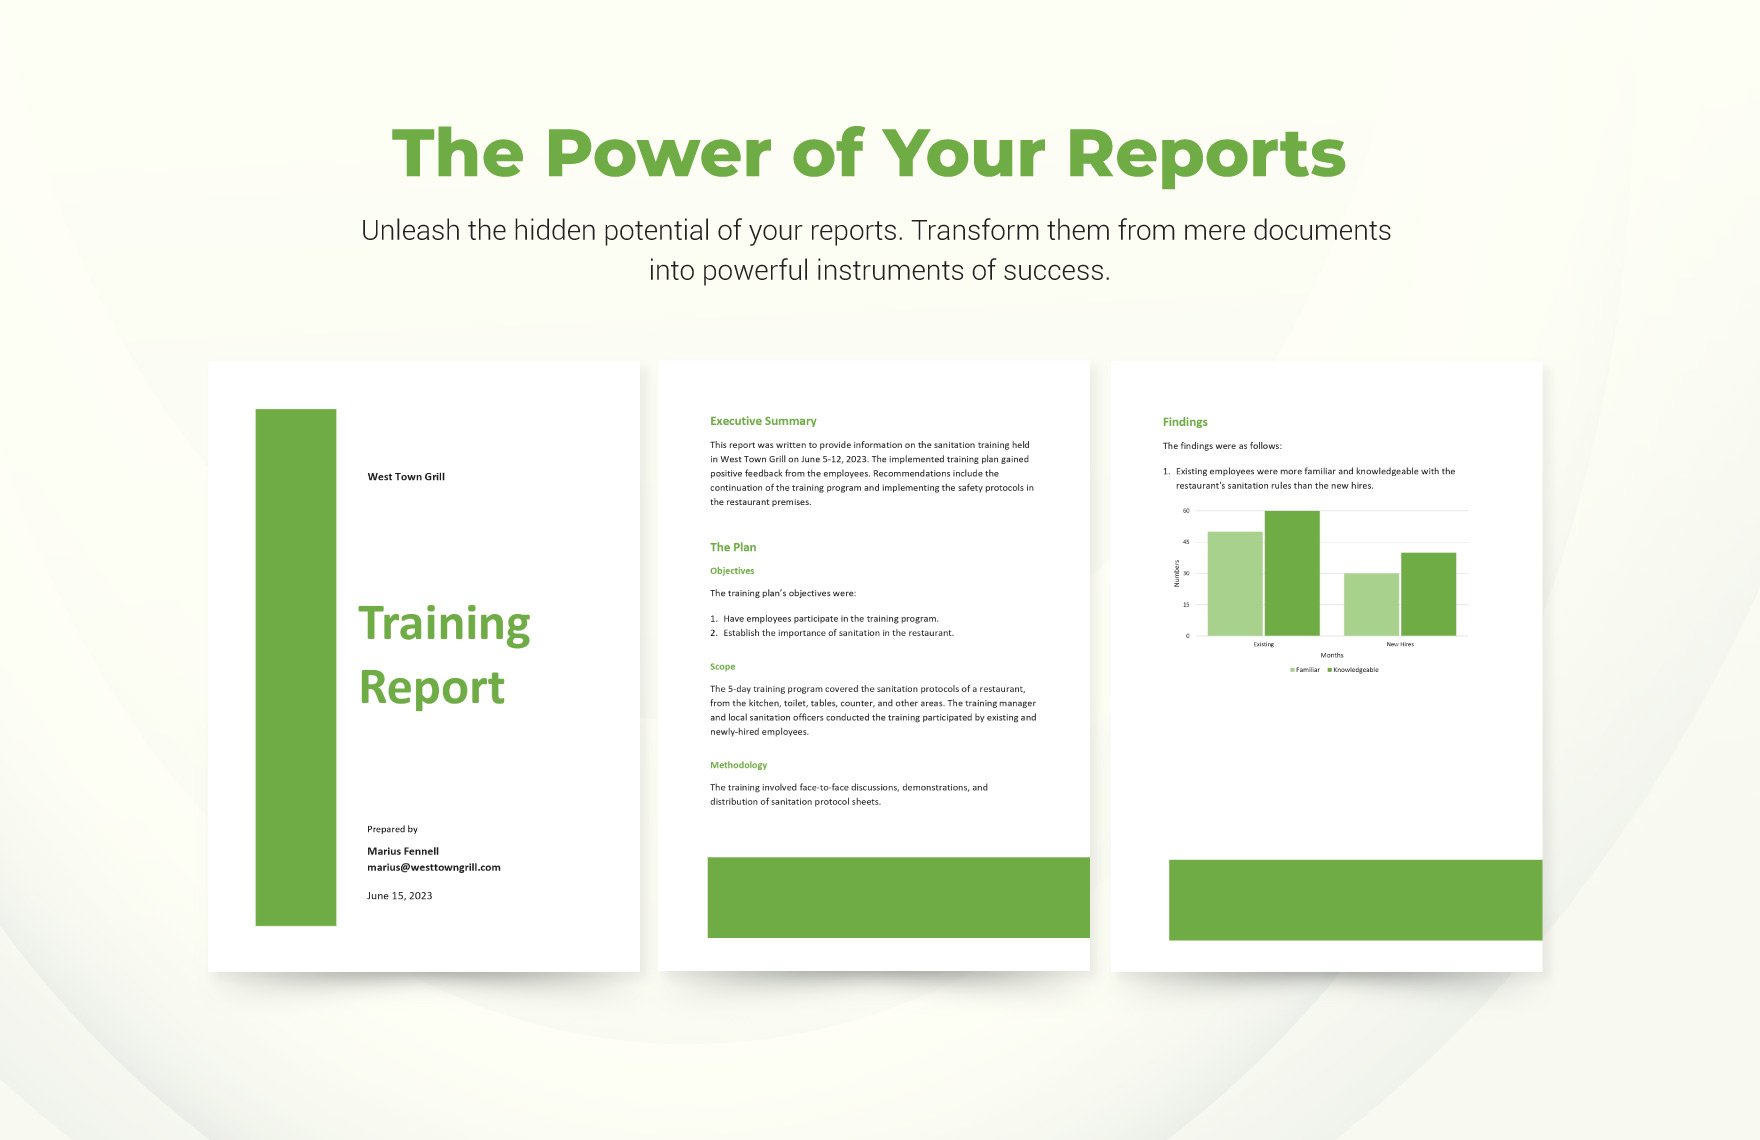
Aligns Training with Business Goals
A disciplined report format links each learning activity directly to organizational objectives such as increased productivity, reduced error rates, or higher employee engagement. By mapping outcomes to key performance indicators (KPIs), stakeholders can see the ROI of training at a glance, making it easier to justify budgets and prioritize future programs.
Facilitates Data‑Driven Decision Making
When data is captured consistently, you can compare cohorts, track progress over time, and identify gaps that demand immediate attention. A uniform template eliminates guesswork and provides a reliable foundation for analytics, predictive modeling, and strategic planning.
Enhances Transparency and Accountability
Clear sections for trainer feedback, participant evaluations, and follow‑up actions create a paper trail that holds both facilitators and learners accountable. Transparent reporting builds trust among senior leadership, fosters a culture of continuous learning, and encourages participants to take ownership of their development.
Core Components of an Effective Training Report Template

Header Information
Start with a concise header that includes the training title, date(s), location (or virtual platform), trainer name(s), and the target audience. Adding a unique report ID or version number helps with document control and historical reference.
Objectives and Expected Outcomes
List the specific learning objectives using action‑oriented verbs (e.g., “apply”, “analyze”, “demonstrate”). Pair each objective with measurable success criteria, such as “90% of participants achieve a passing score on the post‑test” or “reduce average handling time by 15% within 30 days.”
Participant Details
Include a table or summary that captures the number of attendees, their departments, job titles, and any pre‑assessment scores. This data provides context for evaluating the relevance of the training and spotting trends across functional groups.
Curriculum Overview
Break down the agenda into modules, topics, or activities. For each segment, note the duration, delivery method (lecture, workshop, e‑learning), and any instructional materials used. This level of granularity supports post‑training analysis of what content resonated most.
Assessment Results
Present quantitative results from quizzes, simulations, or practical exams. Use visual aids such as bar charts or heat maps (if the template supports them) to highlight average scores, pass rates, and variance across participant groups.
Feedback and Evaluation
Capture qualitative feedback through Likert‑scale ratings and open‑ended comments. Summarize key themes, such as “content relevance,” “trainer effectiveness,” and “logistics.” Including a net promoter score (NPS) can quickly convey overall satisfaction.
Action Items and Follow‑Up
Document agreed‑upon next steps, responsible owners, and target completion dates. Whether it’s scheduling a refresher session, assigning a mentor, or updating SOPs, clearly defined actions ensure the training’s impact endures beyond the classroom.
Financial Summary
Provide a cost breakdown that includes trainer fees, venue expenses, technology licenses, and participant time cost. Pair this with the measured outcomes to calculate a basic ROI figure or cost‑benefit ratio.
Designing the Layout for Maximum Clarity
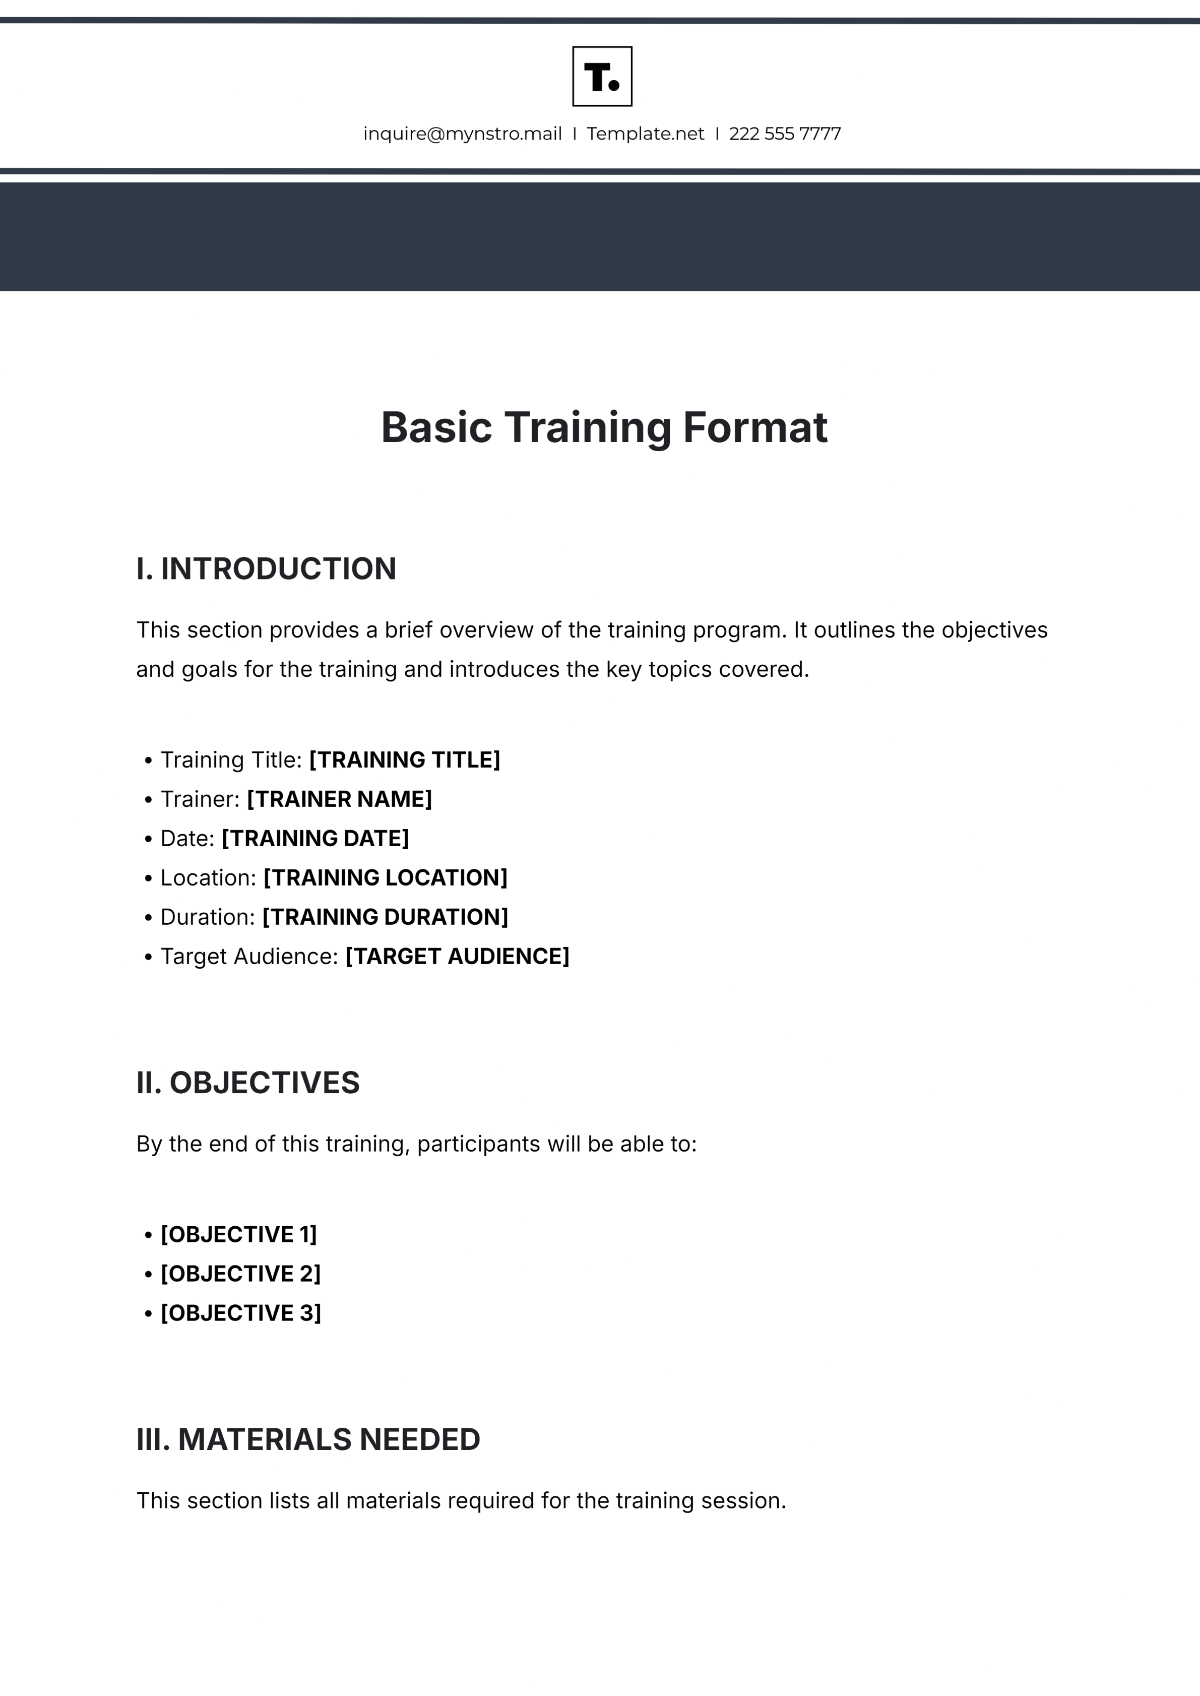
Use Consistent Styling
Apply a uniform font family, size, and color palette throughout the template. Headings should stand out with bold or larger text, while body content remains easy to read. Consistency reduces cognitive load and speeds up data entry.
Leverage Tables and Grids
Tables are ideal for organizing participant lists, assessment scores, and financial data. Use alternating row shading to improve readability, and lock column widths so that the template remains tidy when printed or exported as PDF.
Integrate Visual Elements
Charts, icons, and conditional formatting (e.g., red for scores below threshold) transform raw numbers into instantly understandable insights. Even simple sparkline graphs can highlight trends without cluttering the page.
Include Dynamic Fields
When building the template in Google Sheets or Excel, incorporate drop‑down menus for status fields (e.g., “Completed,” “In Progress”), auto‑calculations for totals, and formulas that flag out‑of‑range values. Automation reduces manual errors and saves time.
Make It Printable and Shareable
Design the layout to fit on standard A4 or Letter pages, with clear page breaks and printable headers/footers. Ensure the file format (XLSX, Google Sheet, or PDF) can be easily shared with stakeholders who may not have editing privileges.
Step‑by‑Step Guide to Building Your Template
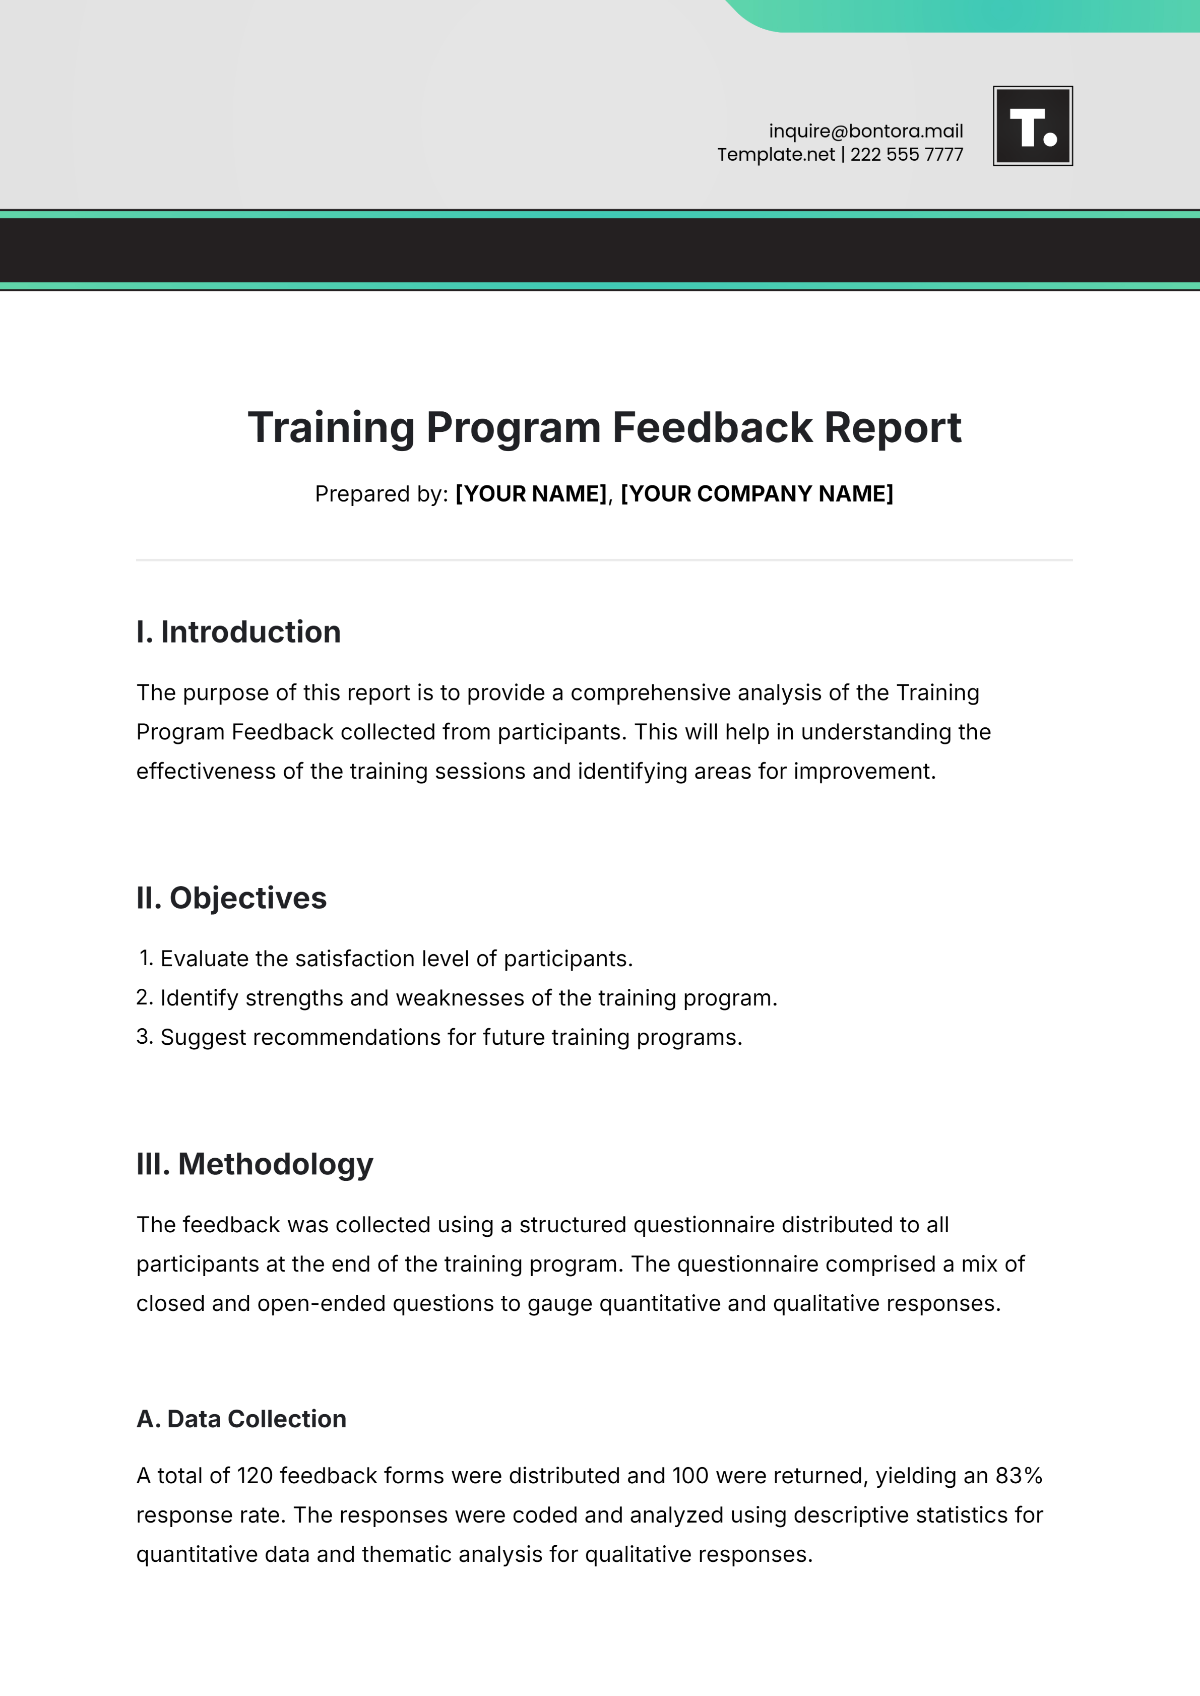
Step 1: Define the Scope
Start by answering three questions: What types of training will you report on (technical, soft skills, compliance)? Who are the primary readers (executives, line managers, auditors)? What key metrics matter most to your organization? Document these answers to set the boundaries of your template.
Step 2: Sketch a Wireframe
On a blank sheet of paper or a digital whiteboard, sketch the major sections identified in the core components. Place the header at the top, followed by objectives, participant details, curriculum, assessments, feedback, actions, and financials. This visual map guides the subsequent spreadsheet design.
Step 3: Create the Header Section
In your spreadsheet, reserve rows 1‑4 for the header. Use merged cells for the training title (bold, 18‑pt font) and separate cells for date, trainer, and location. Add a cell for “Report ID” that auto‑generates using a simple concatenation formula (e.g., =“TR-” & TEXT(TODAY(), “YYYYMMDD”)).
Step 4: Build the Participant Table
Insert a table starting at row 6 with columns for Employee ID, Name, Department, Role, Pre‑Score, Post‑Score, and Attendance. Apply data validation to ensure numeric entries for scores and a drop‑down for attendance (Present/Absent). Use a calculated column to compute score improvement (Post‑Score – Pre‑Score).
Step 5: Map the Curriculum
Allocate a section that lists each module, duration, delivery method, and resources. Use bullet points within a single cell or separate rows for each activity. Include a column for “Trainer Comments” where facilitators can note engagement levels or technical issues.
Step 6: Capture Assessment Results
Design a separate block for quizzes and practical exams. Use a matrix layout where rows represent participants and columns represent individual test items. Apply conditional formatting to highlight scores below the passing threshold in red, and above 90% in green.
Step 7: Integrate Feedback Forms
Create a mini‑survey area with Likert scales (1‑5) for categories like “Content Relevance,” “Instructor Clarity,” and “Overall Satisfaction.” Use data validation to restrict entries to numbers 1‑5. Add a free‑text column for comments and use a pivot table to aggregate average ratings.
Step 8: Summarize Action Items
Insert a table titled “Next Steps” with columns for Action Description, Owner, Due Date, and Status. Use a drop‑down for Status (Not Started, In Progress, Completed). Add a conditional format that turns the row orange when the due date is within three days and red when overdue.
Step 9: Calculate Financials
List cost items in a simple two‑column table: Description and Amount. Use a SUM formula at the bottom to compute total cost. Add a cell for “Estimated Benefit” (e.g., projected productivity gain) and a formula for ROI: =(Estimated Benefit – Total Cost) / Total Cost.
Step 10: Review, Test, and Lock
Run a mock data entry session to verify that formulas work, drop‑downs populate correctly, and visual cues appear as intended. Protect the sheet sections that contain formulas while leaving input cells editable. Finally, save a master copy and distribute a read‑only version for executive review.
Tips for Customizing and Automating
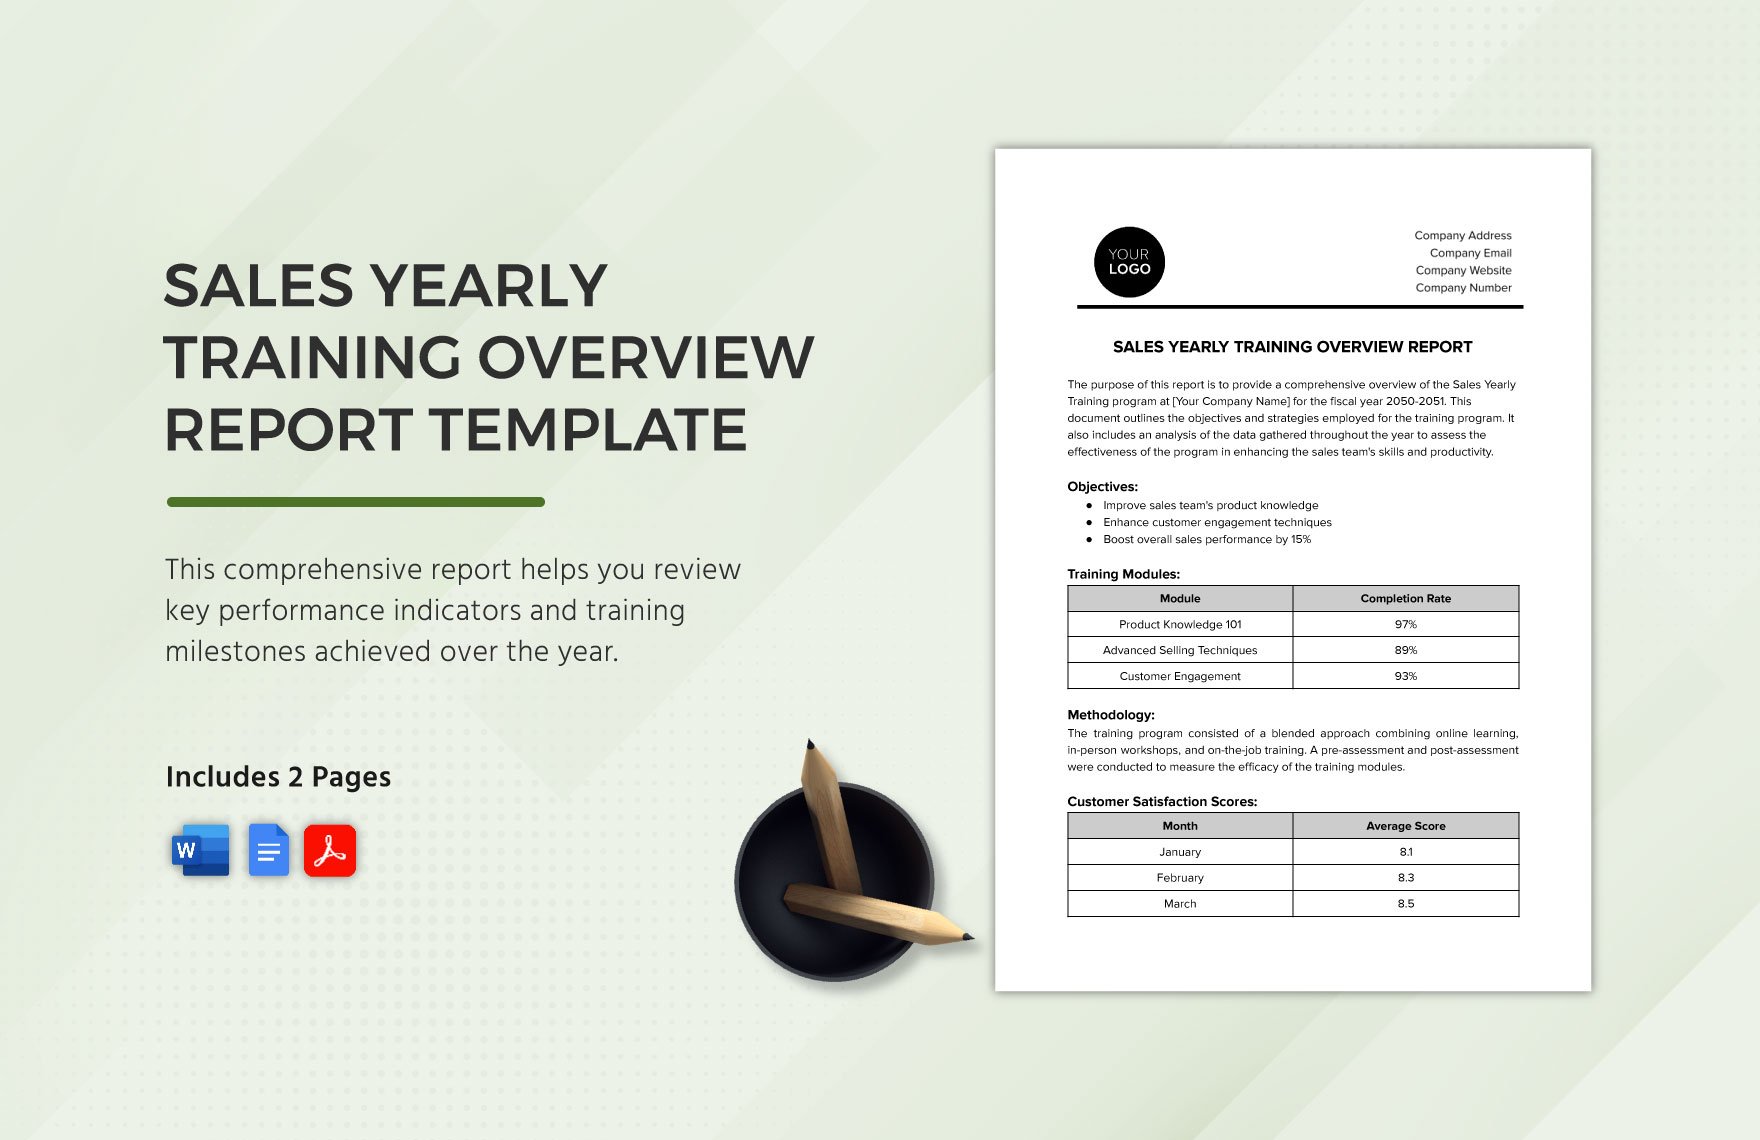
Leverage Templates Across Departments
Once you have a solid base, duplicate the sheet for each department and adjust only the relevant fields (e.g., specific KPIs or cost centers). This approach maintains consistency while respecting unique departmental needs.
Integrate with Learning Management Systems (LMS)
Many LMS platforms allow export of attendance and assessment data as CSV files. Set up an import routine that automatically populates the participant and assessment tables, saving hours of manual entry.
Use Conditional Alerts
Configure email notifications (via Google Apps Script or Excel VBA) that trigger when an action item’s status changes to “Overdue.” Automated alerts keep momentum and ensure follow‑up tasks are completed on time.
Apply Dynamic Dashboards
Build a separate “Dashboard” sheet that pulls key metrics from the report—average satisfaction score, total cost, ROI, and completion rates. Use sparklines and gauge charts for quick visual snapshots that can be presented in leadership meetings.
Version Control and Audit Trails
Maintain a changelog at the bottom of the template that records who edited which section and when. This practice is essential for compliance audits and demonstrates a disciplined approach to data governance.
Common Mistakes to Avoid

Overloading the Template with Unnecessary Fields
Too many columns or sections create confusion and increase the likelihood of missing data. Stick to the core components that directly support decision making; add optional annexes only when truly needed.
Neglecting Data Validation
Leaving cells open to free‑form text invites errors—misspelled department names, inconsistent date formats, or non‑numeric scores. Implement validation rules early and lock cells that should not be edited.
Skipping the Narrative Summary
Numbers speak loudly, but a concise executive summary that interprets the data adds essential context. Without it, readers may misinterpret trends or overlook critical insights.
Forgetting to Update the Template
Training practices evolve, and so should your reporting format. Schedule a quarterly review to incorporate new metrics, retire obsolete fields, and refine visual elements based on stakeholder feedback.
Using Inconsistent Terminology
Terms like “completion,” “attendance,” and “pass rate” must be defined and used consistently throughout the report. Inconsistent language can lead to misaligned expectations and inaccurate comparisons.
Real‑World Examples and Best Practices

Case Study: Manufacturing Safety Training
A mid‑size manufacturing firm adopted a streamlined training report template that emphasized incident‑prevention metrics. By linking post‑training safety quiz scores to actual on‑floor incident rates, the company demonstrated a 22% reduction in workplace accidents within six months, justifying a 15% increase in training budget.
Case Study: Sales Enablement Bootcamp
A technology firm rolled out a quarterly sales bootcamp and used a template that captured pipeline contribution, average deal size, and win‑rate changes post‑training. The resulting data showed a 12% uplift in win rates, enabling senior leadership to allocate resources toward high‑impact modules.
Best Practice: Keep It Mobile‑Friendly
Many managers review reports on tablets or smartphones. Design the template with a responsive layout—avoid overly wide tables, use wrap‑text for long comments, and ensure charts scale proportionally.
Best Practice: Align with Corporate Branding
Incorporate the company logo, brand colors, and standard fonts into the header and footer. A professional appearance reinforces the seriousness of the training program and encourages stakeholder engagement.
Conclusion

Crafting a robust Training Report Template Format is more than an administrative task; it’s a strategic initiative that transforms learning data into a catalyst for performance improvement. By adhering to the core components, applying clean design principles, and automating repetitive steps, you create a reporting engine that delivers clarity, accountability, and measurable ROI. Avoid common pitfalls such as over‑complication and inconsistent terminology, and continuously refine the template based on real‑world feedback. With a well‑structured template in place, every training session becomes a documented step toward organizational excellence, empowering leaders to make informed decisions and fostering a culture of continuous growth.







Related posts of "Training Report Template Format"
