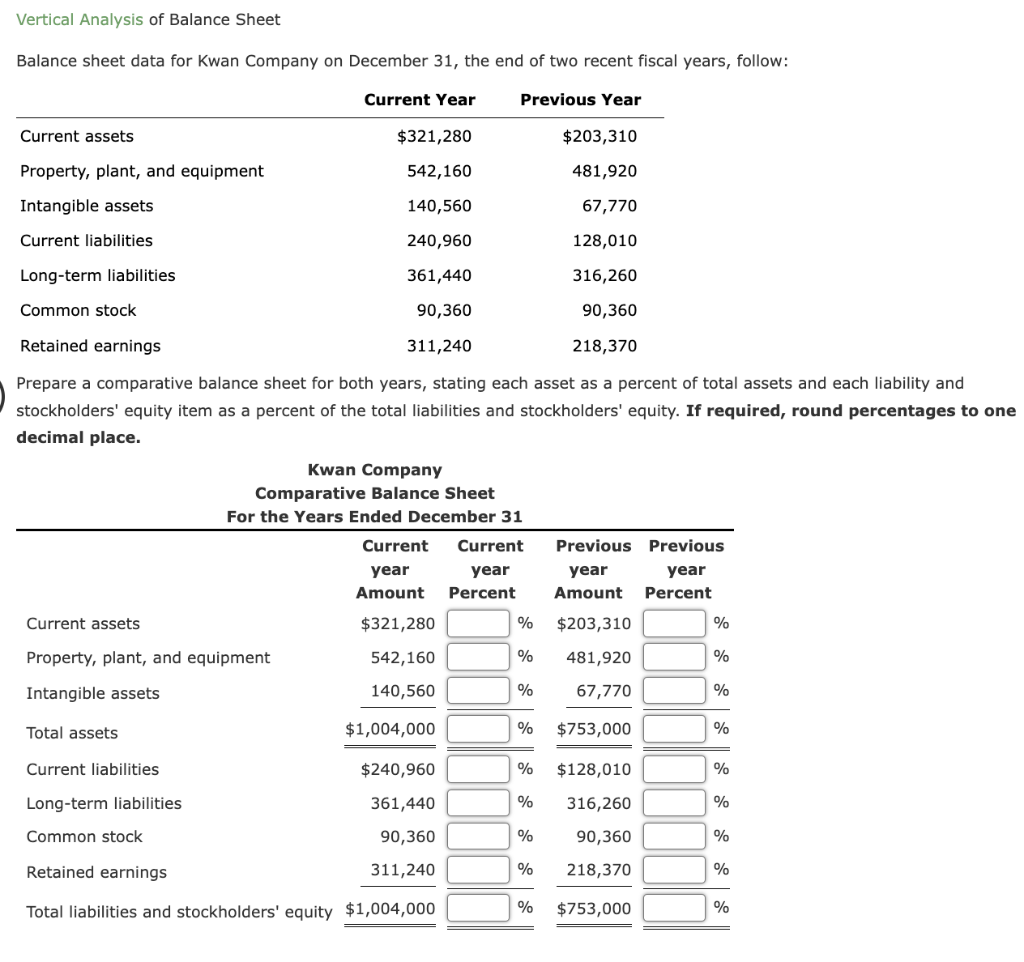
Vertical Analysis Balance Sheet Template is an indispensable tool for financial analysts and business leaders who wish to uncover underlying trends and assess the relative importance of each line item on a company’s balance sheet. By expressing every figure as a percentage of a chosen base—often total assets or total liabilities and equity—vertical analysis transforms raw numbers into a clear, comparable picture of a firm’s structure and health.
Understanding Vertical Analysis
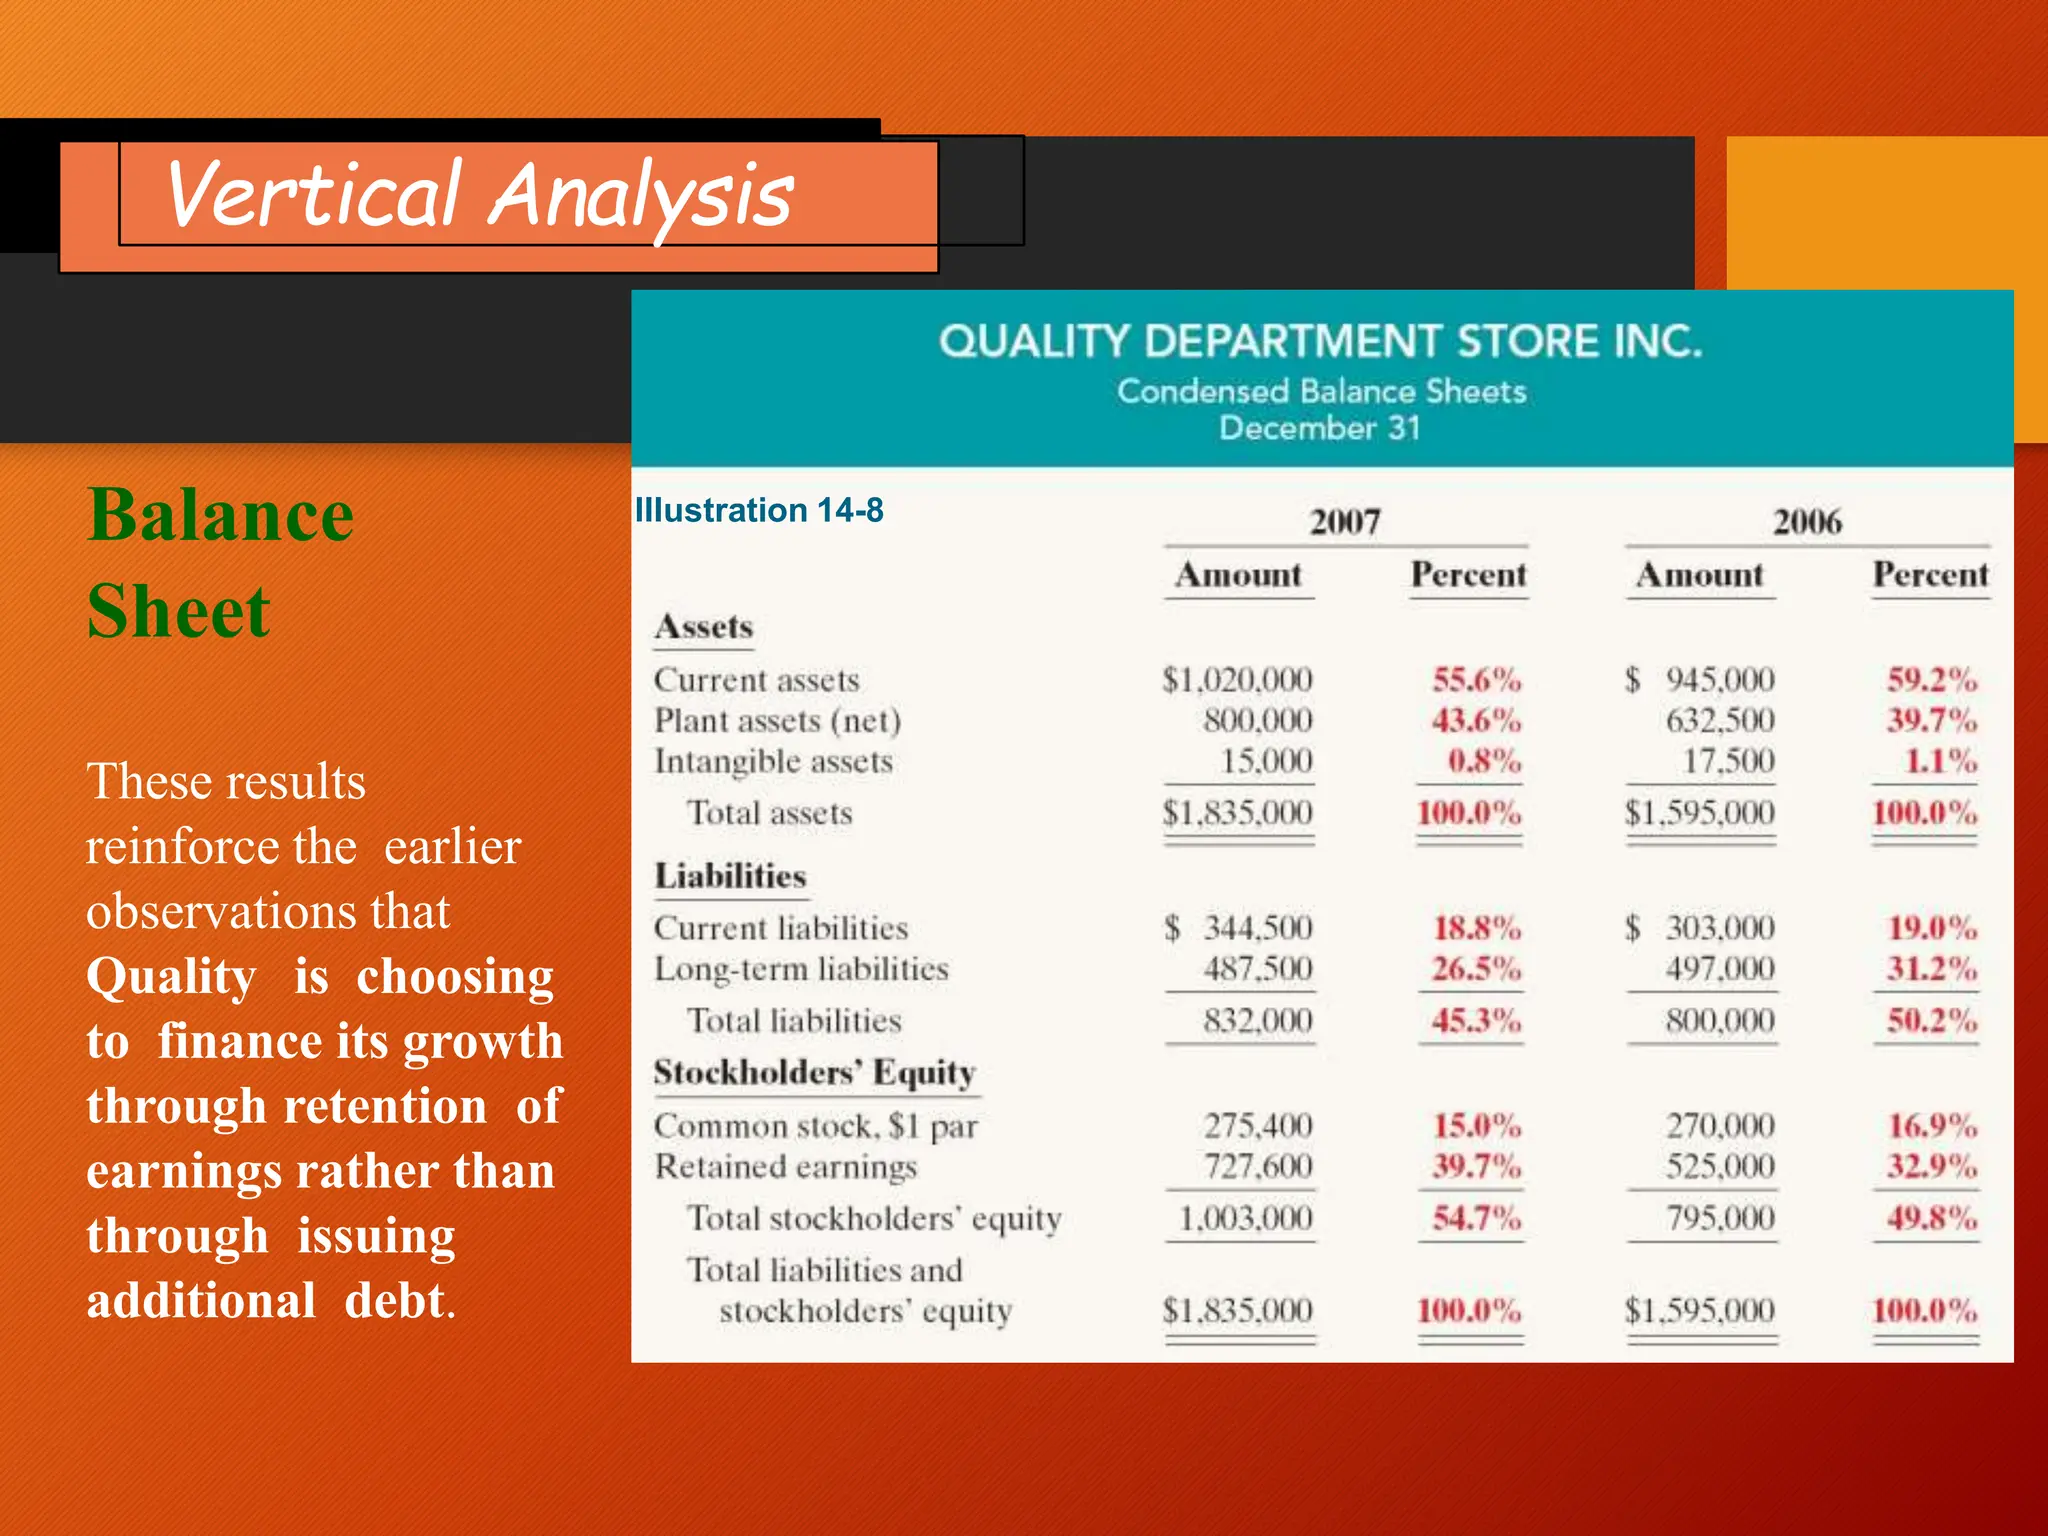
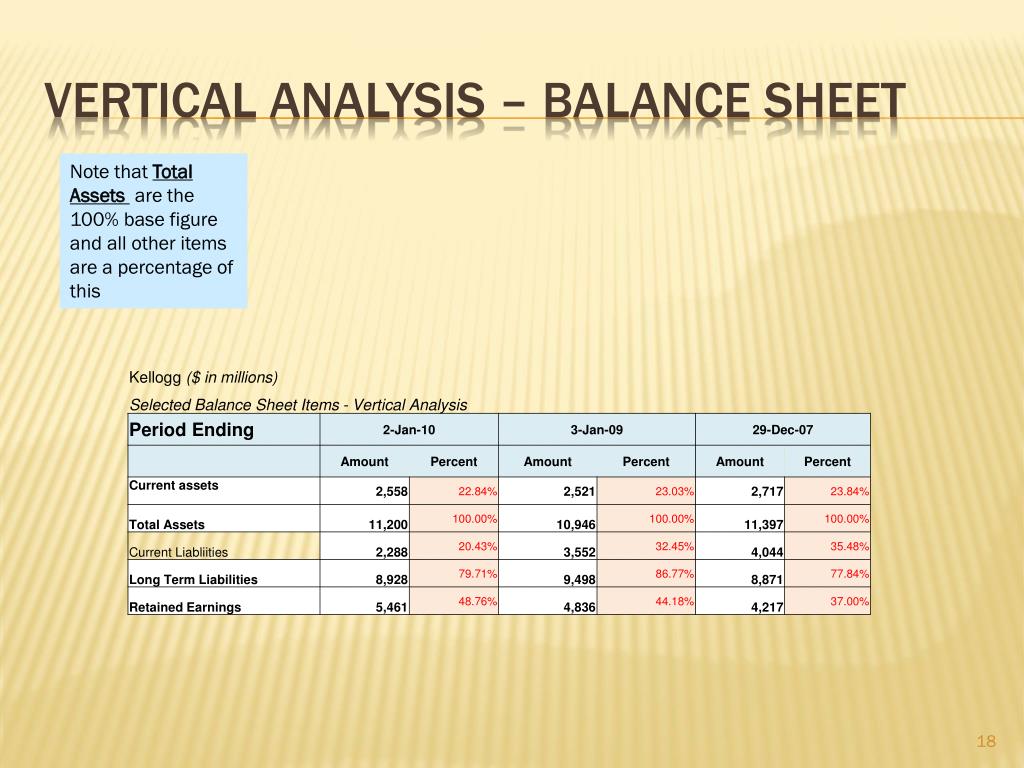
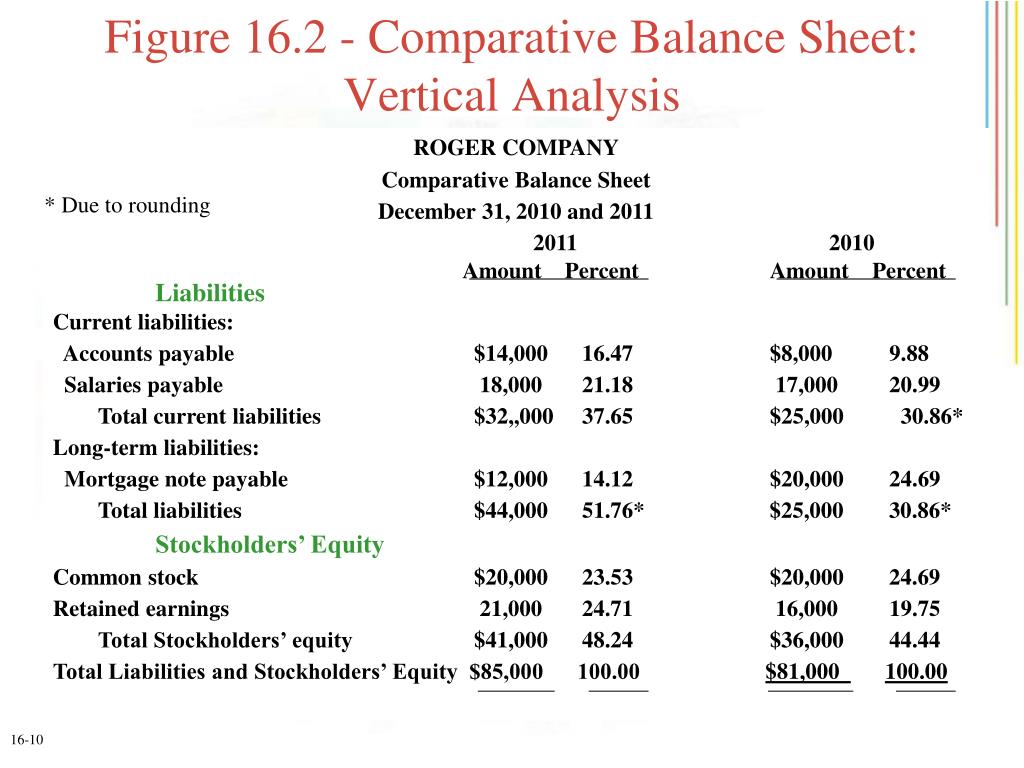
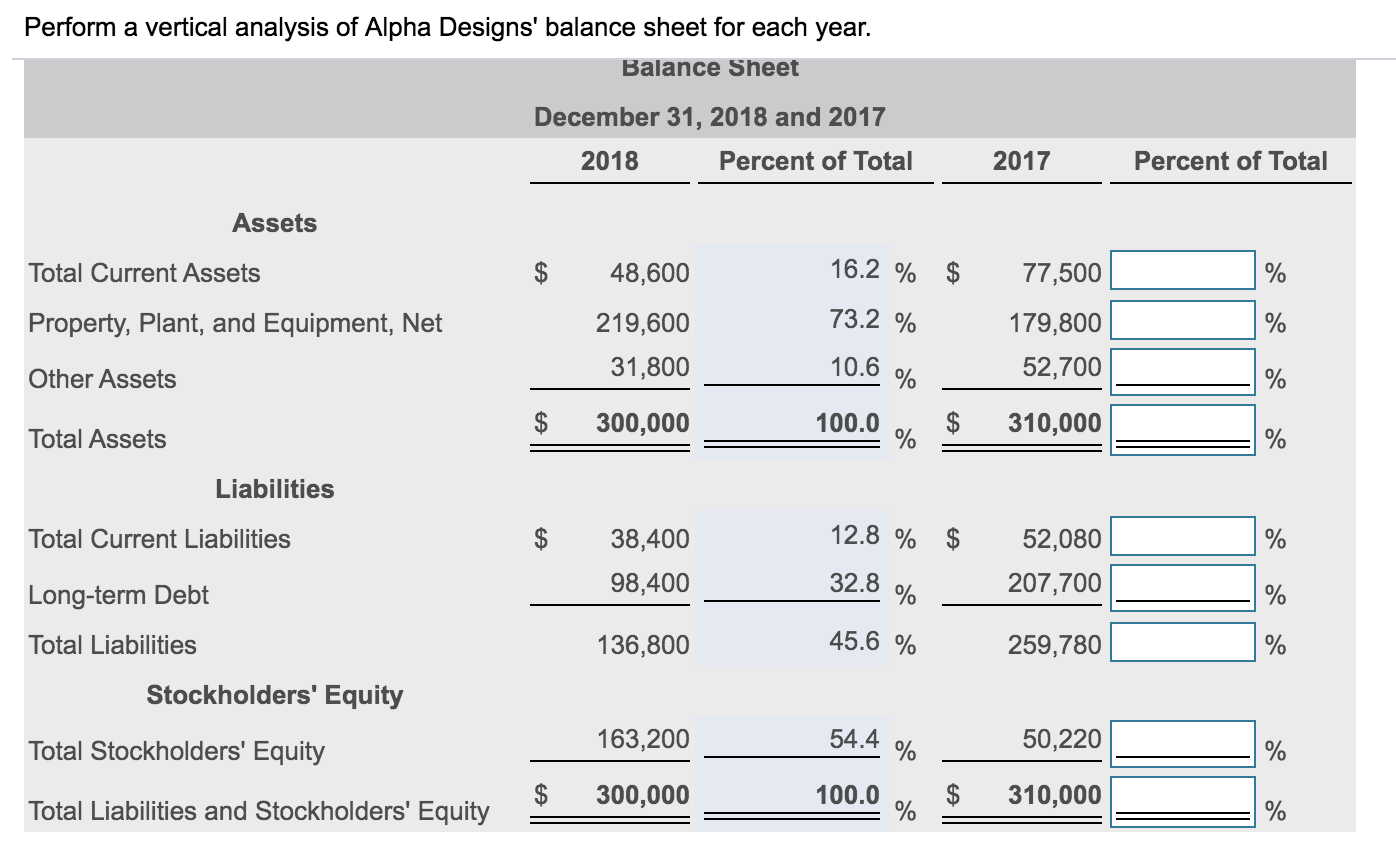
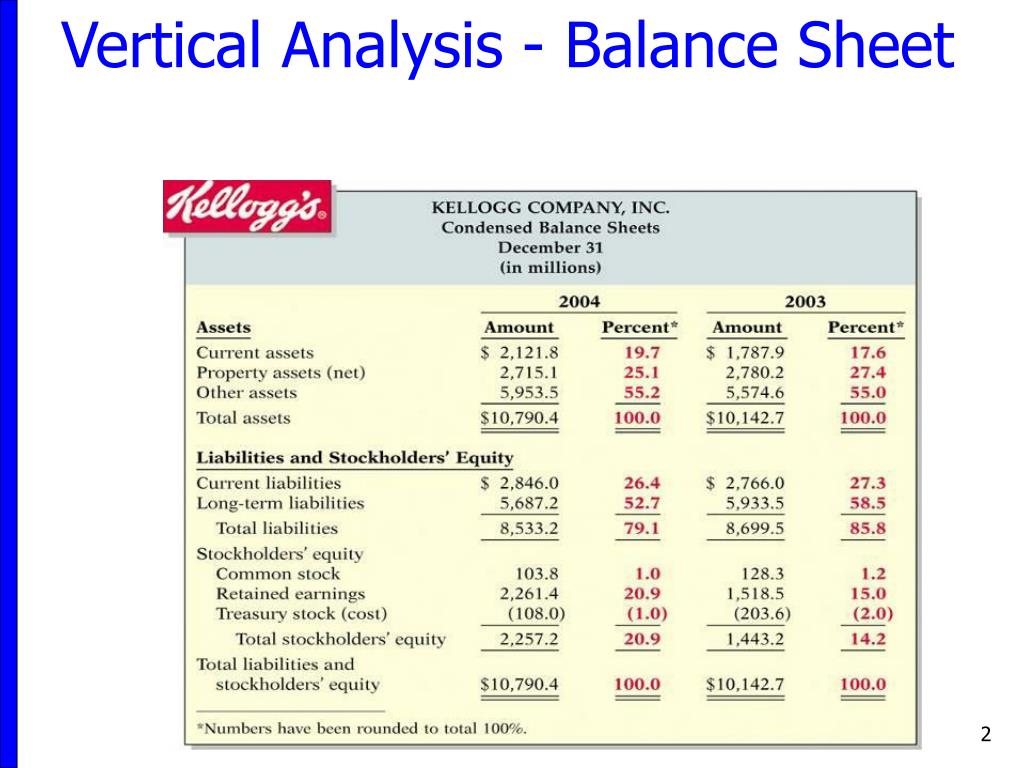
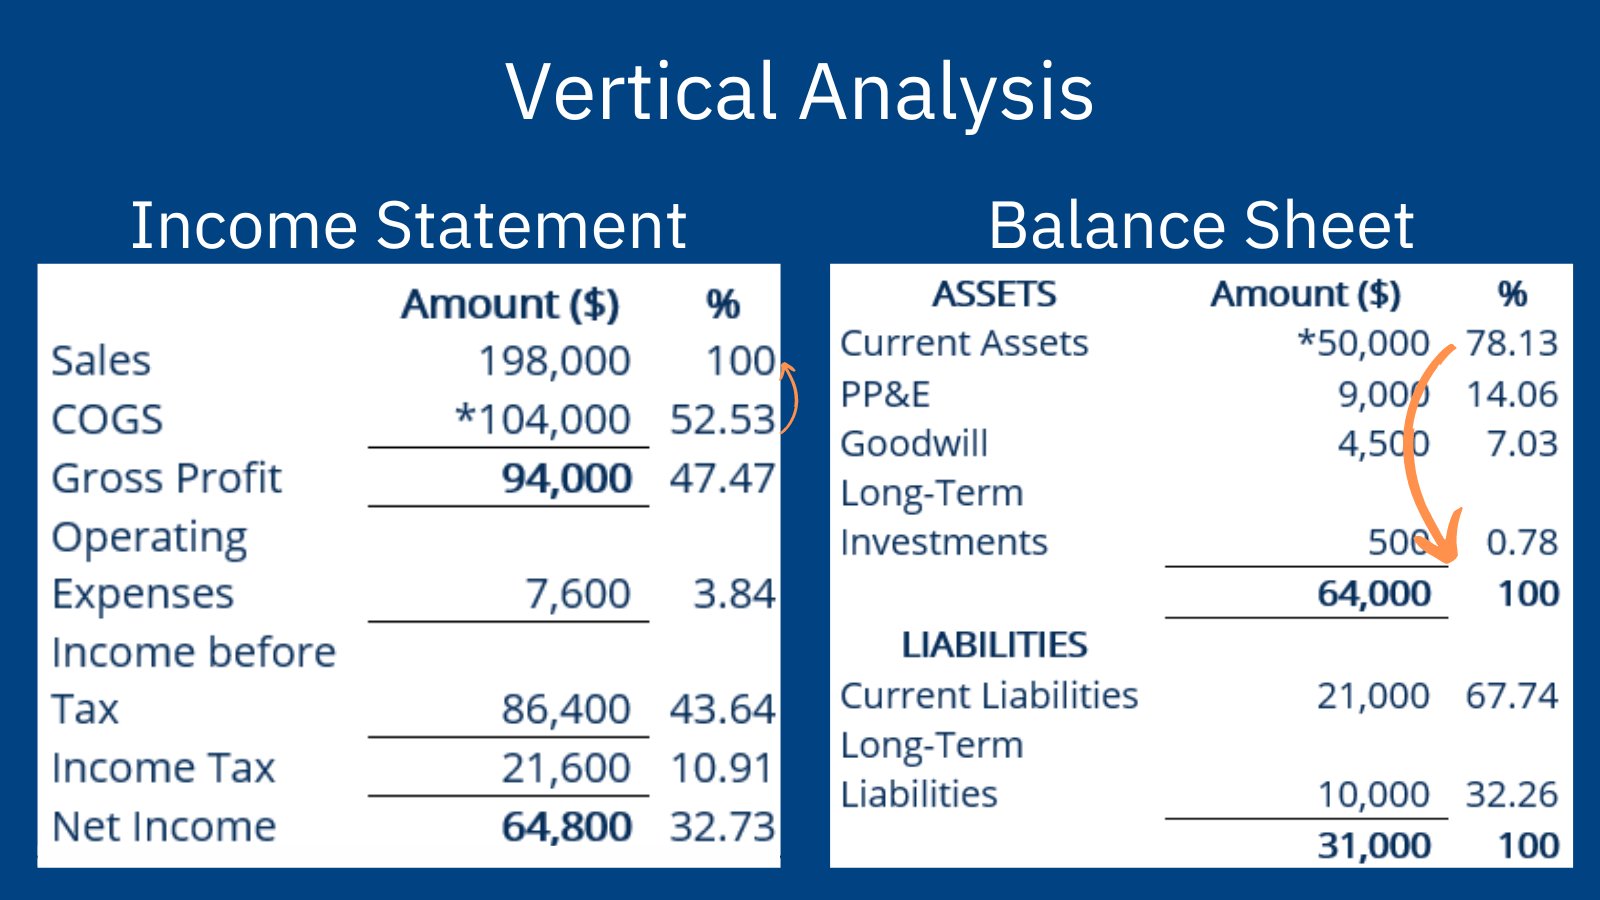
Vertical analysis, also known as common-size analysis, standardizes a balance sheet by converting each line item into a proportion of the selected base value. Unlike horizontal analysis, which examines changes over time, vertical analysis provides an immediate snapshot of the company’s composition at a single point in time. This technique is especially valuable for cross‑company comparisons, industry benchmarking, and trend spotting within a single firm’s financial statements.
Why Vertical Analysis Matters
- Standardization – Eliminates size bias, allowing small and large firms to be compared on equal footing.
- Insightful Ratios – Highlights the weight of assets, liabilities, and equity components, revealing capital structure and operational focus.
- Decision‑Making Support – Helps managers identify over‑ or under‑investment in particular asset classes or debt levels.
- Transparency for Stakeholders – Offers investors a quick visual of how a company allocates resources and finances its operations.
Key Components of a Vertical Balance Sheet Template

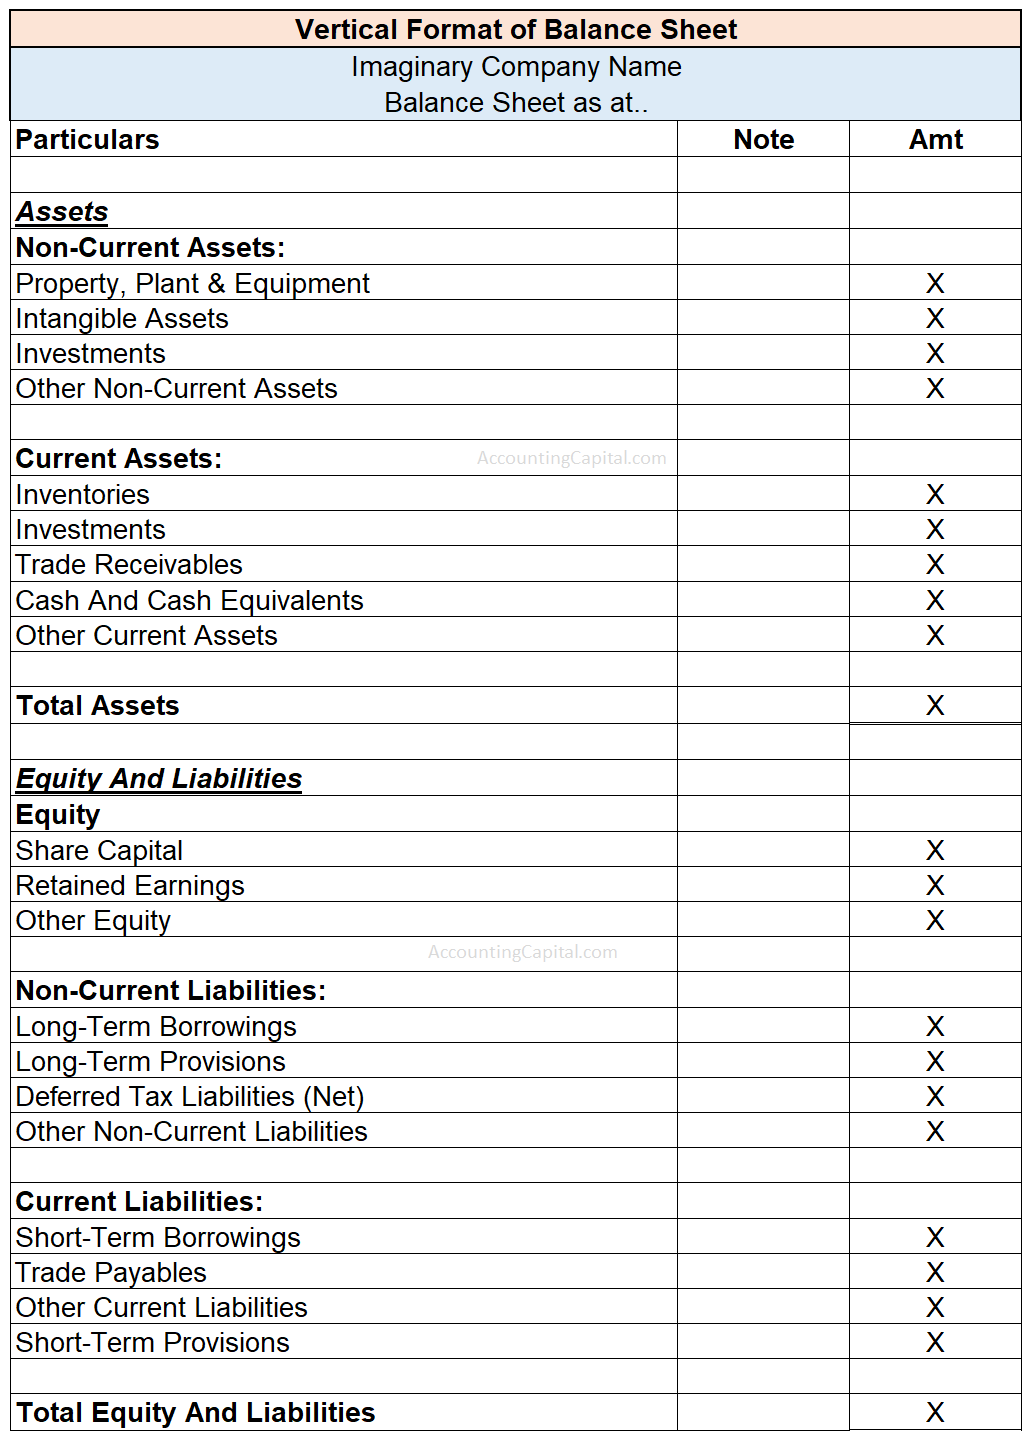
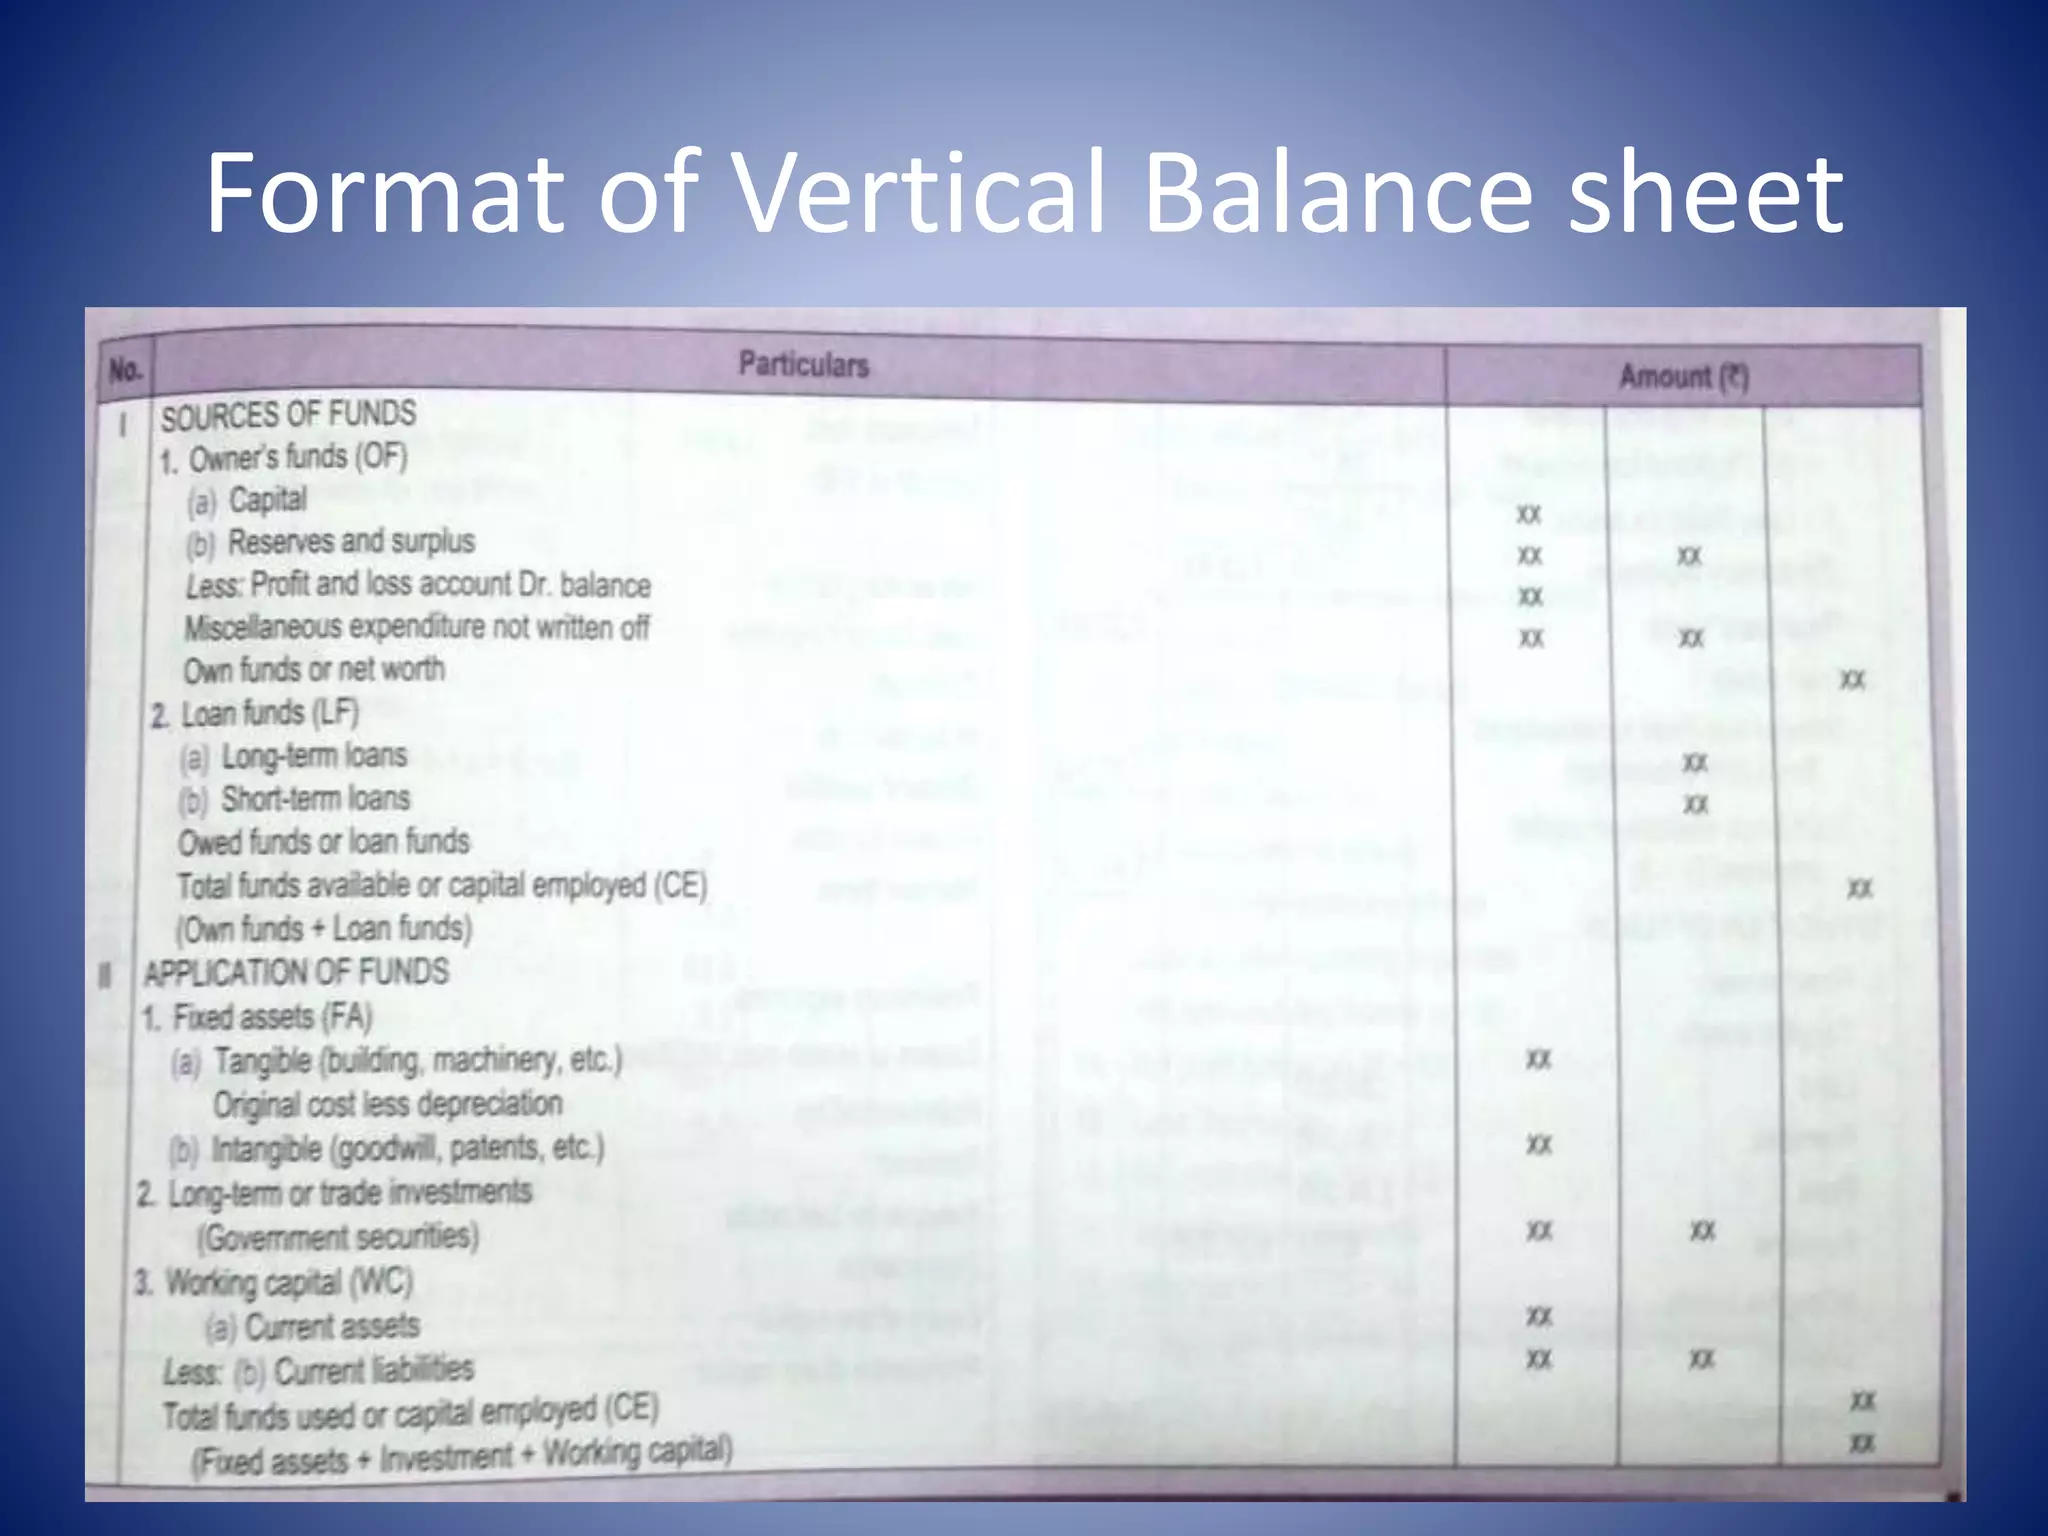
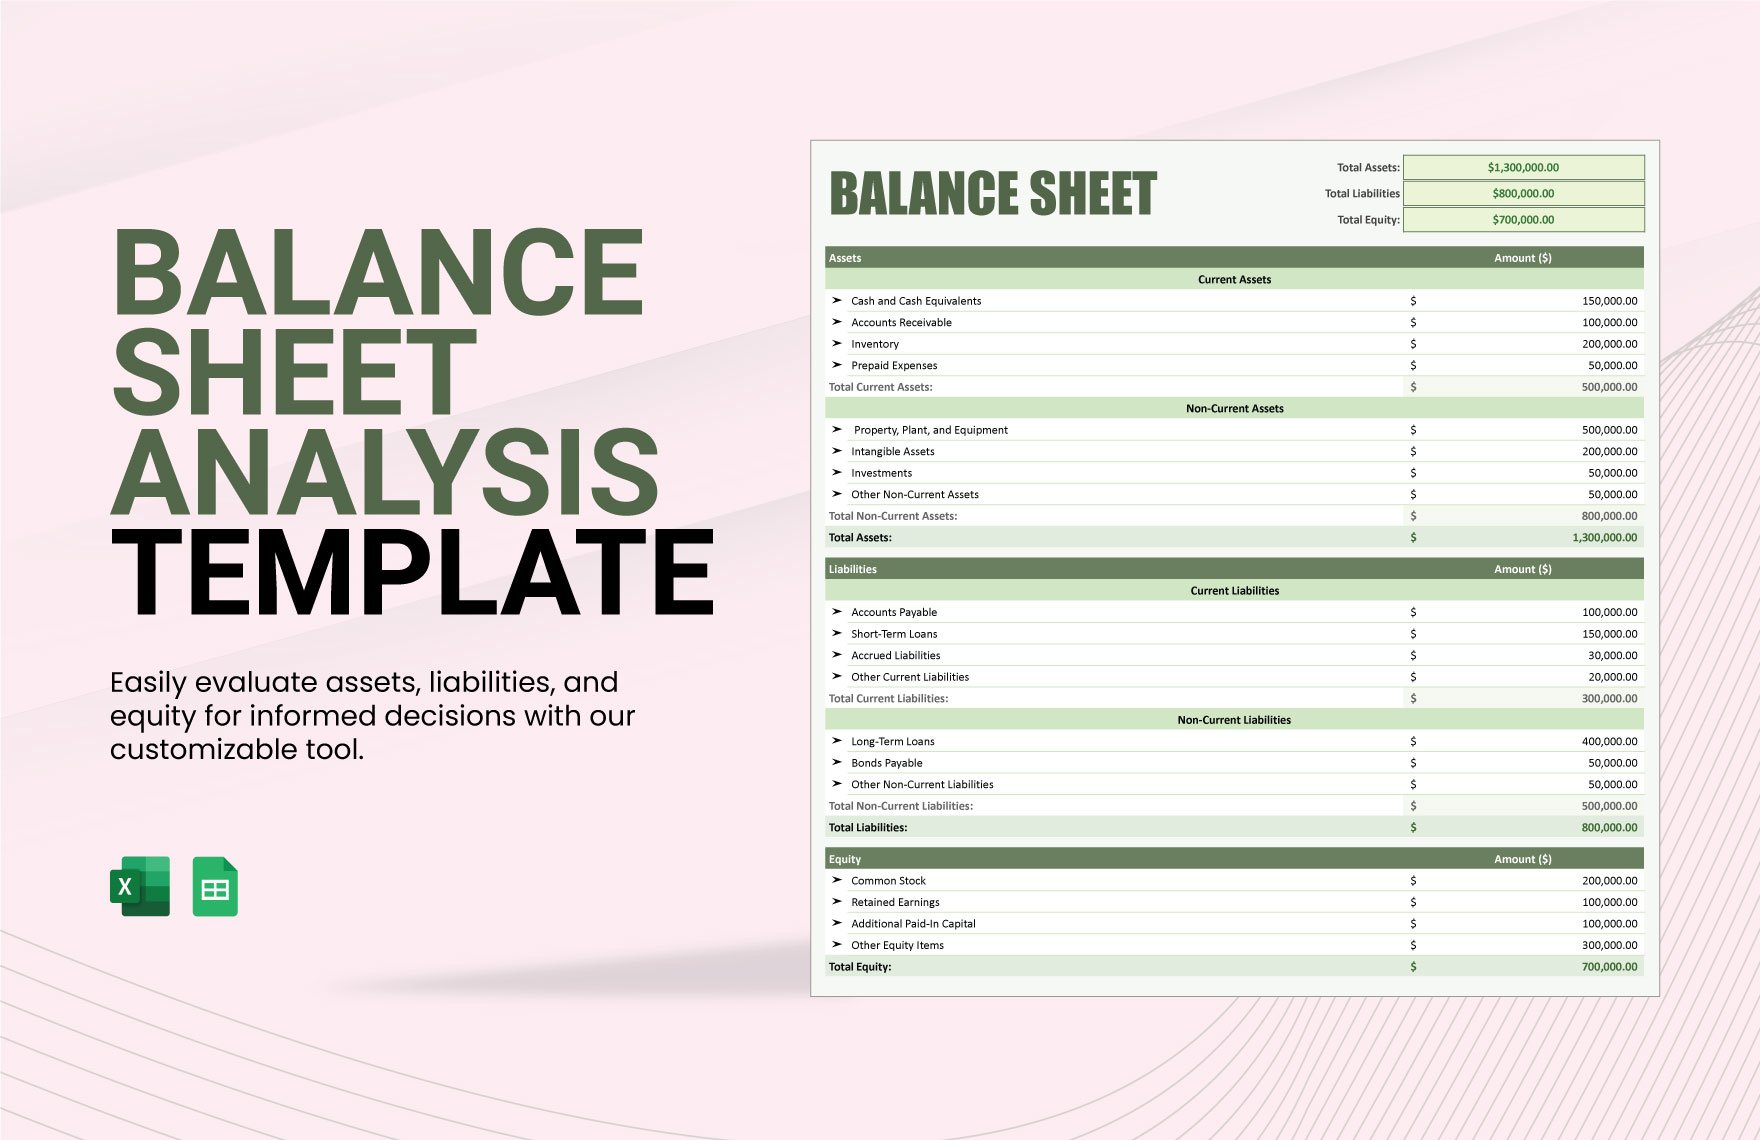
A well‑structured vertical balance sheet template must include every standard line item, properly categorized, and expressed as a percentage of total assets (or another chosen base). The main sections usually are:
Assets
- Current Assets
- Cash and Cash Equivalents
- Accounts Receivable
- Inventories
- Other Current Assets
- Non‑Current Assets
- Property, Plant & Equipment (net)
- Intangible Assets
- Long‑Term Investments
- Other Non‑Current Assets
Liabilities
- Current Liabilities
- Accounts Payable
- Short‑Term Debt
- Accrued Expenses
- Other Current Liabilities
- Non‑Current Liabilities
- Long‑Term Debt
- Deferred Tax Liabilities
- Other Non‑Current Liabilities
Equity
- Common Stock
- Retained Earnings
- Additional Paid‑In Capital
- Other Equity Items (e.g., Treasury Stock)
Step‑by‑Step Guide to Building a Vertical Balance Sheet

Creating a vertical balance sheet template is straightforward, yet attention to detail ensures accuracy and usability. Follow these steps to produce a professional, repeatable format.
1. Choose Your Base
The most common base is total assets, which guarantees that the percentages for assets sum to 100%. For liabilities and equity, total liabilities and equity must equal total assets; thus, the sum of liability and equity percentages also equals 100%.
2. Input Raw Figures
Populate the template with the latest audited balance sheet figures. Maintain consistency in currency and accounting period. Double‑check that the total of all line items equals the total assets figure.
3. Calculate Percentages
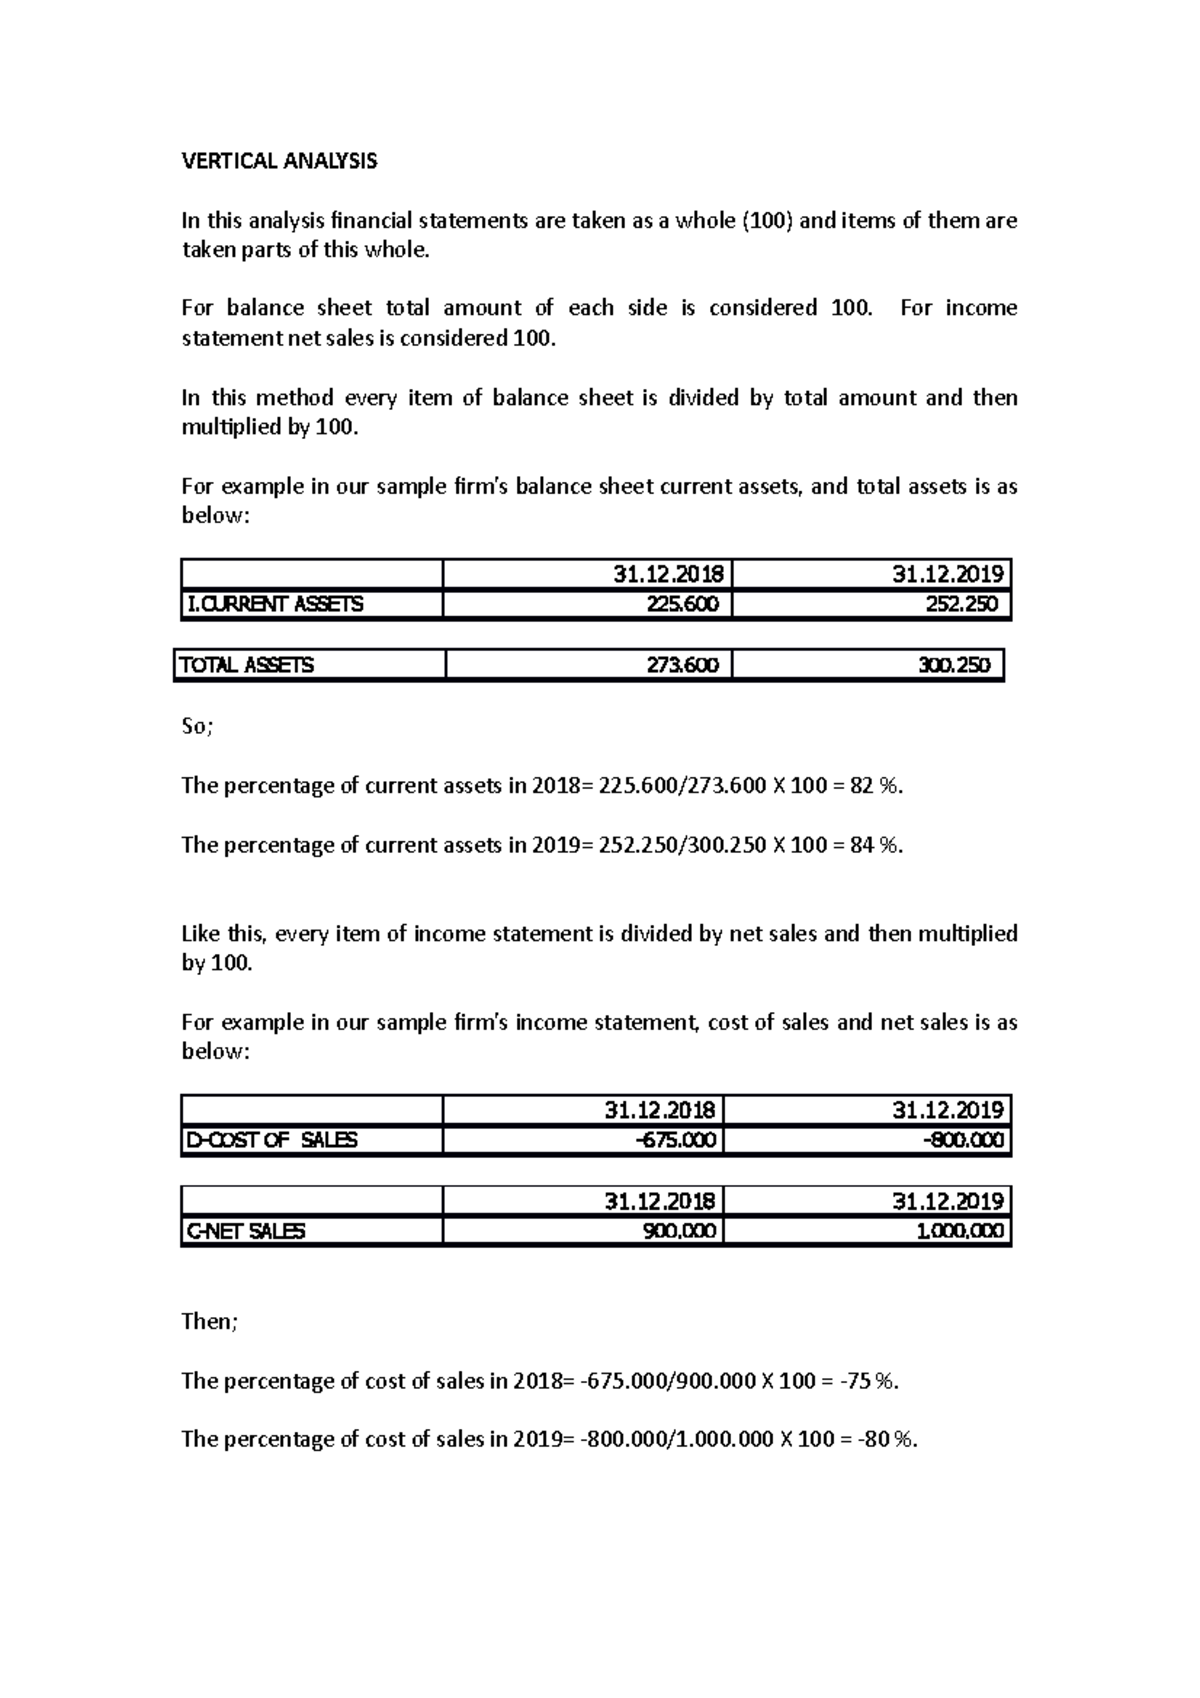
For each line item, divide the amount by the chosen base and multiply by 100. Use a spreadsheet formula to automate the process and reduce errors:
=(Line Item Value / Total Assets) * 100
Format the cells as percentages with two decimal places for clarity.
4. Group and Summarize
After calculating individual percentages, group related items into categories (e.g., all current assets). Provide a subtotal for each group, ensuring the subtotals sum to 100% at the end of the assets section. Repeat the same process for liabilities and equity.
5. Validate the Template
Check that the total of all asset percentages equals 100% (allowing a small rounding margin). Verify that the sum of liability and equity percentages also equals 100%. A mismatch indicates a data entry error or an omission.
6. Add Contextual Notes
Include a brief legend or footnotes explaining any adjustments, such as goodwill amortization or non‑recurring items, which might affect interpretation. This transparency is essential for users who rely on the template for decision‑making.
Interpreting the Results
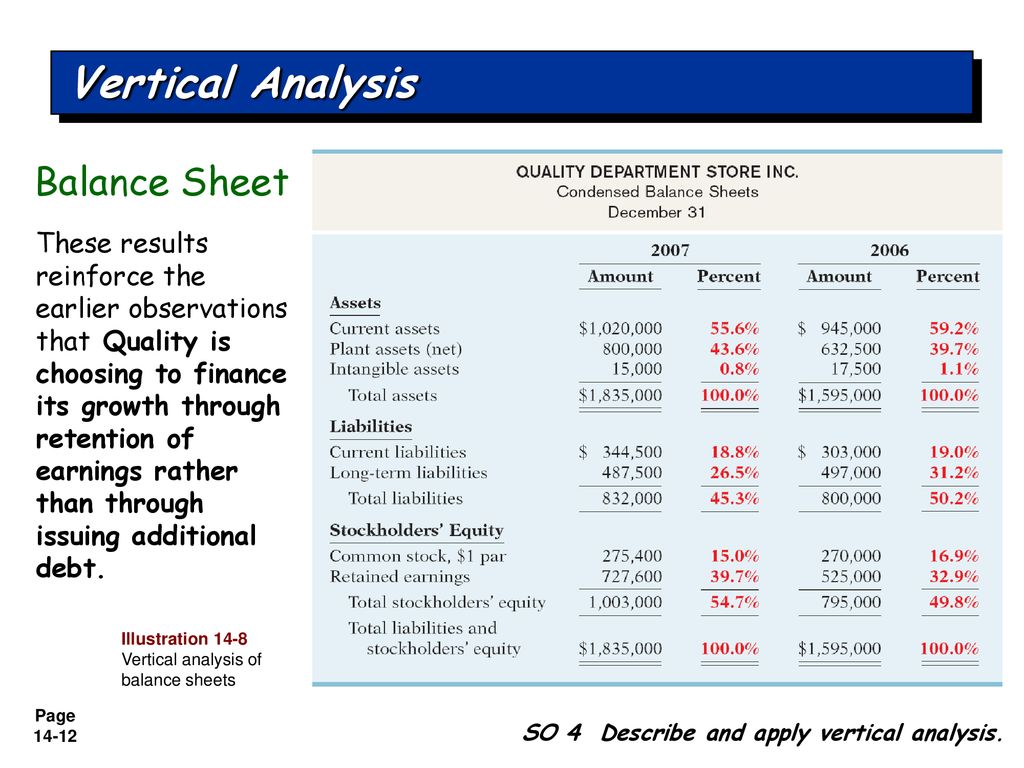
Once the template is completed, the real value emerges from the insights each percentage provides. Below are key interpretive angles and practical examples.
Assessing Asset Allocation
High percentages in cash or short‑term investments indicate strong liquidity but may also suggest underutilized capital. Conversely, a large share of property and equipment points to a capital‑intensive business model. Comparing these allocations to industry averages can reveal competitive positioning.
Evaluating Debt Structure
The proportion of short‑term versus long‑term debt highlights the firm’s leverage and risk exposure. A rising short‑term debt percentage could signal impending refinancing challenges, especially if cash reserves are insufficient to cover upcoming obligations.
Analyzing Equity Composition
Retained earnings as a percentage of total equity indicate how much profit is reinvested. A high paid‑in capital ratio may suggest significant external financing or a large issuance of shares. These metrics influence dividend policy decisions and future funding strategies.
Benchmarking Across Periods
By creating vertical balance sheets for consecutive fiscal years, one can spot structural shifts. For instance, an increase in the inventory percentage could signal supply chain bottlenecks or excess production capacity. A gradual rise in intangible assets may reflect strategic investments in intellectual property.
Benefits for Investors and Management
Vertical analysis offers multiple advantages for both internal and external stakeholders.
1. Rapid Assessment
Investors can quickly evaluate whether a company is over‑leveraged or under‑invested in assets without diving into detailed financial reports.
2. Strategic Planning
Management can identify areas where capital allocation can be optimized, such as reallocating excess cash into high‑yielding assets or reducing redundant inventory levels.
3. Performance Tracking
Consistent use of a vertical balance sheet template enables performance dashboards that track key structural ratios over time.
4. Investor Relations
Presenting a clean, percentage‑based balance sheet enhances transparency and builds trust with shareholders, analysts, and potential financiers.
Common Pitfalls and How to Avoid Them
Even seasoned analysts can stumble over misinterpretations or calculation errors. Address these common mistakes proactively.
1. Rounding Errors
Rounding each percentage too aggressively can lead to a total that diverges noticeably from 100%. Use a consistent rounding rule (e.g., two decimal places) and check the total afterward.
2. Misaligned Bases
Some firms mistakenly use total liabilities and equity as the base for the equity section while keeping total assets for the asset section. Ensure both sides use the same base to keep the percentages balanced.
3. Ignoring Non‑Recurring Items
One‑off gains or losses can distort the relative importance of line items. Exclude or disclose such items in the notes to maintain a true common‑size perspective.
4. Over‑Simplification
Grouping too many line items under a single category can mask meaningful differences. Strike a balance between simplicity and granularity based on the audience’s needs.
Integrating Vertical Analysis with Other Financial Statements
Vertical balance sheet templates complement other analytical tools, creating a more holistic view of a company’s financial health.
Linking to the Income Statement
Pairing the common‑size income statement—where each expense is shown as a percentage of sales—with the vertical balance sheet highlights how operational performance relates to financial structure.
Correlation with Cash Flow
Assess how a high percentage of fixed assets correlates with capital expenditures in the cash flow statement. This relationship can signal future cash burn or investment needs.
Ratio Analysis Enhancement
Combine vertical percentages with traditional ratios, such as the debt‑to‑equity ratio or current ratio, to validate insights or uncover hidden anomalies.
Practical Example: A Mid‑Sized Manufacturer
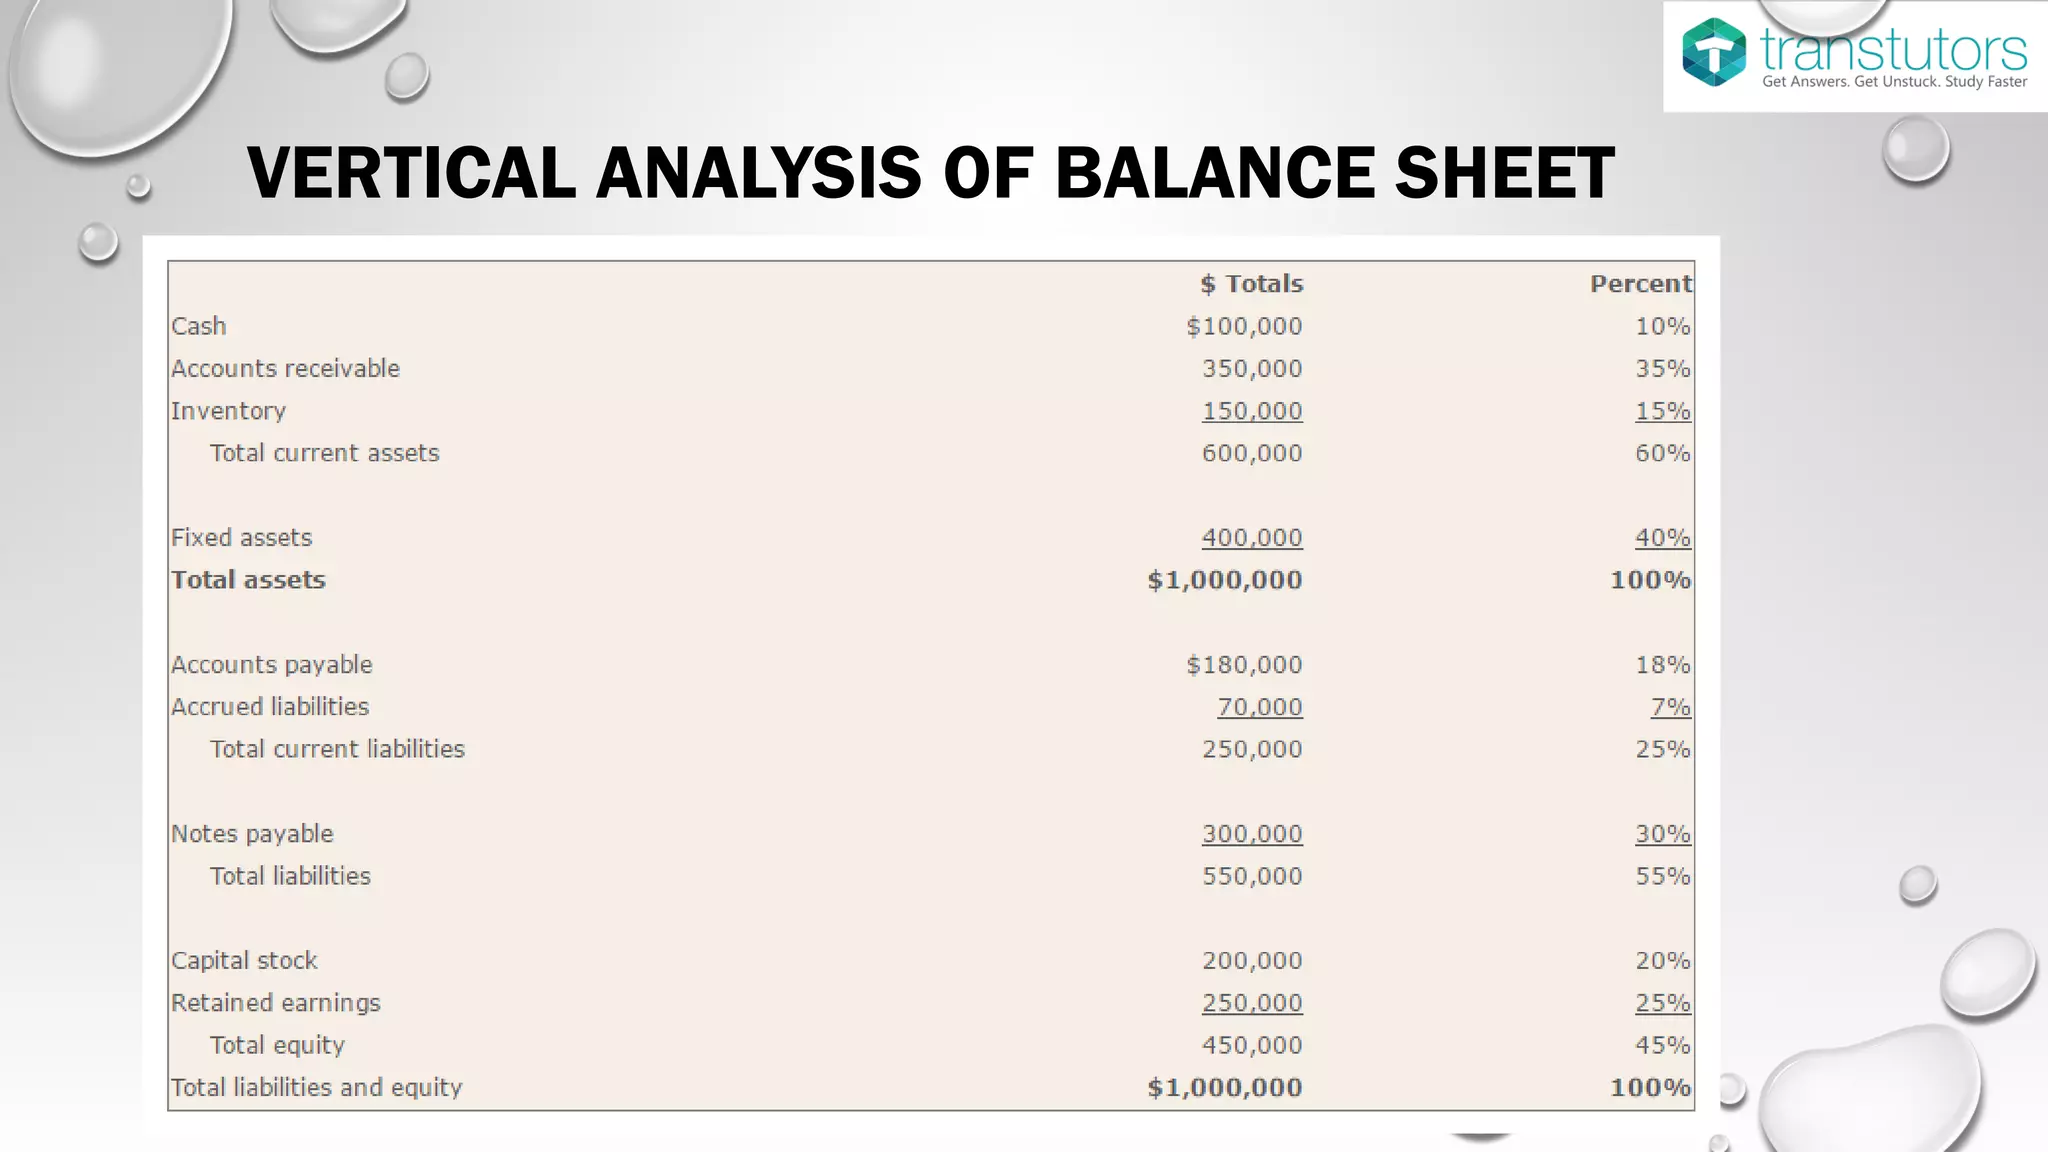
Consider “Acme Manufacturing,” a company that reported the following simplified balance sheet totals for 2025:
- Total Assets: $10,000,000
- Cash: $600,000
- Accounts Receivable: $1,200,000
- Inventories: $2,500,000
- Property, Plant & Equipment (net): $5,000,000
- Accounts Payable: $1,000,000
- Short‑Term Debt: $400,000
- Long‑Term Debt: $2,000,000
- Common Stock: $1,000,000
- Retained Earnings: $1,000,000
Applying vertical analysis:
- Cash: 6.00%
- Accounts Receivable: 12.00%
- Inventories: 25.00%
- PP&E: 50.00%
- Accounts Payable: 10.00%
- Short‑Term Debt: 4.00%
- Long‑Term Debt: 20.00%
- Common Stock: 10.00%
- Retained Earnings: 10.00%
Interpretation: Acme’s PP&E dominates its asset base, reflecting a capital‑intensive industry. The debt structure shows a heavier long‑term debt presence, which is typical for manufacturing. The 10% equity split between common stock and retained earnings suggests a balanced approach between external and internal funding. Compared to industry averages, Acme’s cash reserves are modest, indicating potential liquidity risks if operating cash flow falters.
Automating Vertical Analysis with Excel Templates
For day‑to‑day operations, an Excel or Google Sheets template accelerates the process. Key features include:
- Dynamic References – Linked to the company’s latest financial data.
- Conditional Formatting – Highlights significant changes or outliers in percentages.
- Pivot Tables – Enables quick grouping and summarizing of sub‑categories.
- Chart Integration – Generates bar or pie charts to visualize the common‑size distribution.
By integrating this template into quarterly reporting cycles, analysts save time and maintain consistency across reports.
Conclusion

The Vertical Analysis Balance Sheet Template transforms raw numbers into actionable insight. By standardizing each line item against a common base, stakeholders gain a clear view of asset allocation, debt structure, and equity composition. Whether you are an internal manager charting strategic shifts or an external investor conducting due diligence, the common‑size approach offers a quick, reliable lens into a company’s financial architecture. Implementing a well‑crafted template, automating calculations, and pairing vertical analysis with complementary statements will empower decision‑makers to navigate the complexities of modern finance with confidence and precision.