.webp)
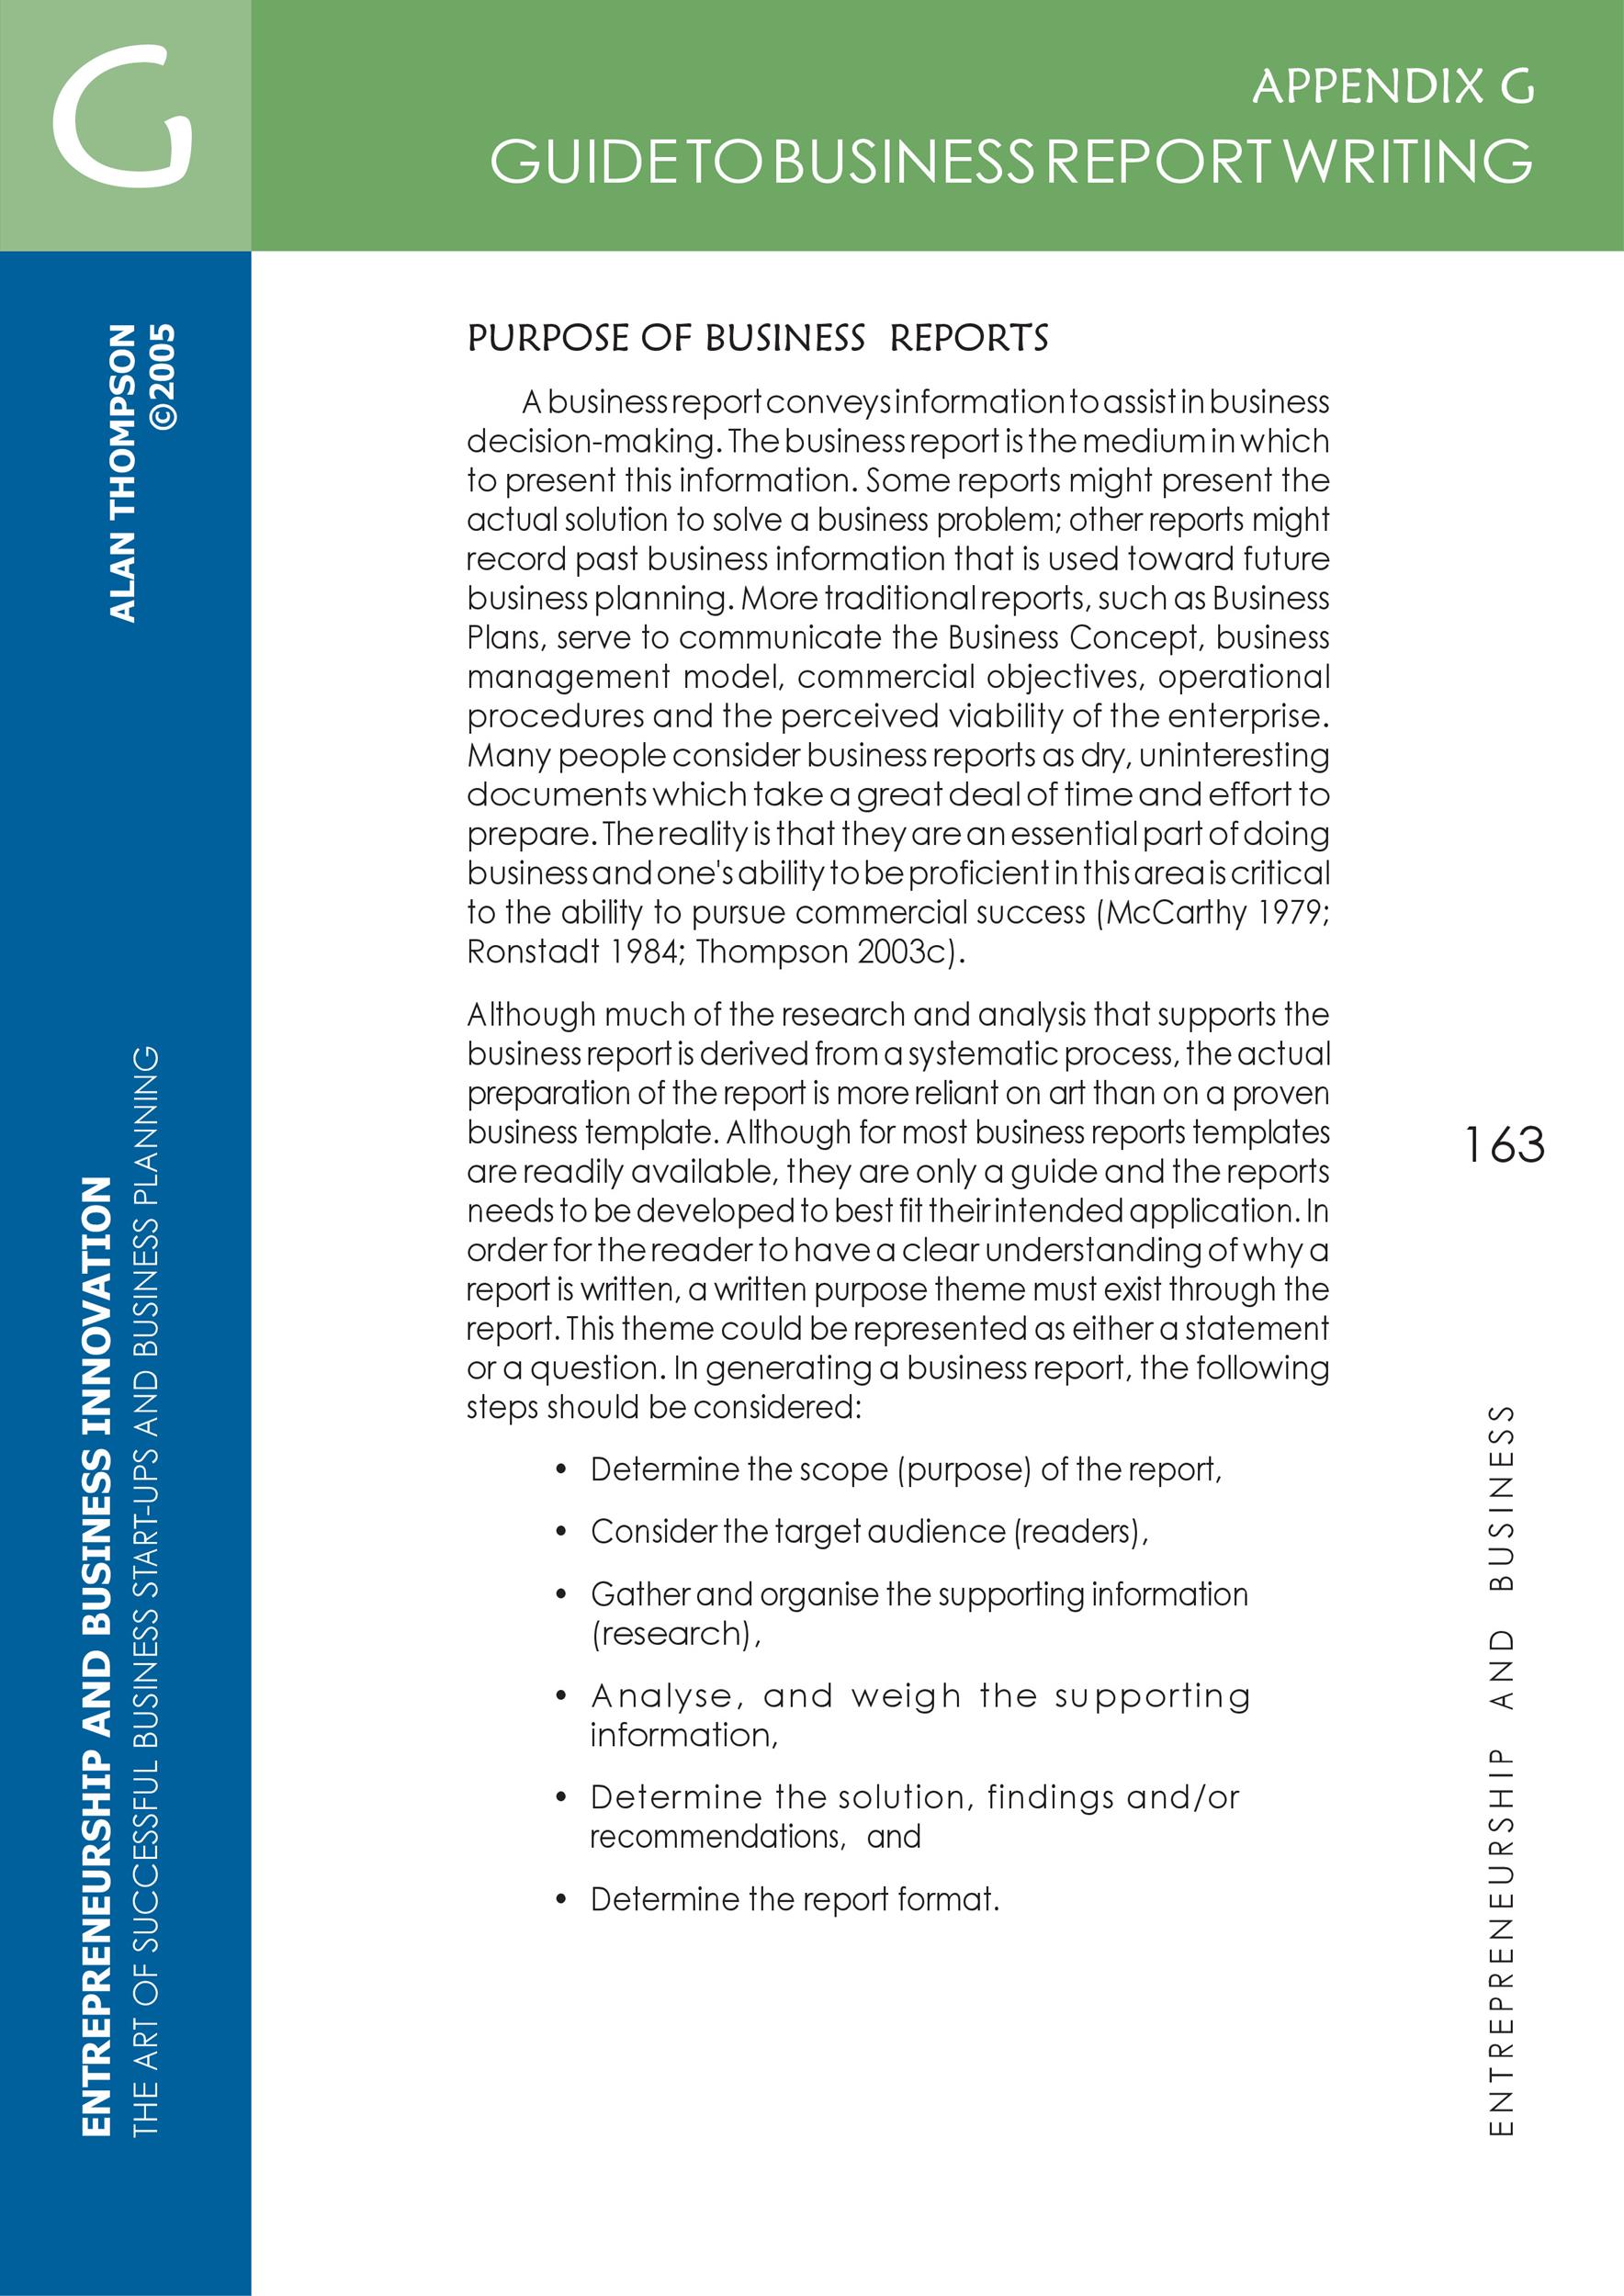
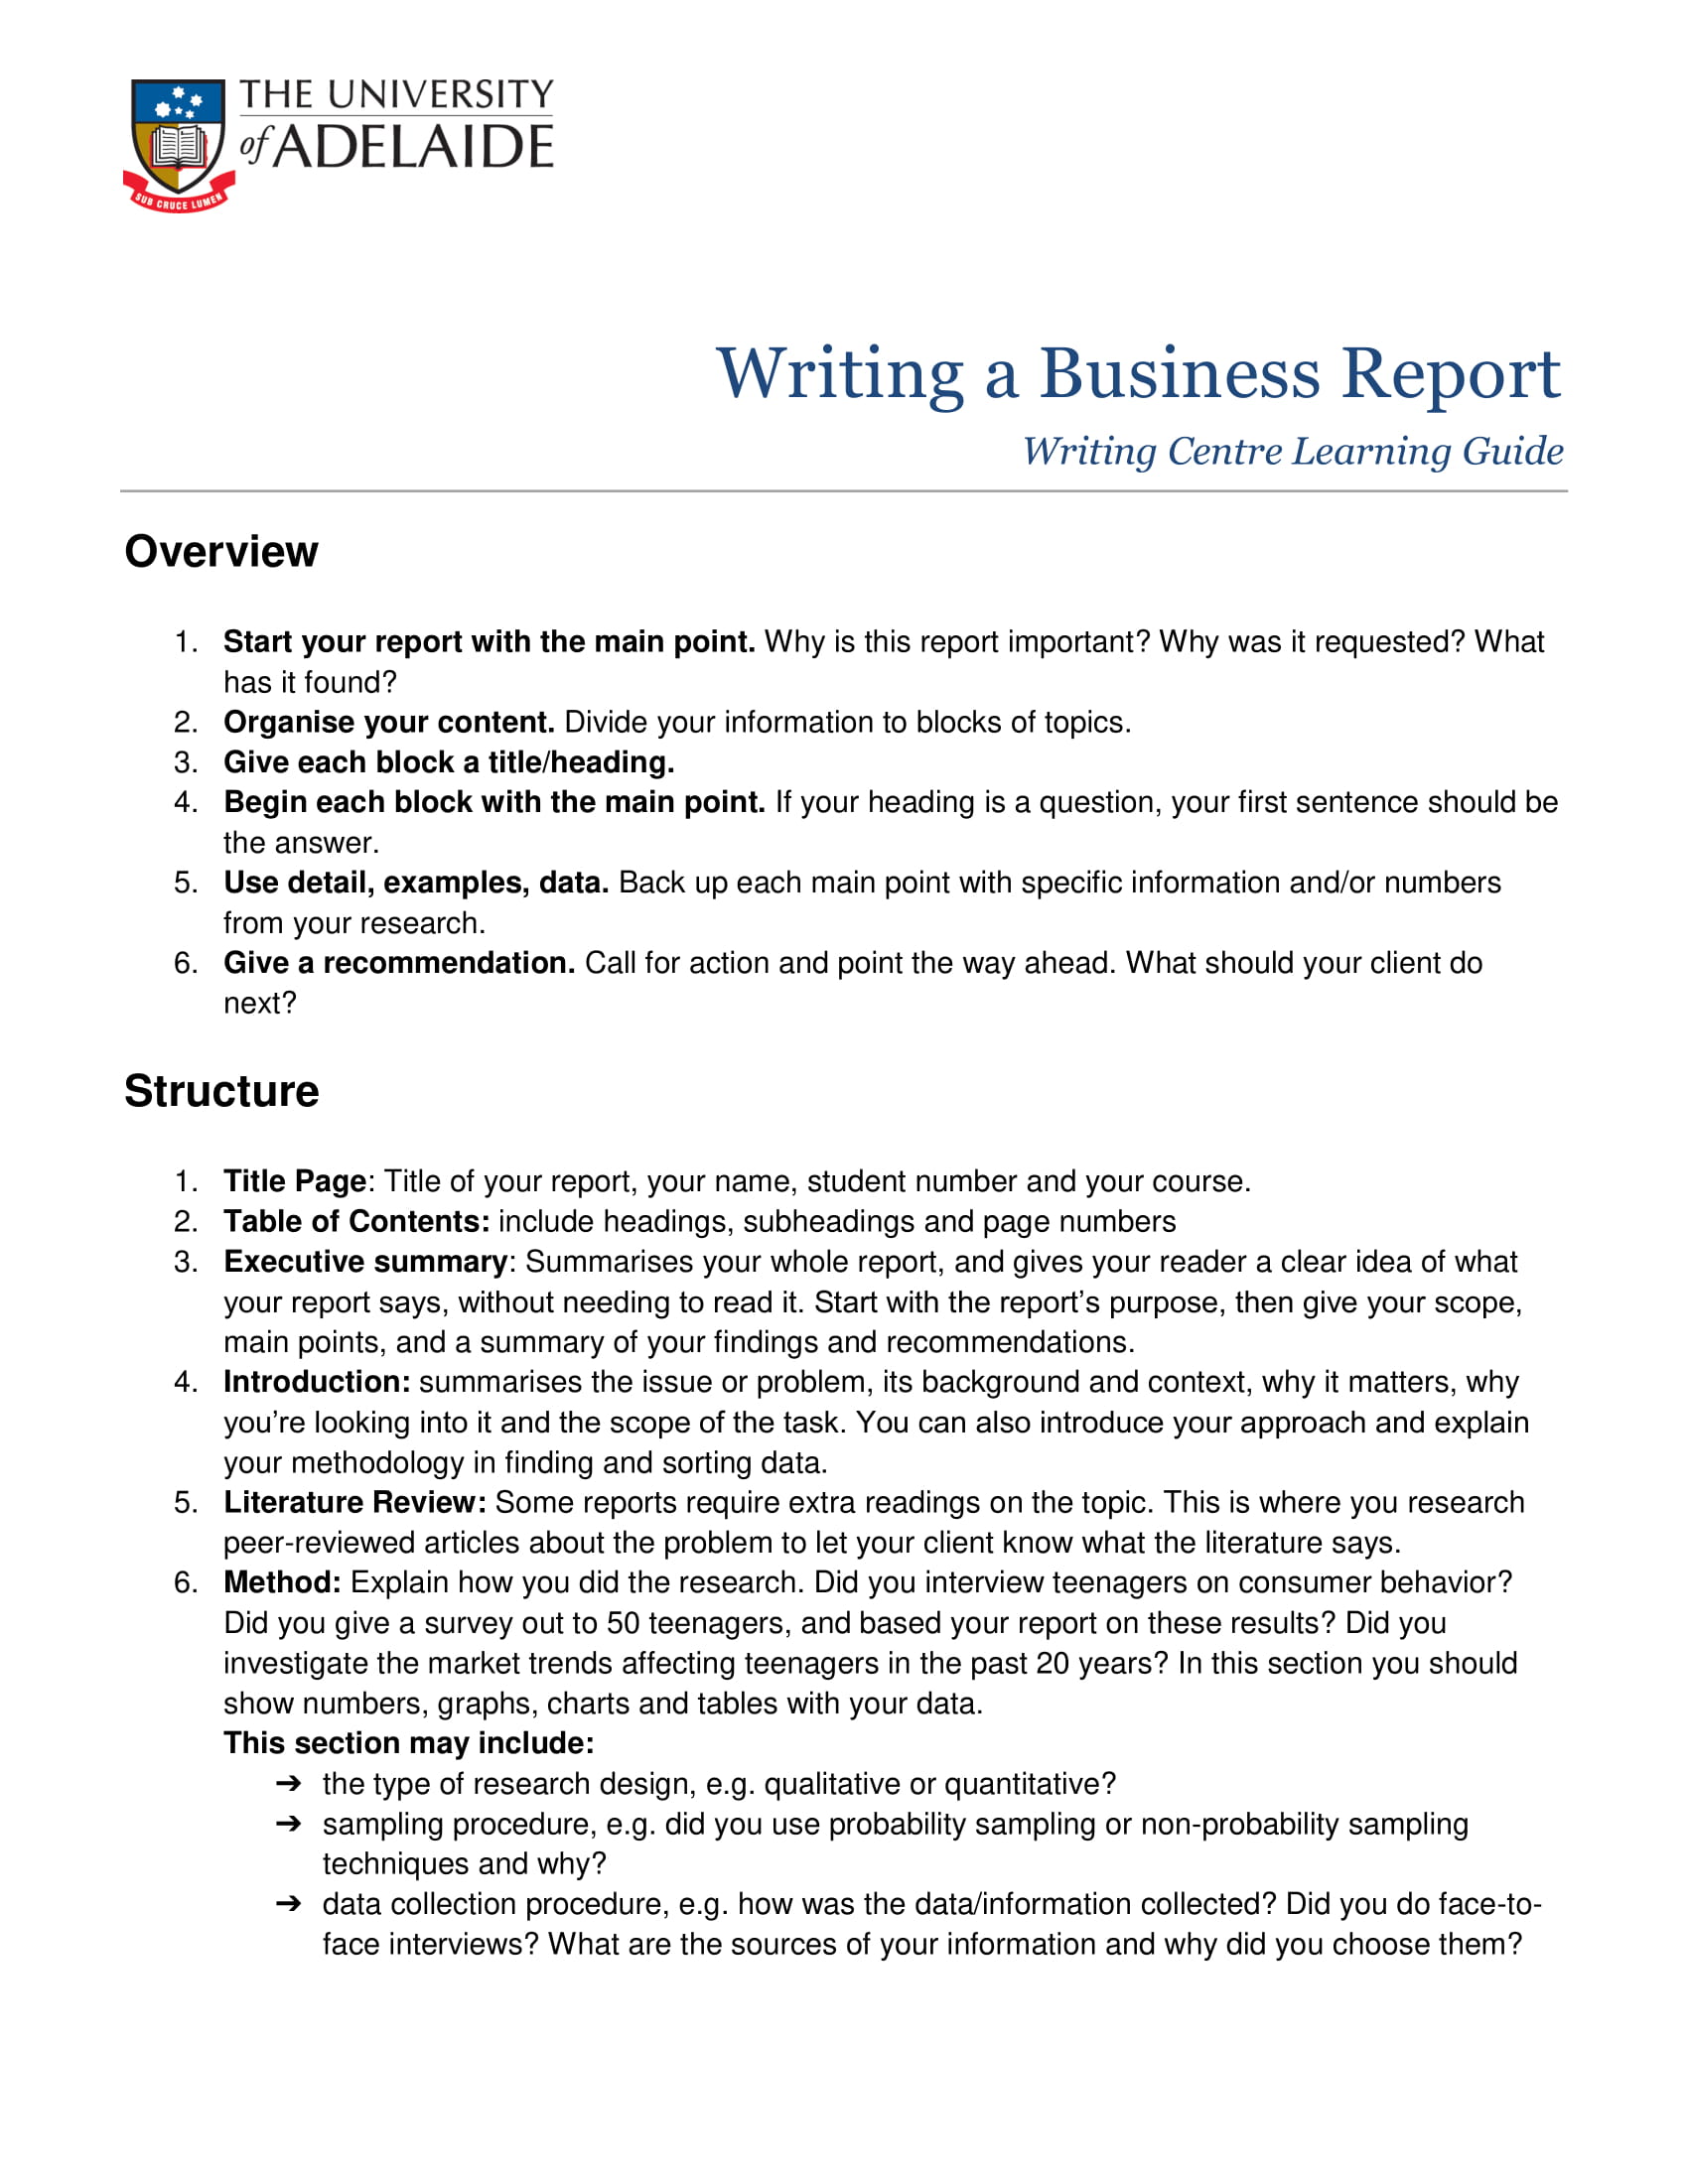
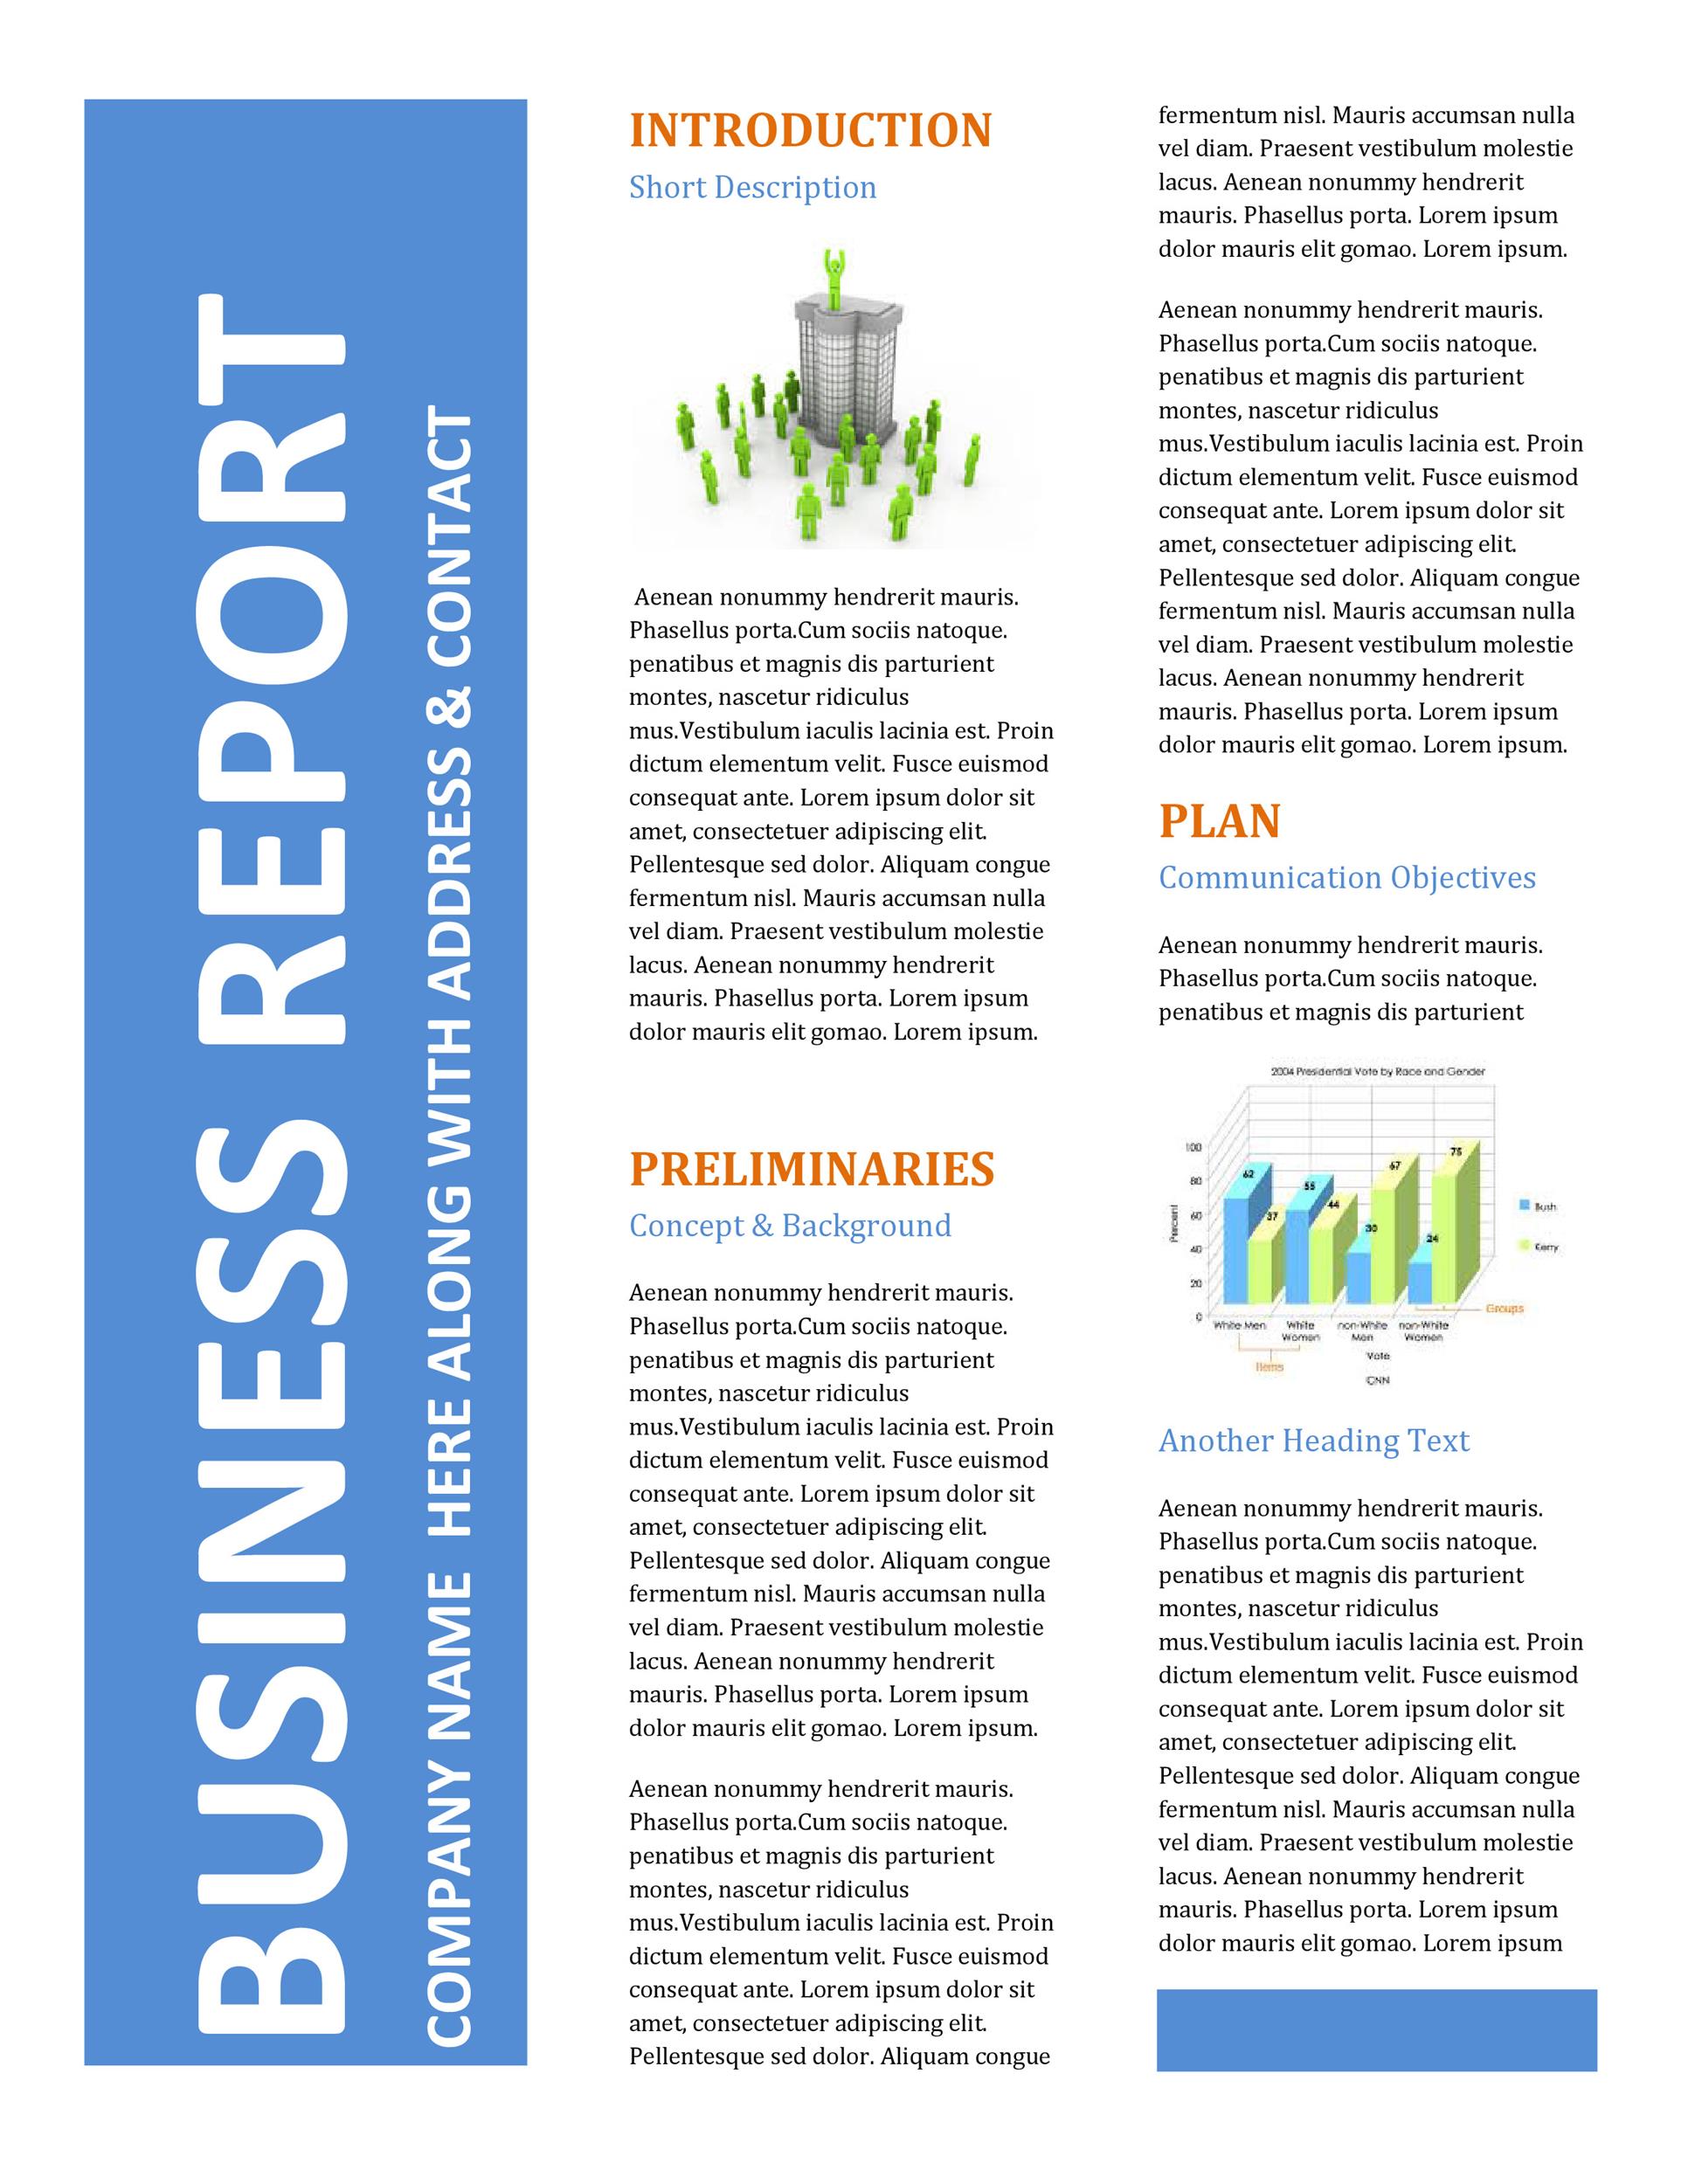
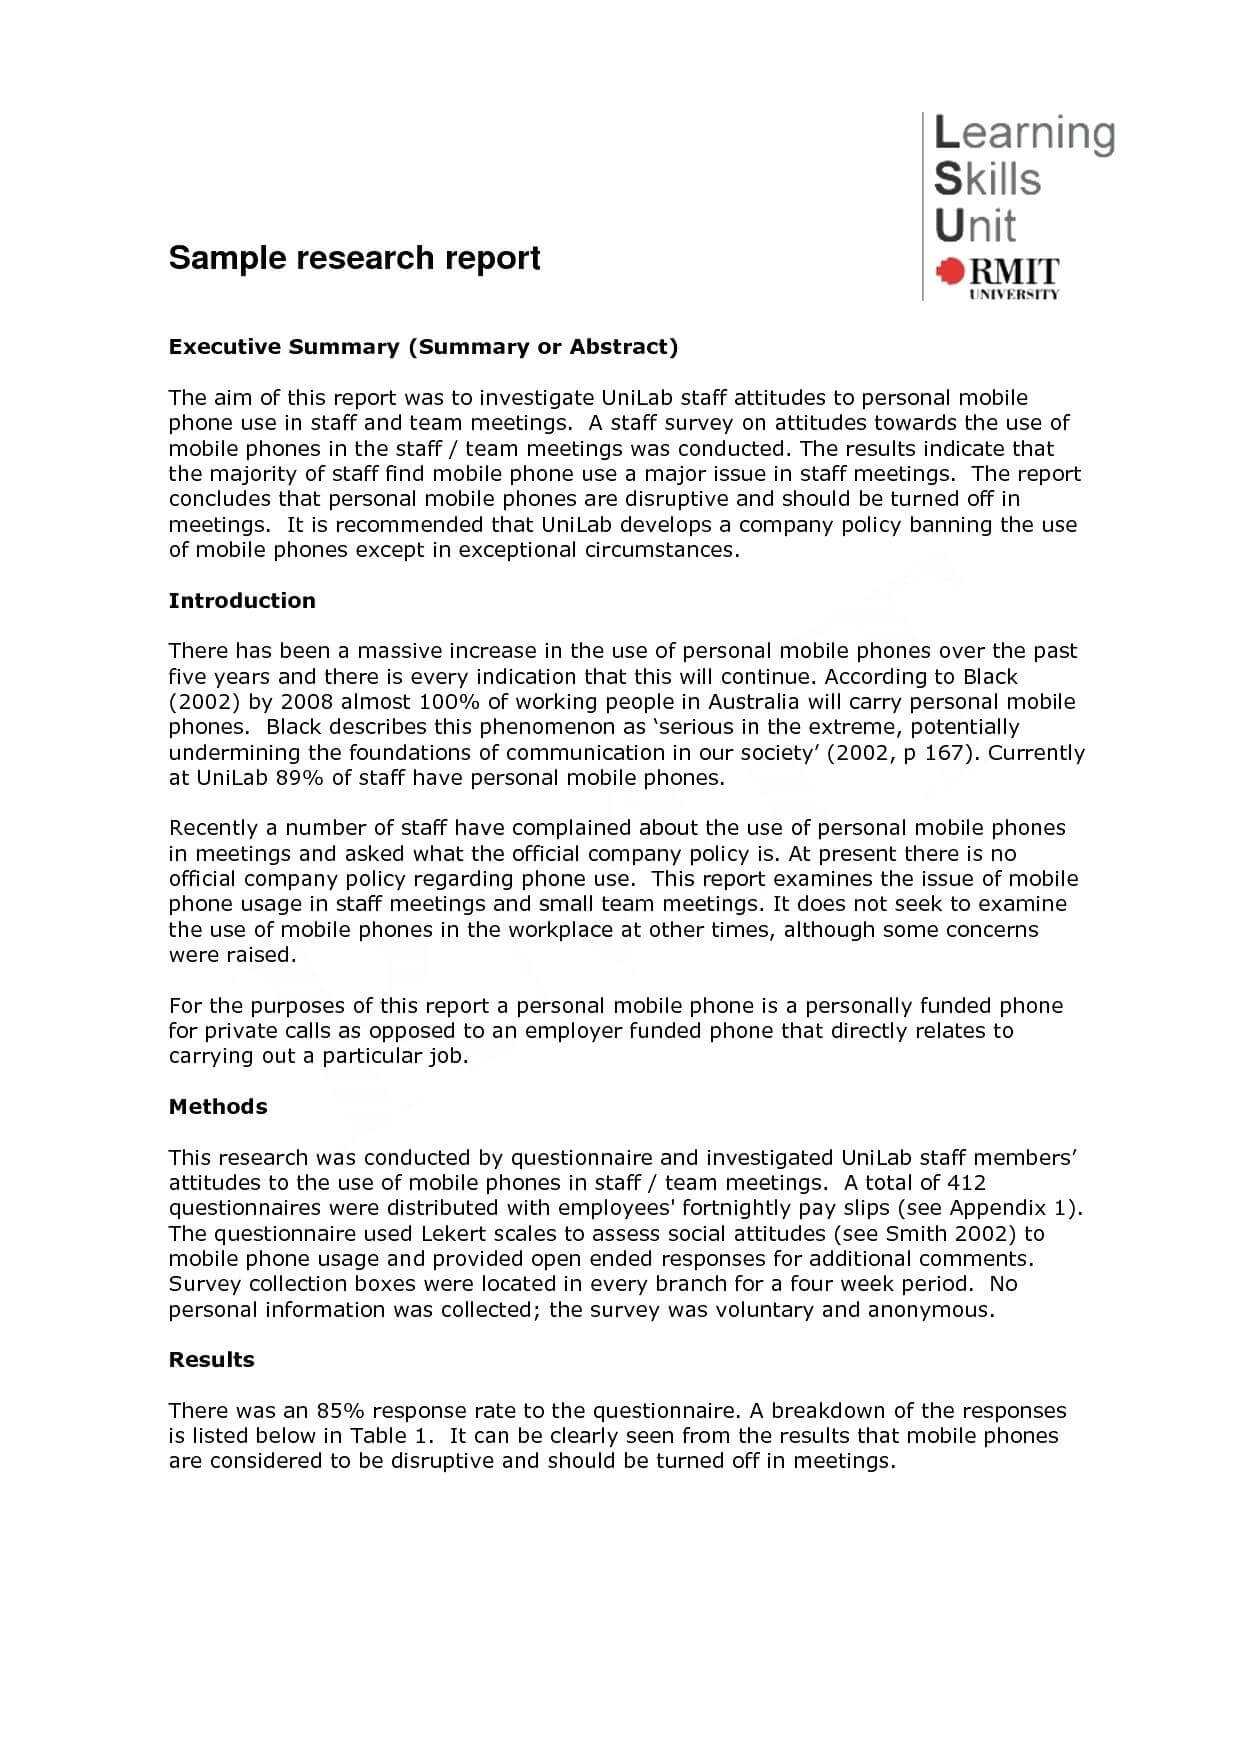
Template On How To Write A Report is the ultimate cheat sheet for turning your chaotic brainstorm into a polished, professional masterpiece—while still making readers chuckle. Imagine a report that feels like a friendly chat over coffee, but with the structure and gravitas of a seasoned analyst. That’s the sweet spot we’ll aim for today.
Why a Good Report Template Matters
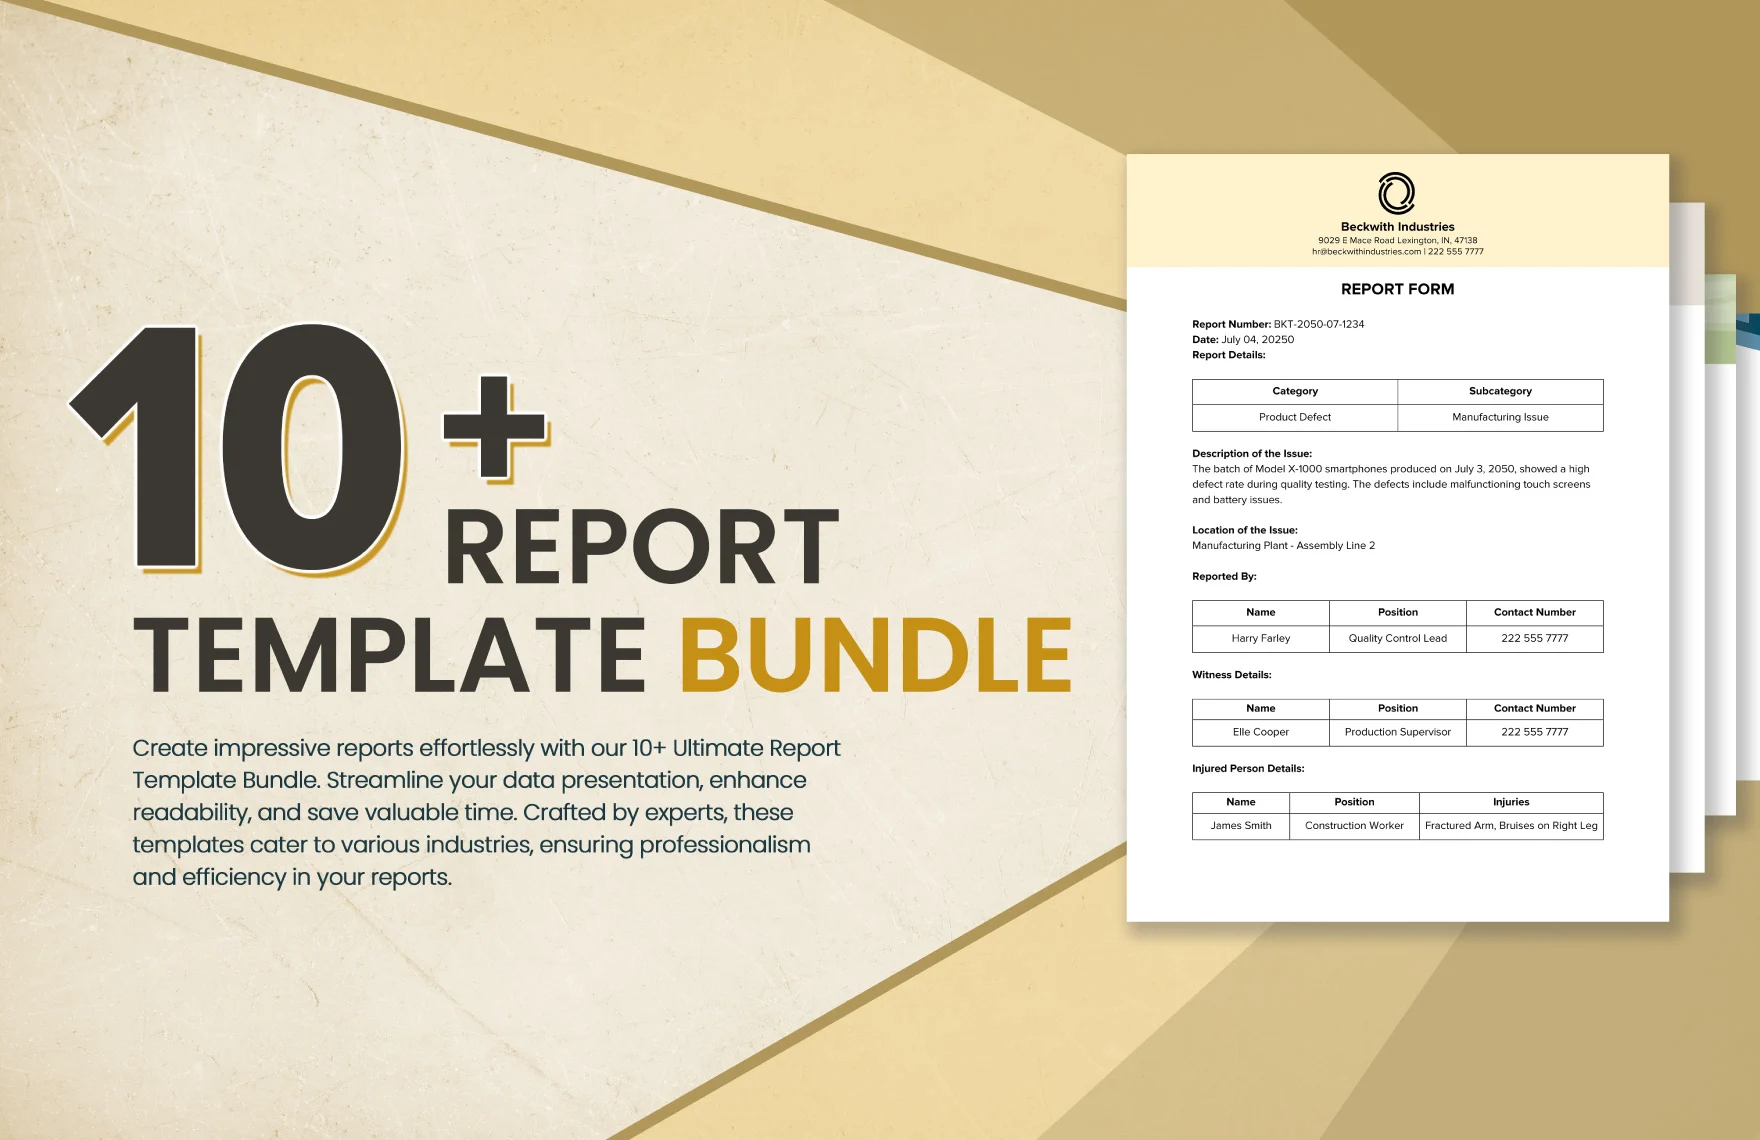
A well‑crafted template is the unsung hero of effective communication. It saves you time, ensures consistency, and, most importantly, keeps your audience from doing an eye roll at another mind‑numbing document. Think of it as a pair of ergonomic shoes for your writing—comfort, style, and a guarantee that you won’t trip on your own words.
Core Components of a Killer Report

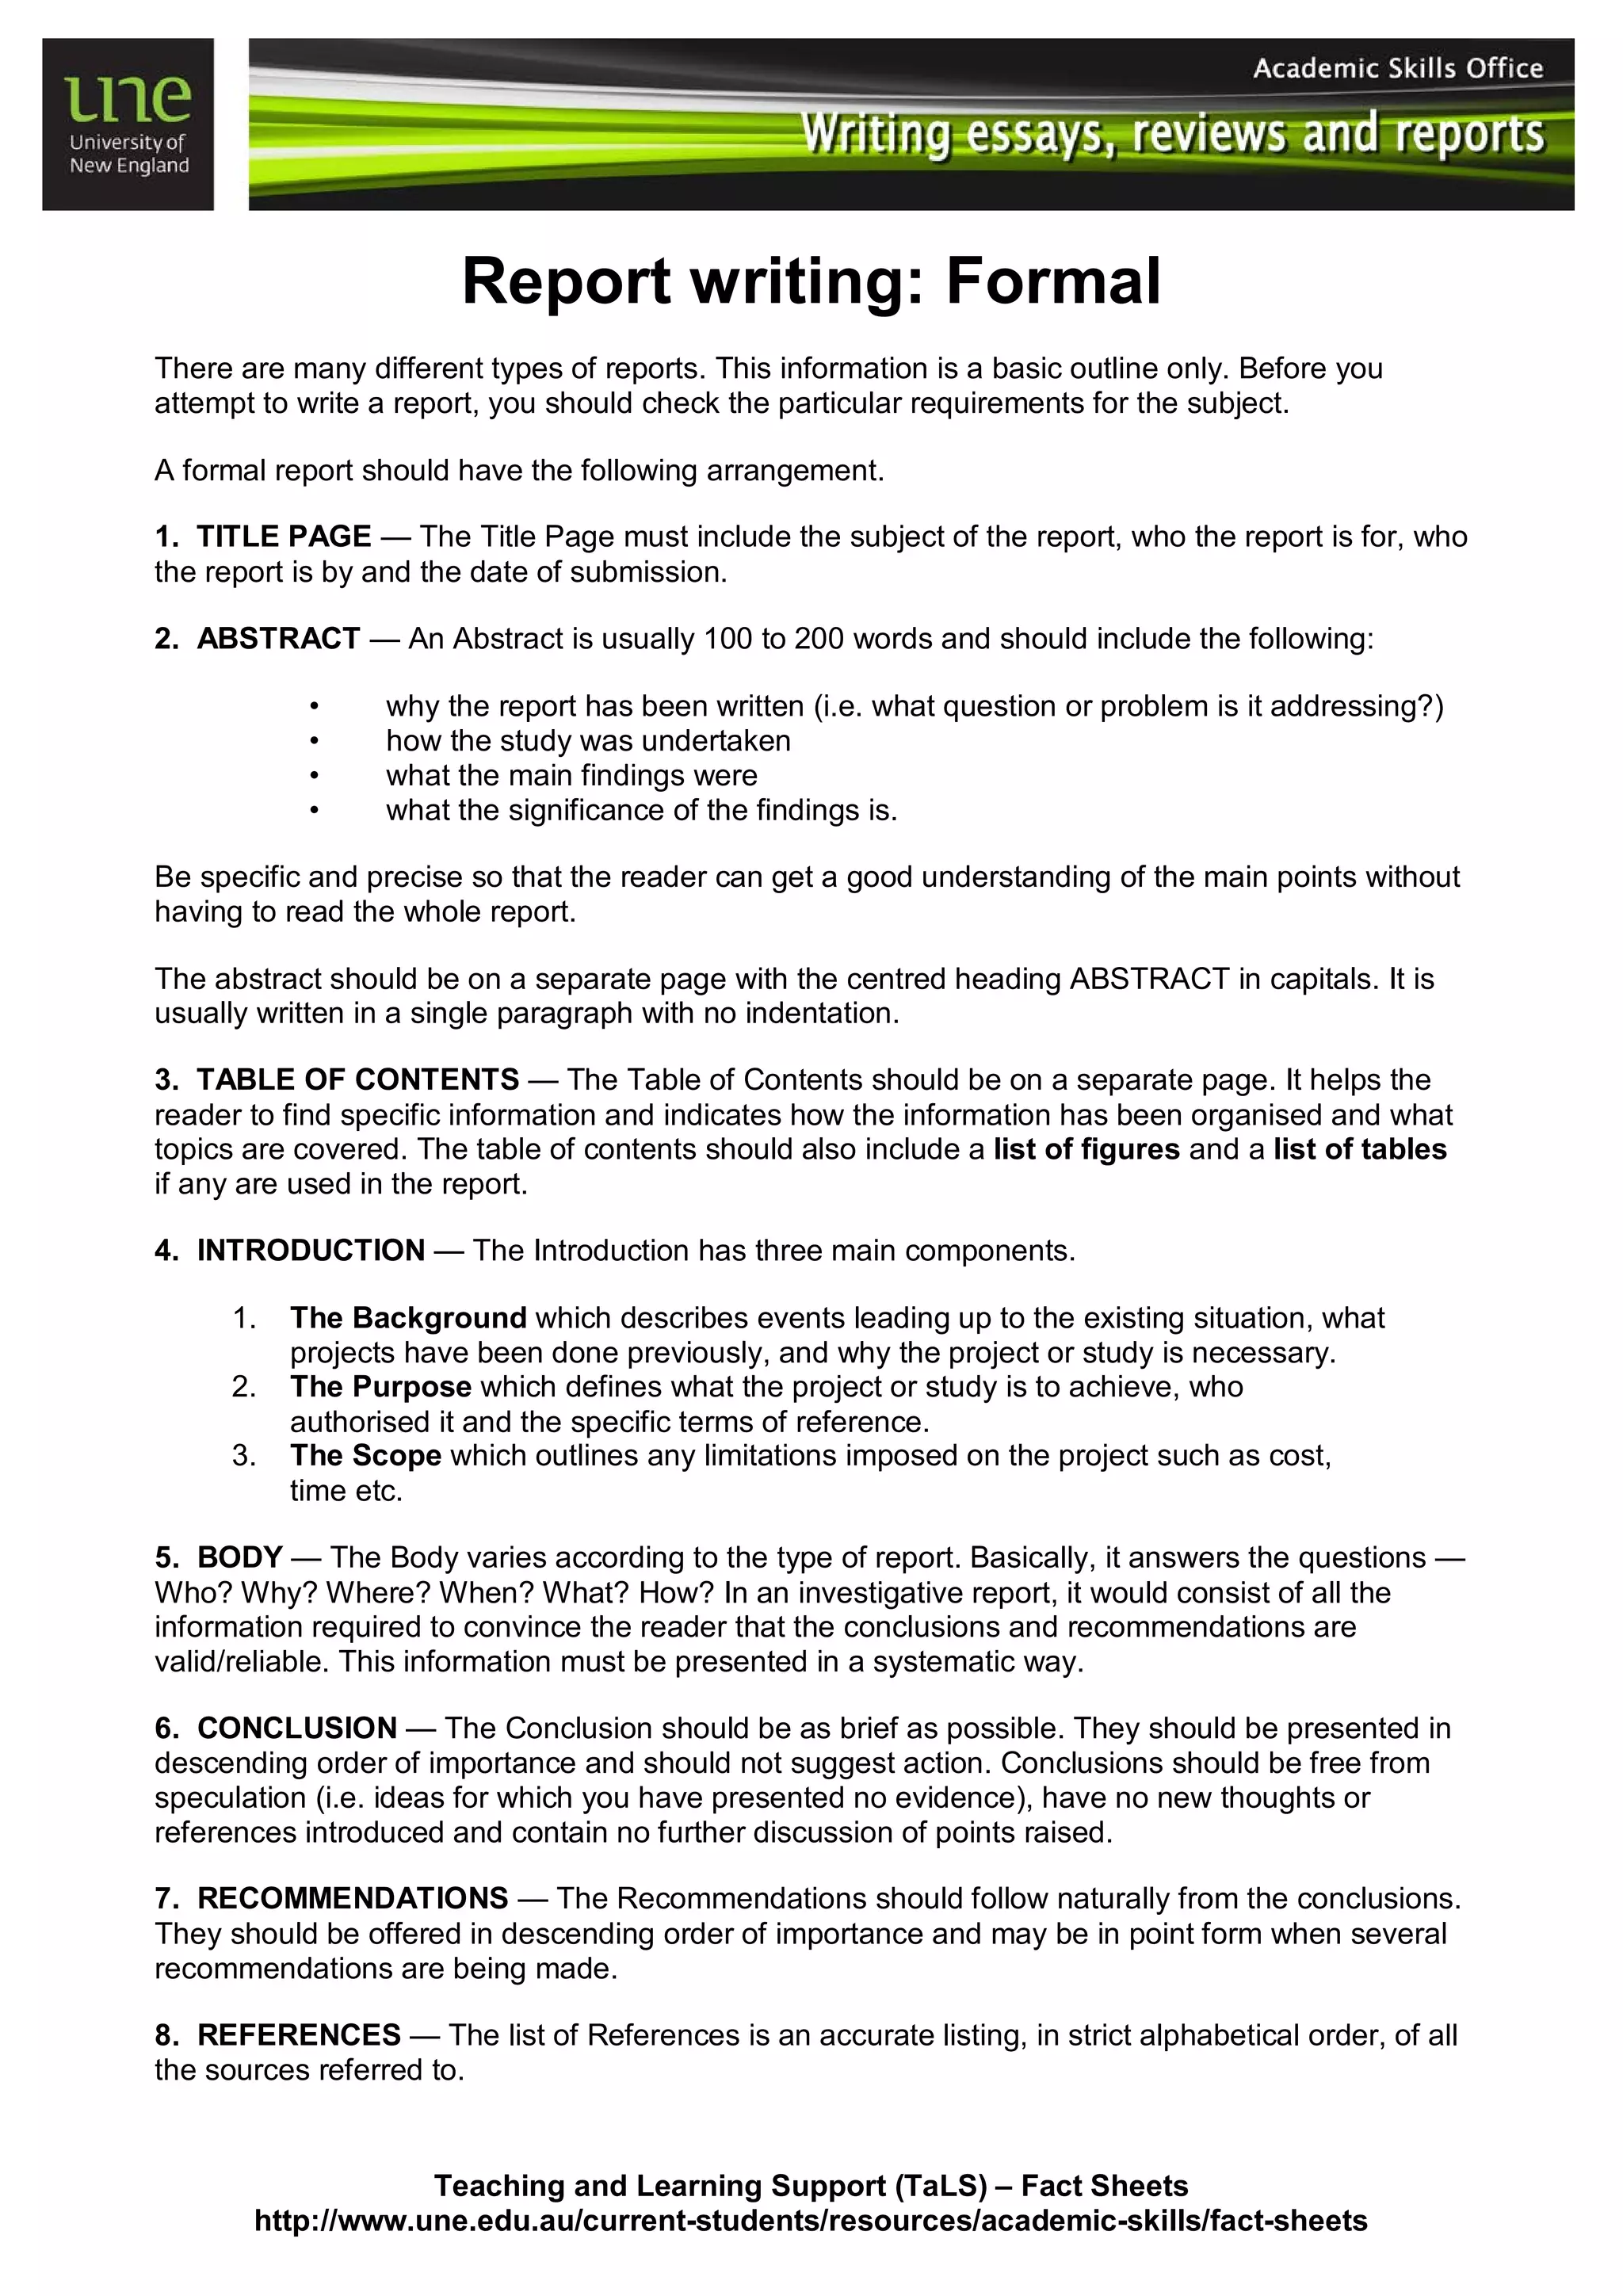
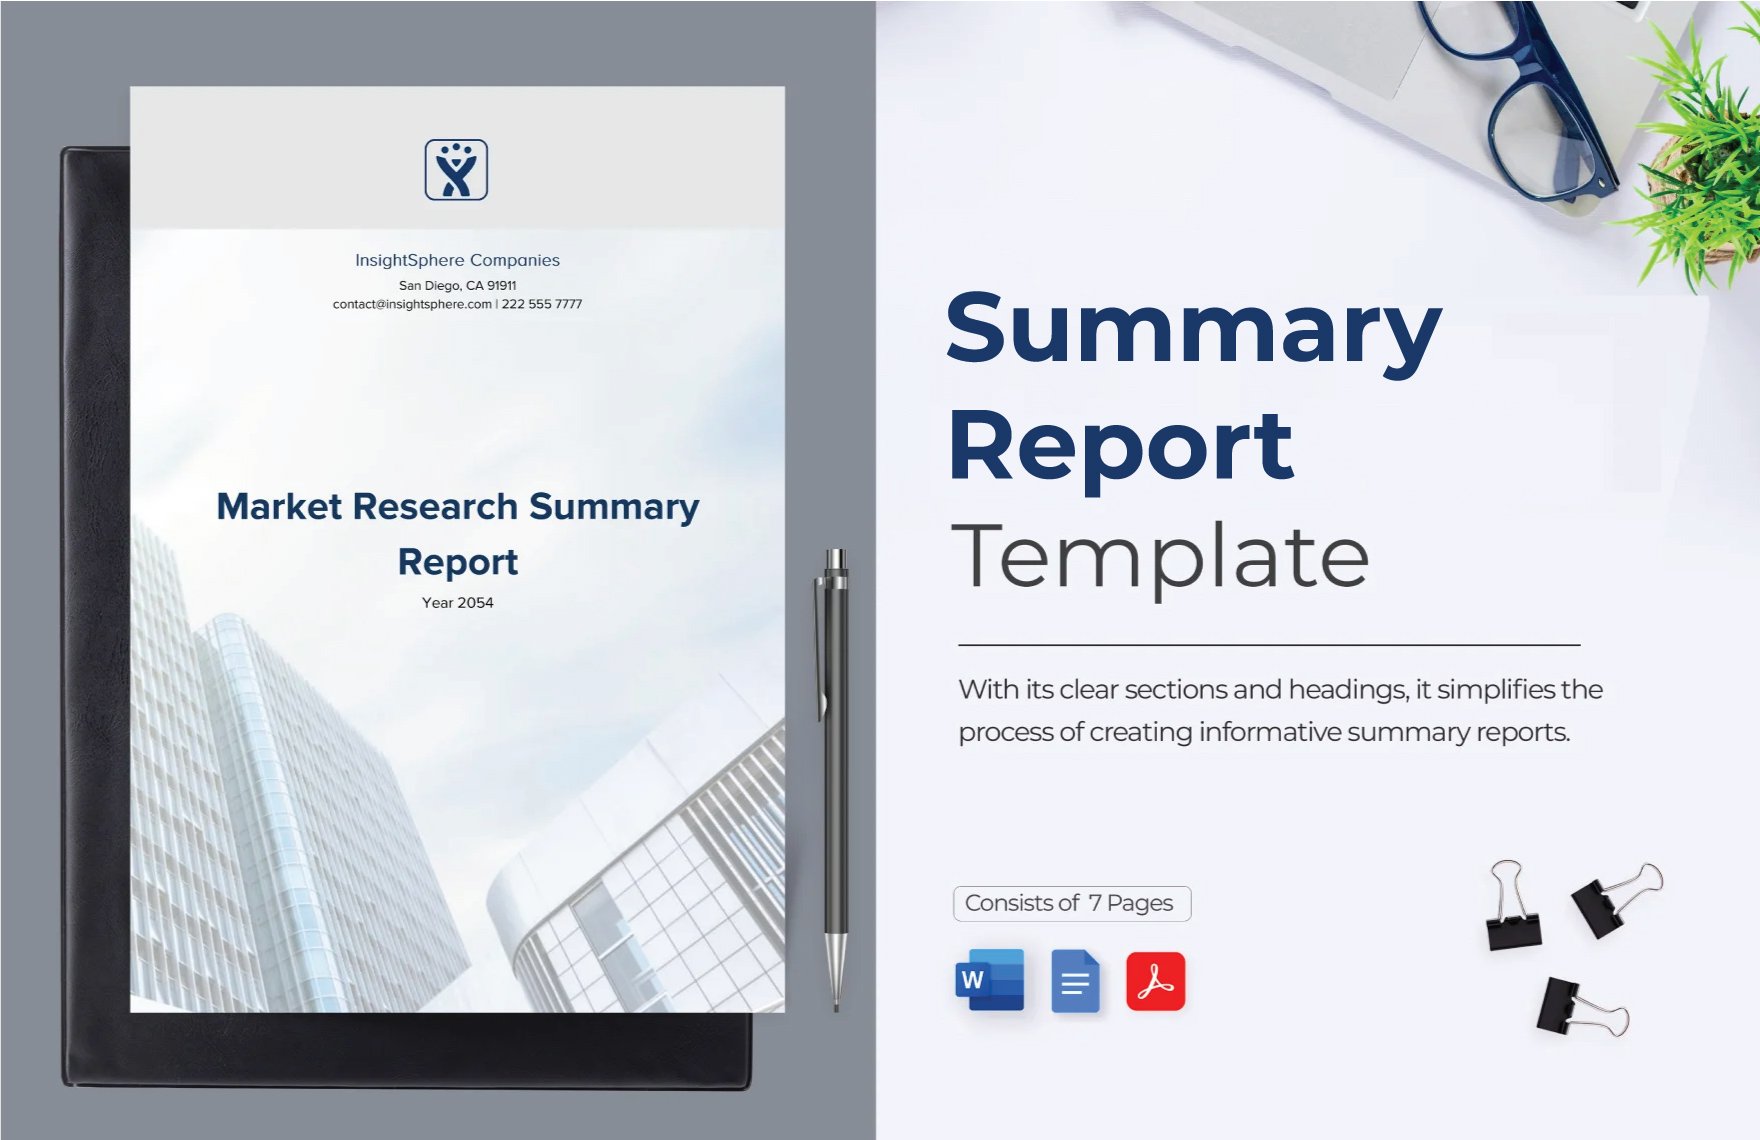
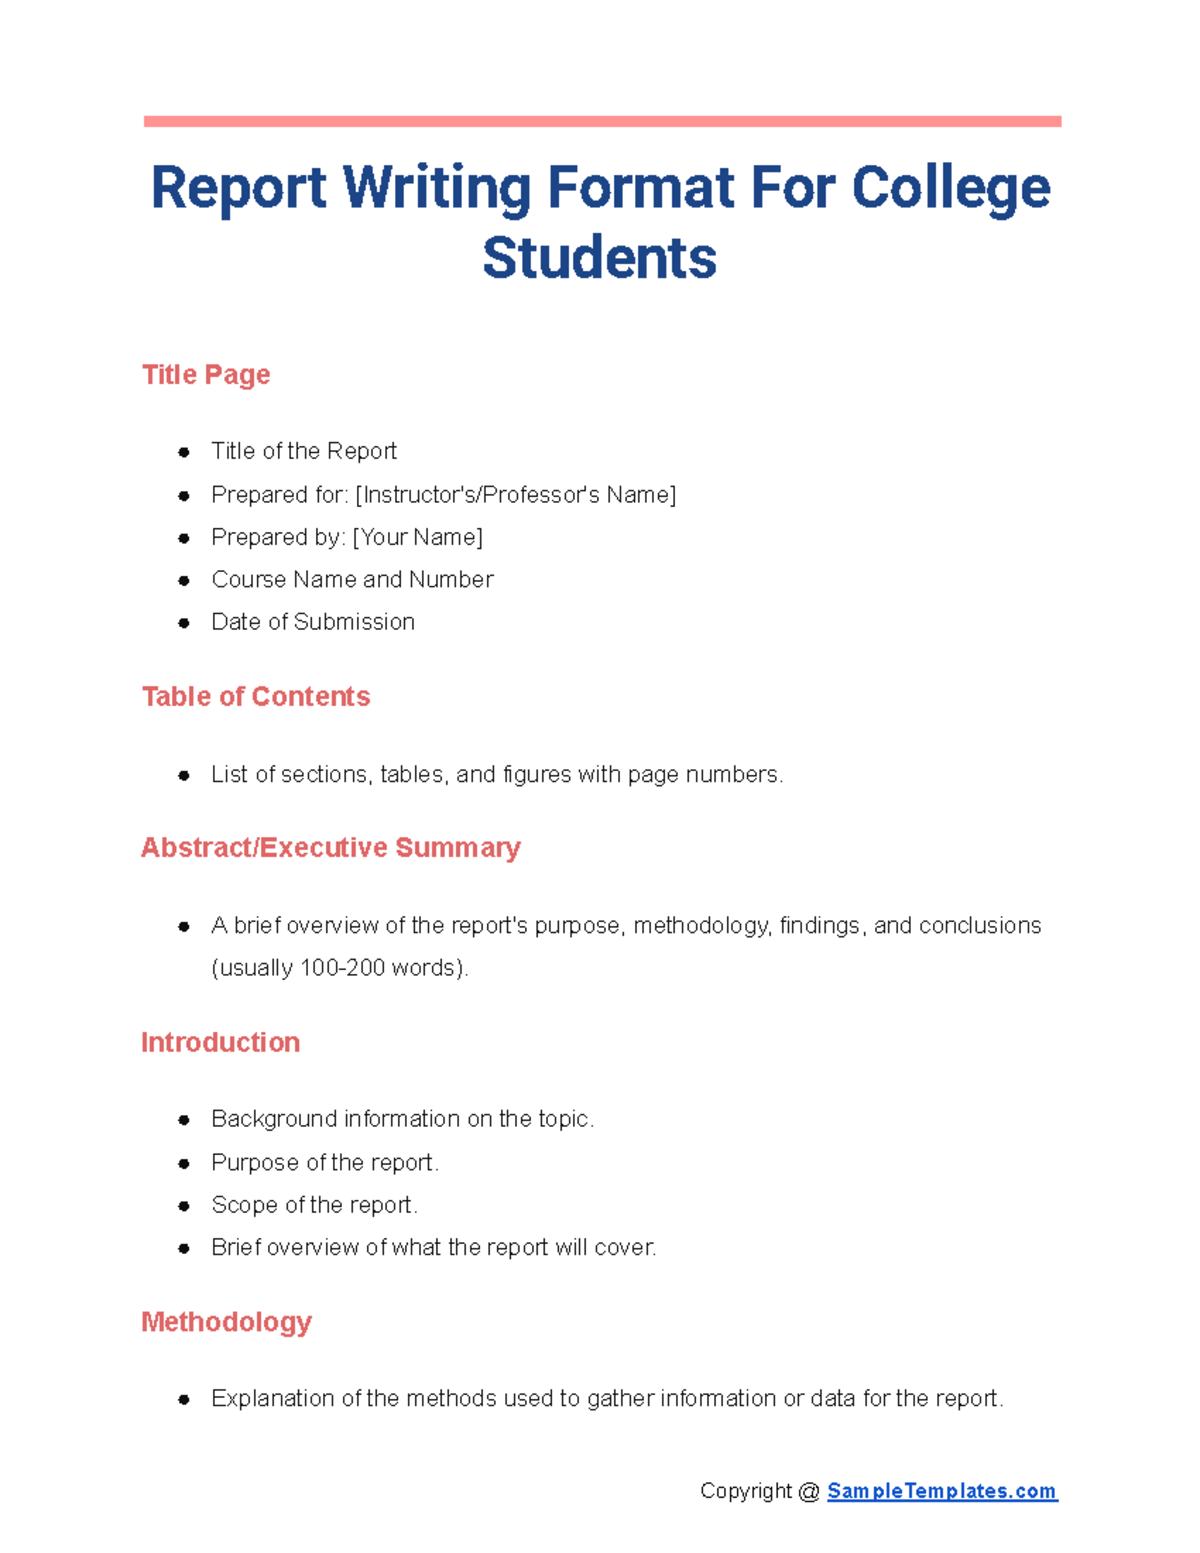
Title and Cover Page
The first impression is everything. A clean, bold title, a concise subtitle, and a professional logo set the tone. Keep the font size big for the title and moderate for the subtitle, so the hierarchy is clear. Add a tagline if you’re feeling extra confident.
Executive Summary
Not everyone has the patience for a full report. The executive summary condenses the key points, findings, and recommendations into a single, digestible paragraph. Use bullets, bold headings, and short sentences to make this section a quick snack rather than a full meal.
Table of Contents
Never let your readers navigate blind. A well‑structured table of contents with page numbers (or clickable links in PDFs) turns your document into a guided tour. Remember to update the TOC after final edits to keep it accurate.
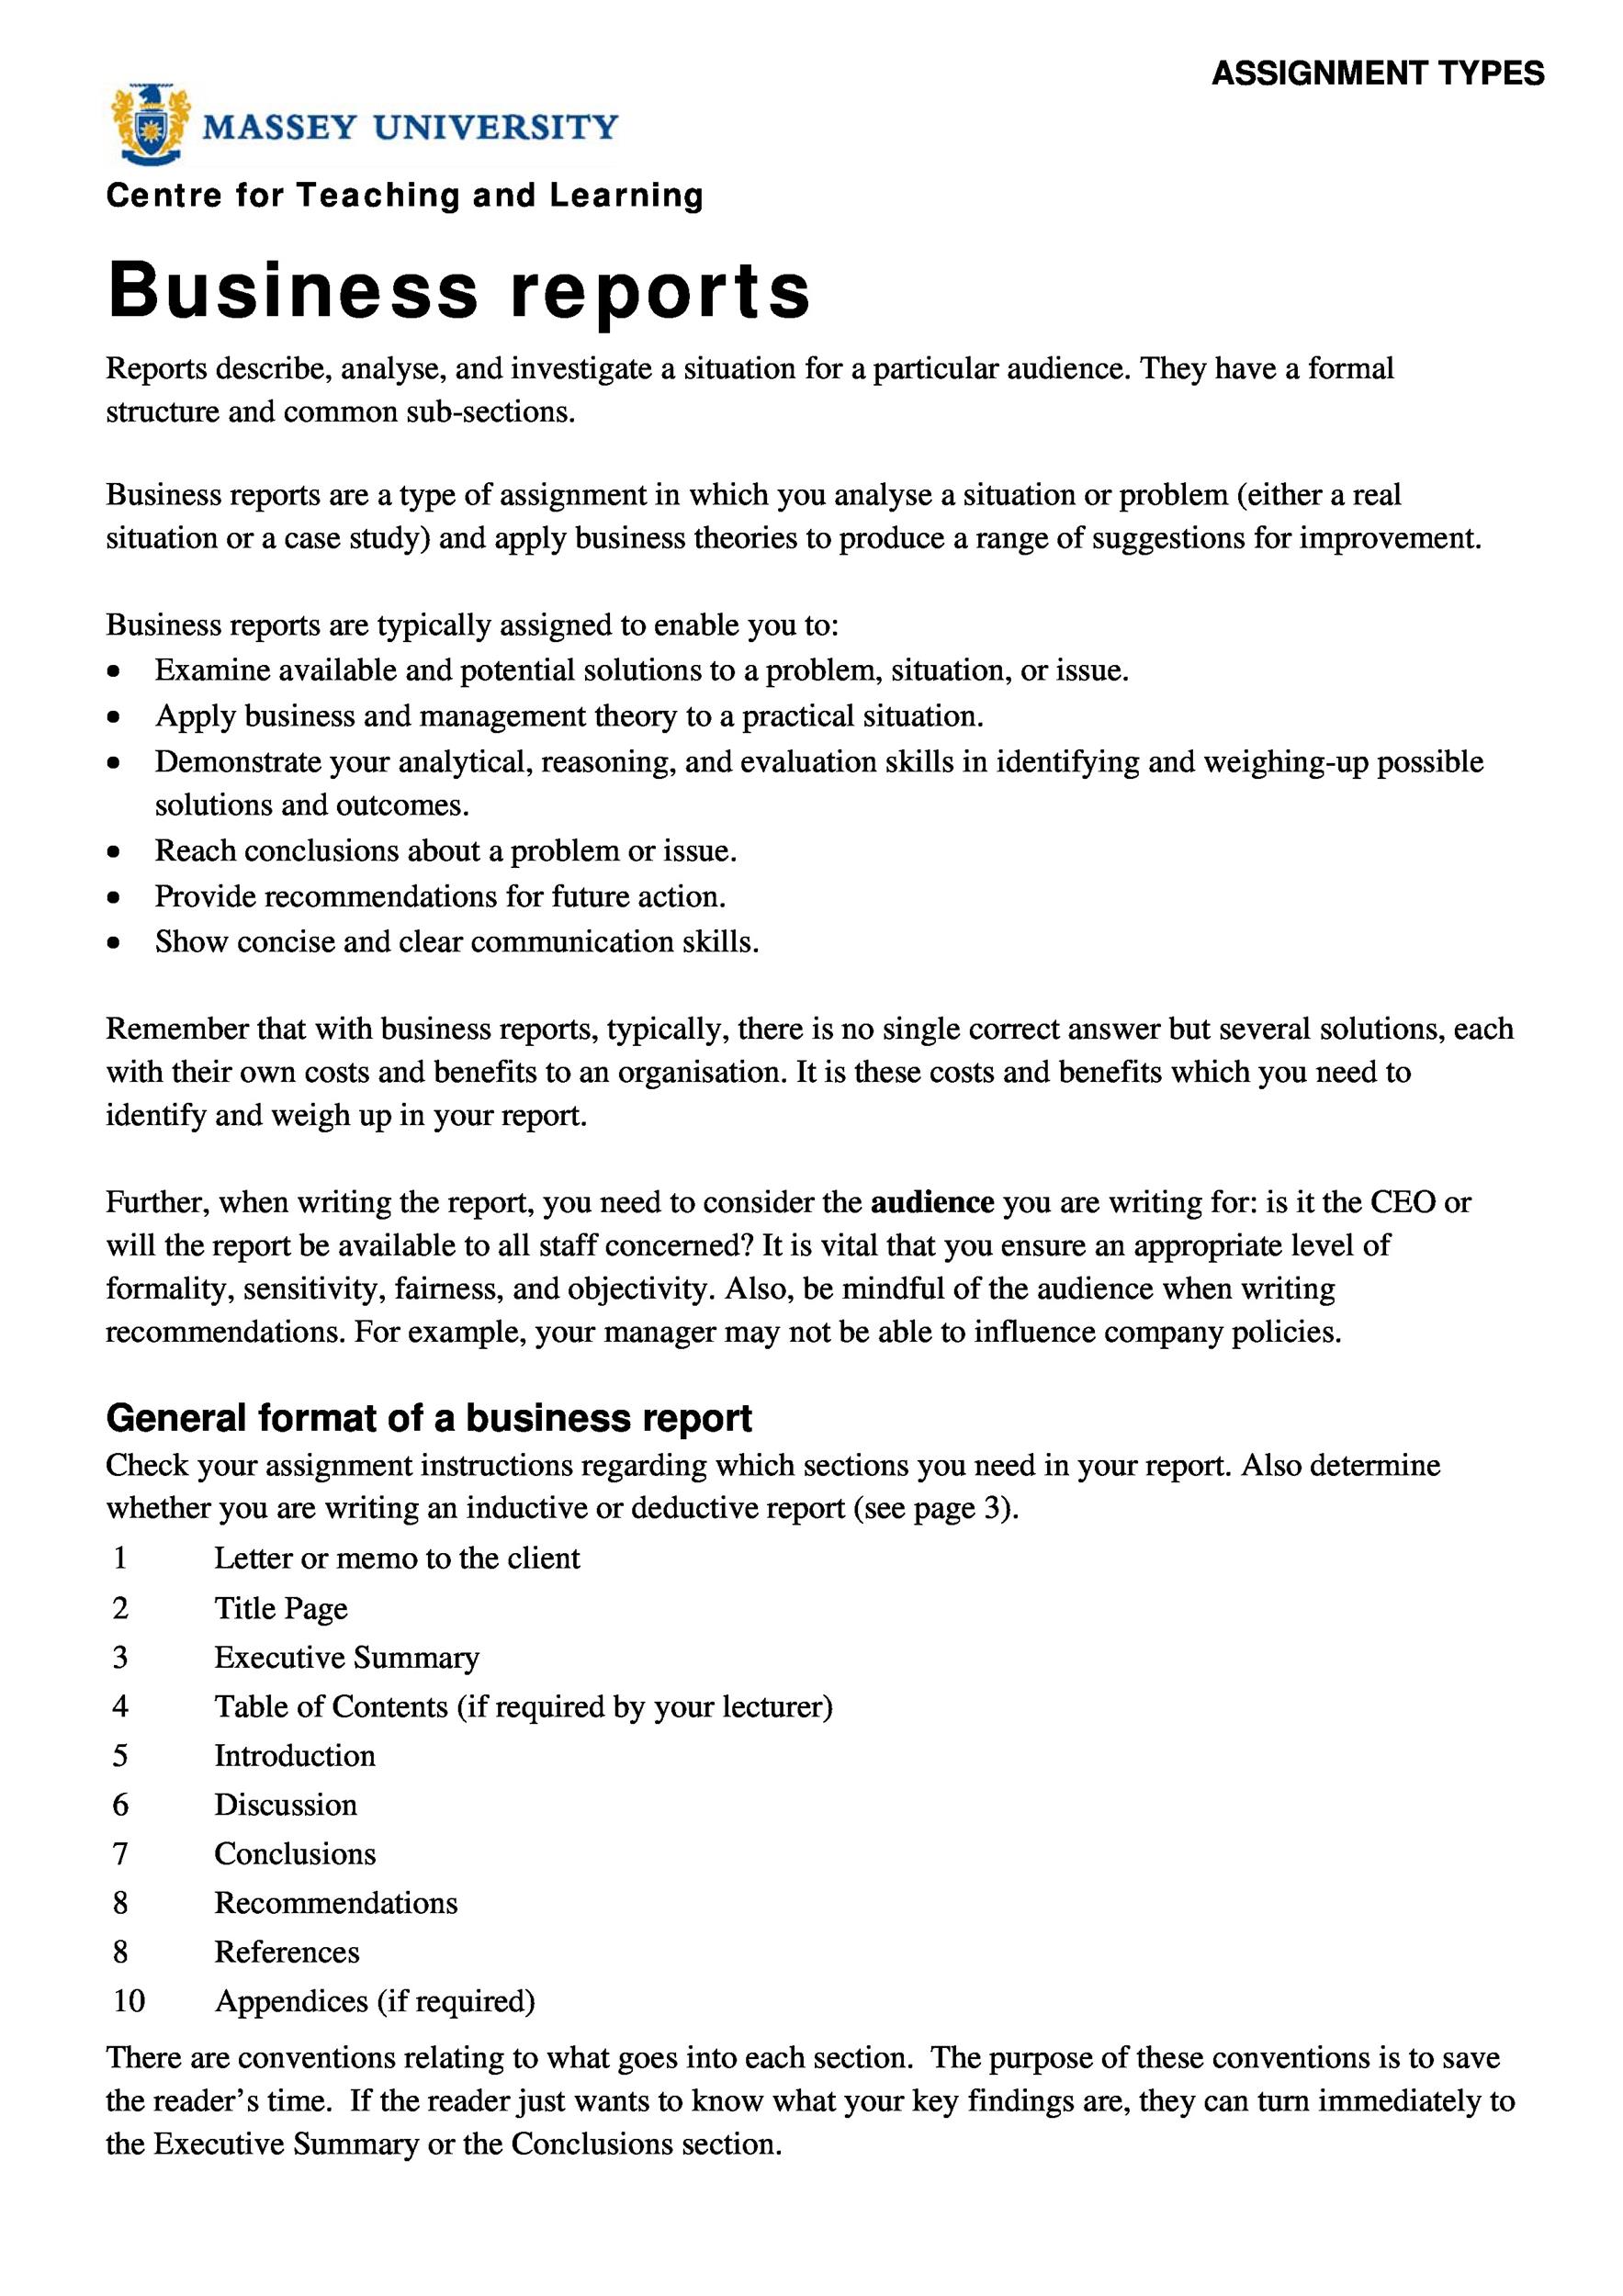
Introduction
Set the stage by briefly explaining the purpose, scope, and context of the report. Humor is welcome—just keep it relevant and professional. For instance, “We were tasked with solving the mystery of the disappearing coffee mugs in the office,” can lighten the mood while staying on point.
Body Sections
Break the content into clear sections. Each section should answer a specific question or present a distinct piece of data. Use sub‑headings, bullet lists, and charts to make information easy to scan. Example sub‑headings: “Methodology,” “Findings,” “Analysis,” and “Implications.”
Conclusion and Recommendations
Wrap up by summarizing key insights and suggesting concrete actions. End with a call to action that feels urgent yet friendly, like “Let’s roll this plan into action and watch the results bloom.”
Appendices and References
Attach raw data, detailed calculations, or supplementary information in an appendix. Cite all sources using a consistent format—APA, MLA, or whatever your organization prefers—so your credibility stays intact.
Step‑by‑Step Guide to Building Your Template
Choose the Right Tool
Pick a platform you’re comfortable with: Word, Google Docs, LaTeX, or even Canva for a visual twist. The key is a tool that supports styles, bookmarks, and easy formatting.
Sketch the Layout
Start with a rough pencil sketch or digital mockup. Decide where the title goes, where the header will appear, and how many columns you want. A one‑column layout keeps things simple, while two columns add visual interest for longer documents.
Decide on Font Pairings
Choose one serif font for headings and one sans‑serif for body text. Pairing fonts like Garamond (headings) with Arial (body) creates contrast without clashing. Keep the font size between 10‑12 pt for body text to maintain readability.
Add Color and Branding
Use your brand colors sparingly—just a splash on headings or borders. Too many colors can overwhelm. If you’re unsure, default to grayscale and reserve color for call‑out boxes or charts.
Insert Placeholder Content
Placeholders are lifesavers. Use Lorem ipsum or short sample sentences to indicate where to put titles, bullet lists, tables, and figures. This helps you see the flow before you start filling in real data.
Test with Real Data
Populate the template with actual content. Verify that headings update correctly, page numbers shift, and the table of contents reflects changes. Test on different devices if you’ll share digitally to ensure consistency.
Export and Share
Save the final document in both editable and PDF formats. PDFs preserve layout across devices, while the editable version lets future team members tweak content. Always keep a master copy to avoid version chaos.
Common Pitfalls and How to Avoid Them
Too Much Text, Not Enough White Space
White space is not wasted space. It improves readability and reduces eye strain. Leave margins wide, use line spacing of 1.15 to 1.5, and break up long paragraphs into bite‑size chunks.
Inconsistent Headings
Uniform heading styles ensure that the table of contents and internal navigation work correctly. Use the built‑in heading styles in your word processor rather than manually formatting each heading.
Neglecting Accessibility
Include alt text for images, use descriptive headings, and avoid color‑only cues. This makes your report usable by screen readers and people with visual impairments.
Forgetting the Audience
Write with your reader’s knowledge level in mind. If the report is for executives, keep technical jargon minimal and focus on outcomes. If it’s for peers, include detailed methodology and data.
Real‑World Examples of Awesome Report Templates
Business Analysis Report
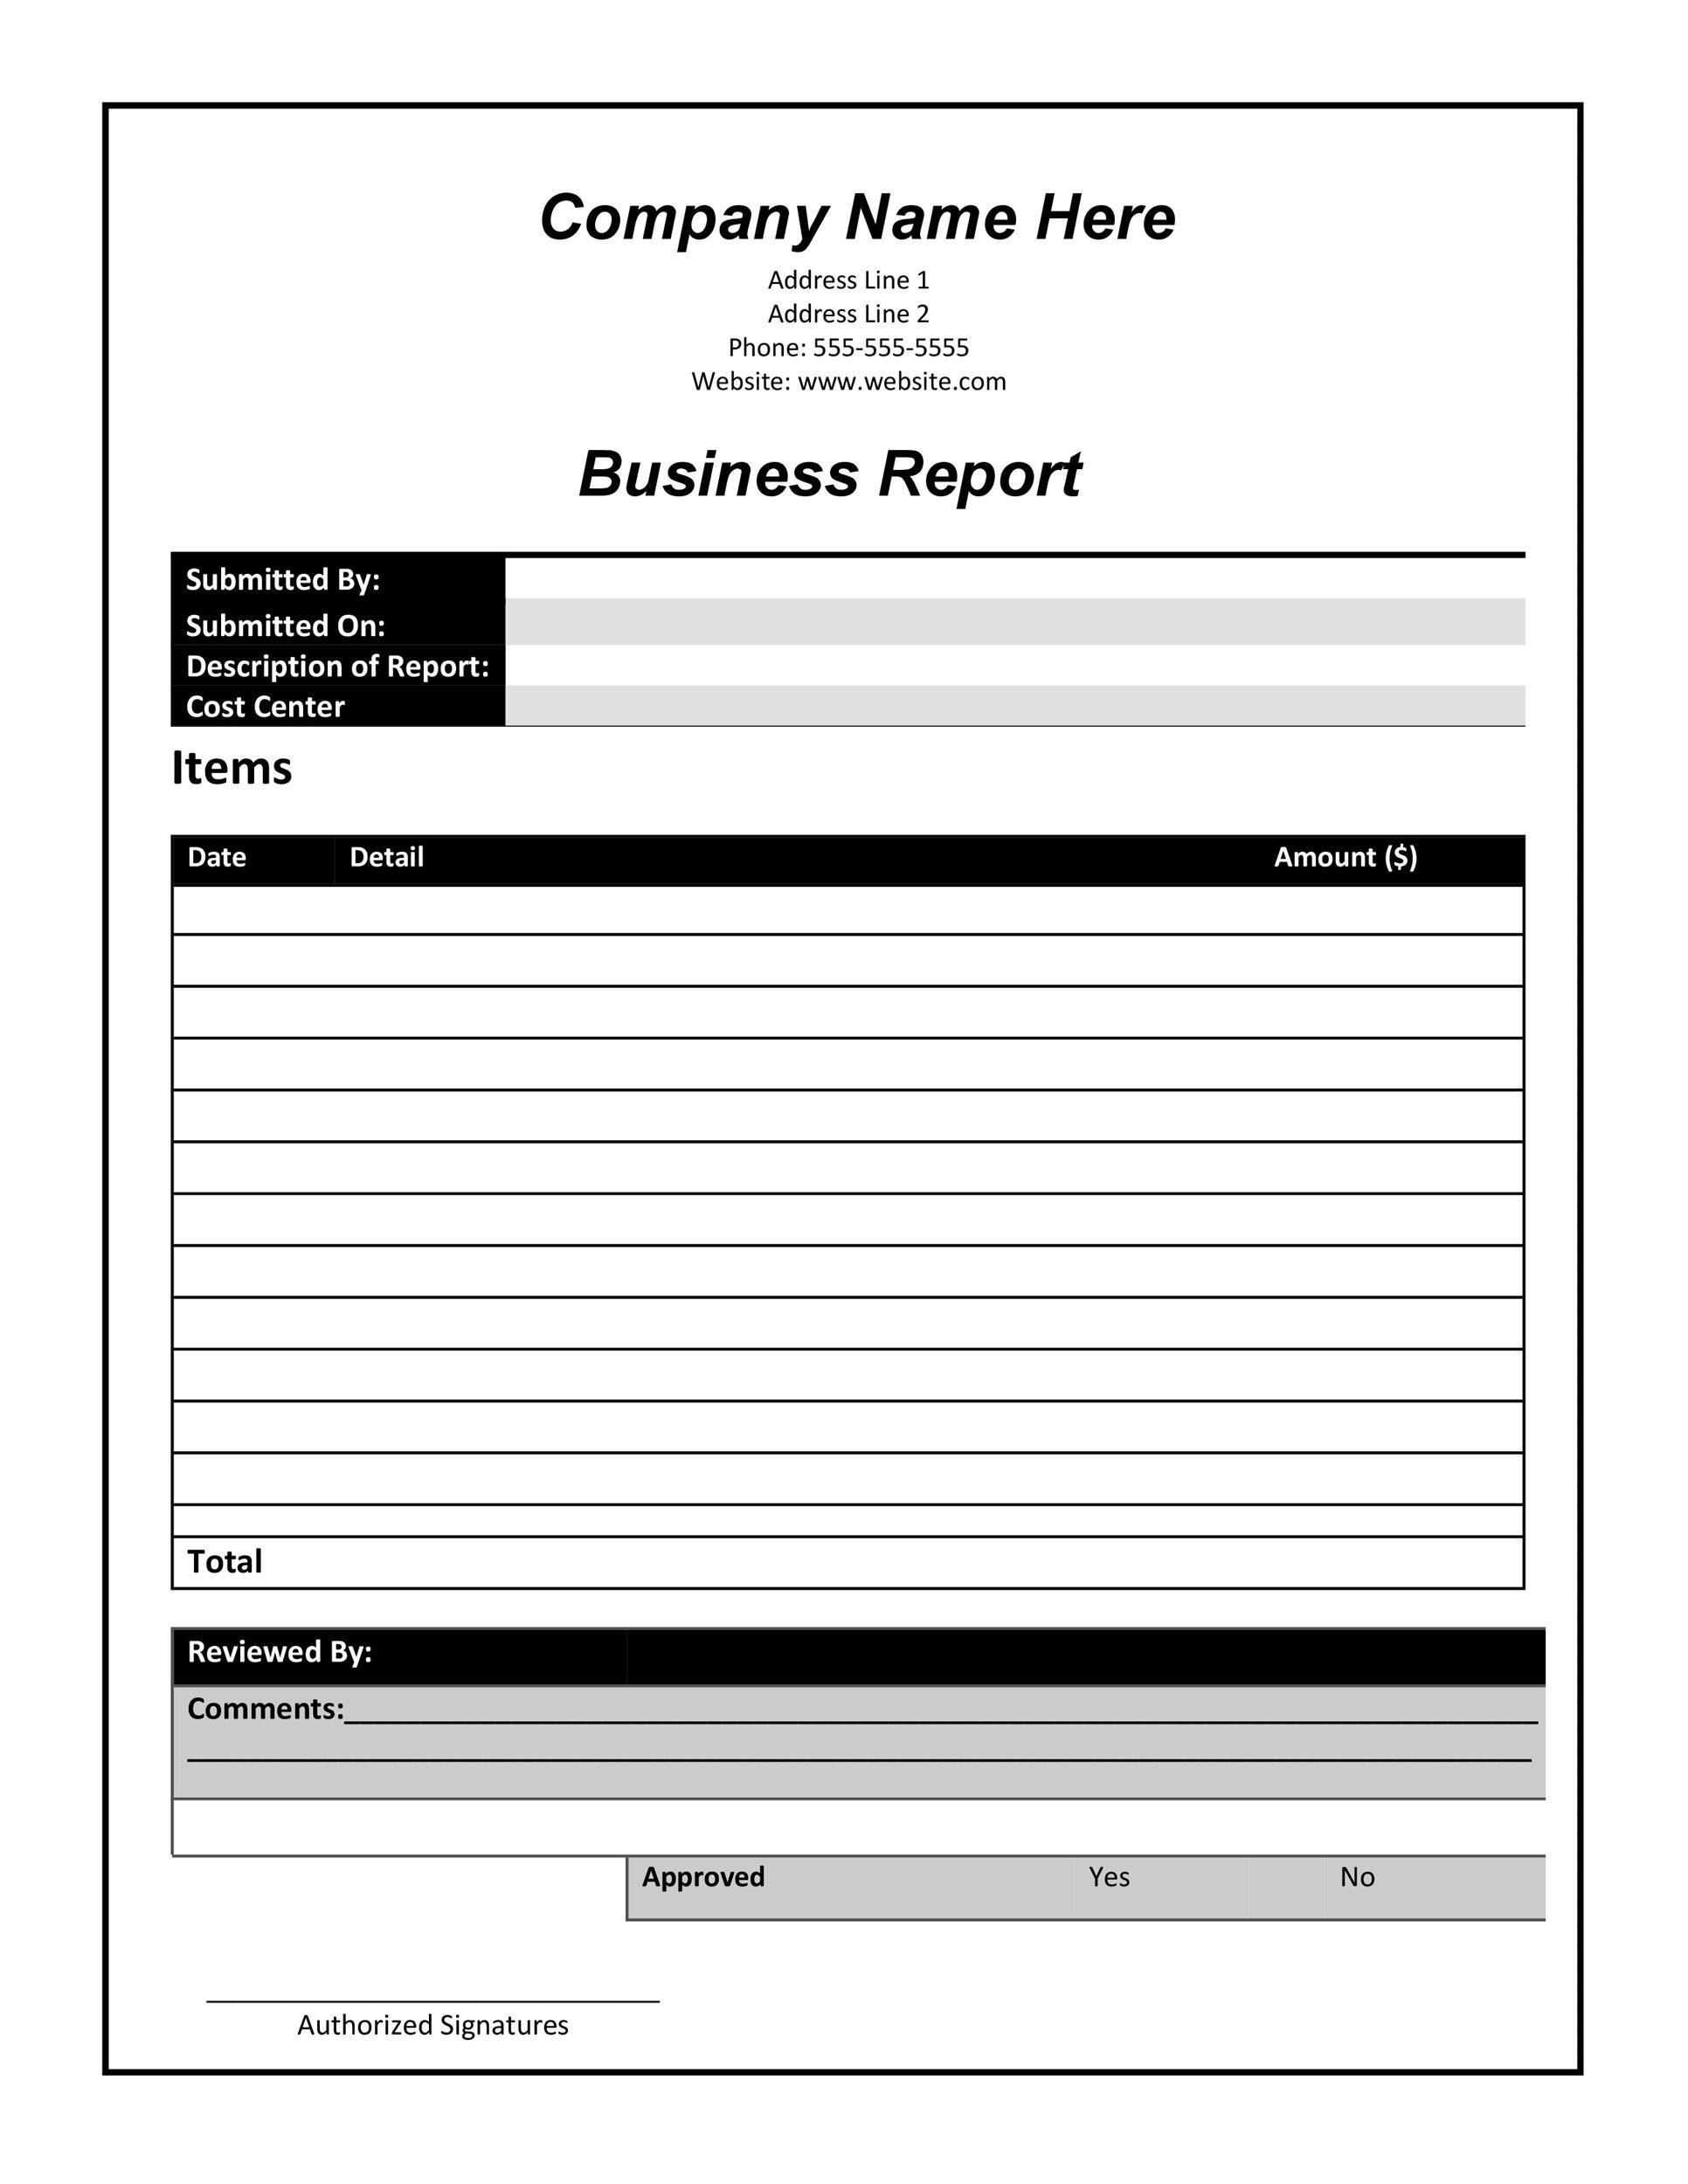
Feature a clean header with a company logo, an executive summary with bullet highlights, and a SWOT analysis table. Include charts that illustrate financial trends and a clear call to action for next steps.
Academic Research Report
Use a formal layout with a title page, abstract, literature review, methodology, results, discussion, and references. Incorporate figures and tables that are labeled and referenced in the text.
Technical Design Document
Divide the report into sections like “System Overview,” “Architecture Diagrams,” “API Specifications,” and “Testing Strategy.” Use code blocks, sequence diagrams, and UML charts to illustrate technical details.
Marketing Campaign Report
Begin with campaign objectives, then present metrics such as ROI, conversion rates, and audience demographics. Use heat maps, funnel charts, and a recommendation section to guide future campaigns.
Final Thoughts

Crafting a report is part science, part art, and part comedy when you embrace a playful yet professional tone. By mastering the essential components, following a systematic template‑building process, and sidestepping common mistakes, you’ll produce documents that inform, persuade, and entertain—all while keeping your audience’s eyes glued to the page. Remember, the best report isn’t just about the data; it’s about how the data tells a story that resonates with the reader. Armed with these strategies, you’re ready to turn any reporting task into a triumphant showcase of clarity, creativity, and a dash of humor. Happy reporting!


Related posts of "Template On How To Write A Report"
