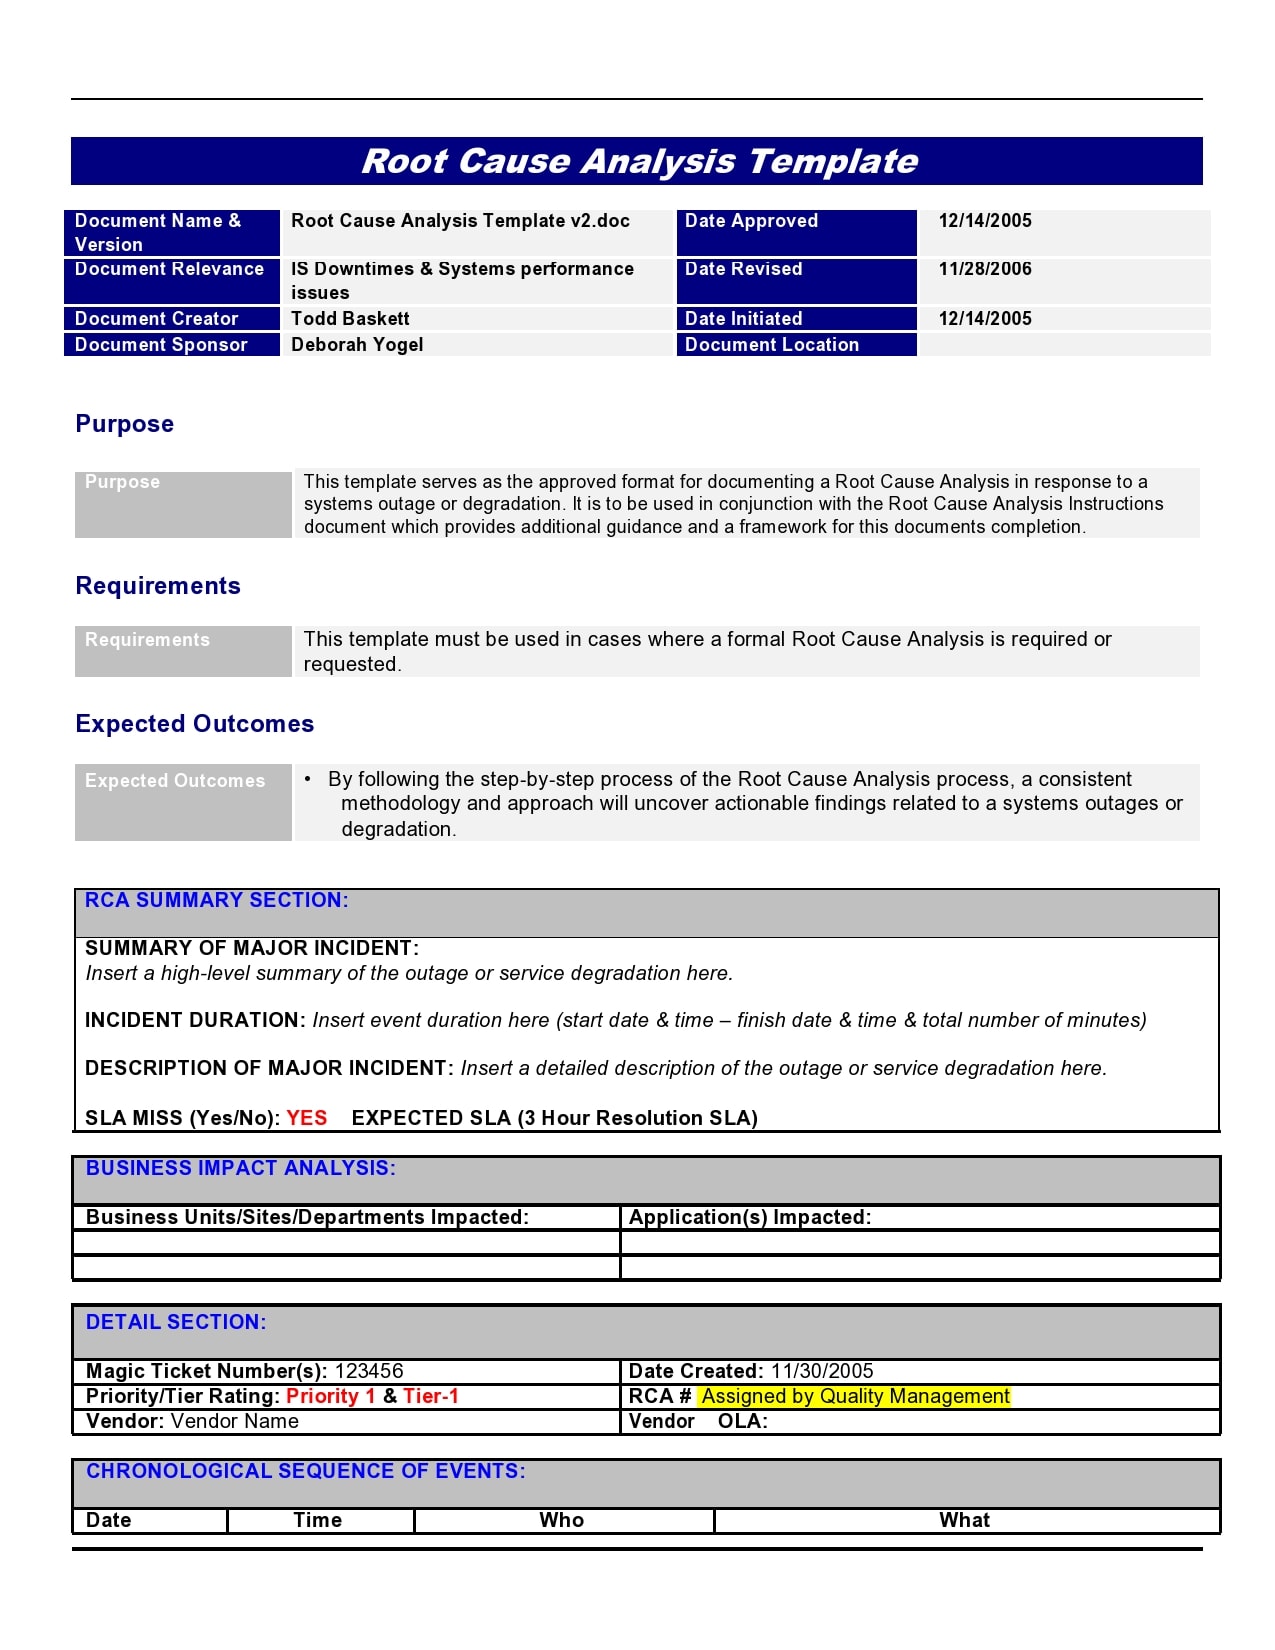
Example Root Cause Analysis Report Template is more than just a form; it’s a roadmap that turns confusion into clarity, helping teams dig deep into problems and surface sustainable solutions. When I first saw one of these templates, I was skeptical—could a simple document really change the trajectory of a failing project? I’ve spent years refining this tool and I’m excited to share how it can transform your troubleshooting process.
Why Root Cause Analysis Matters
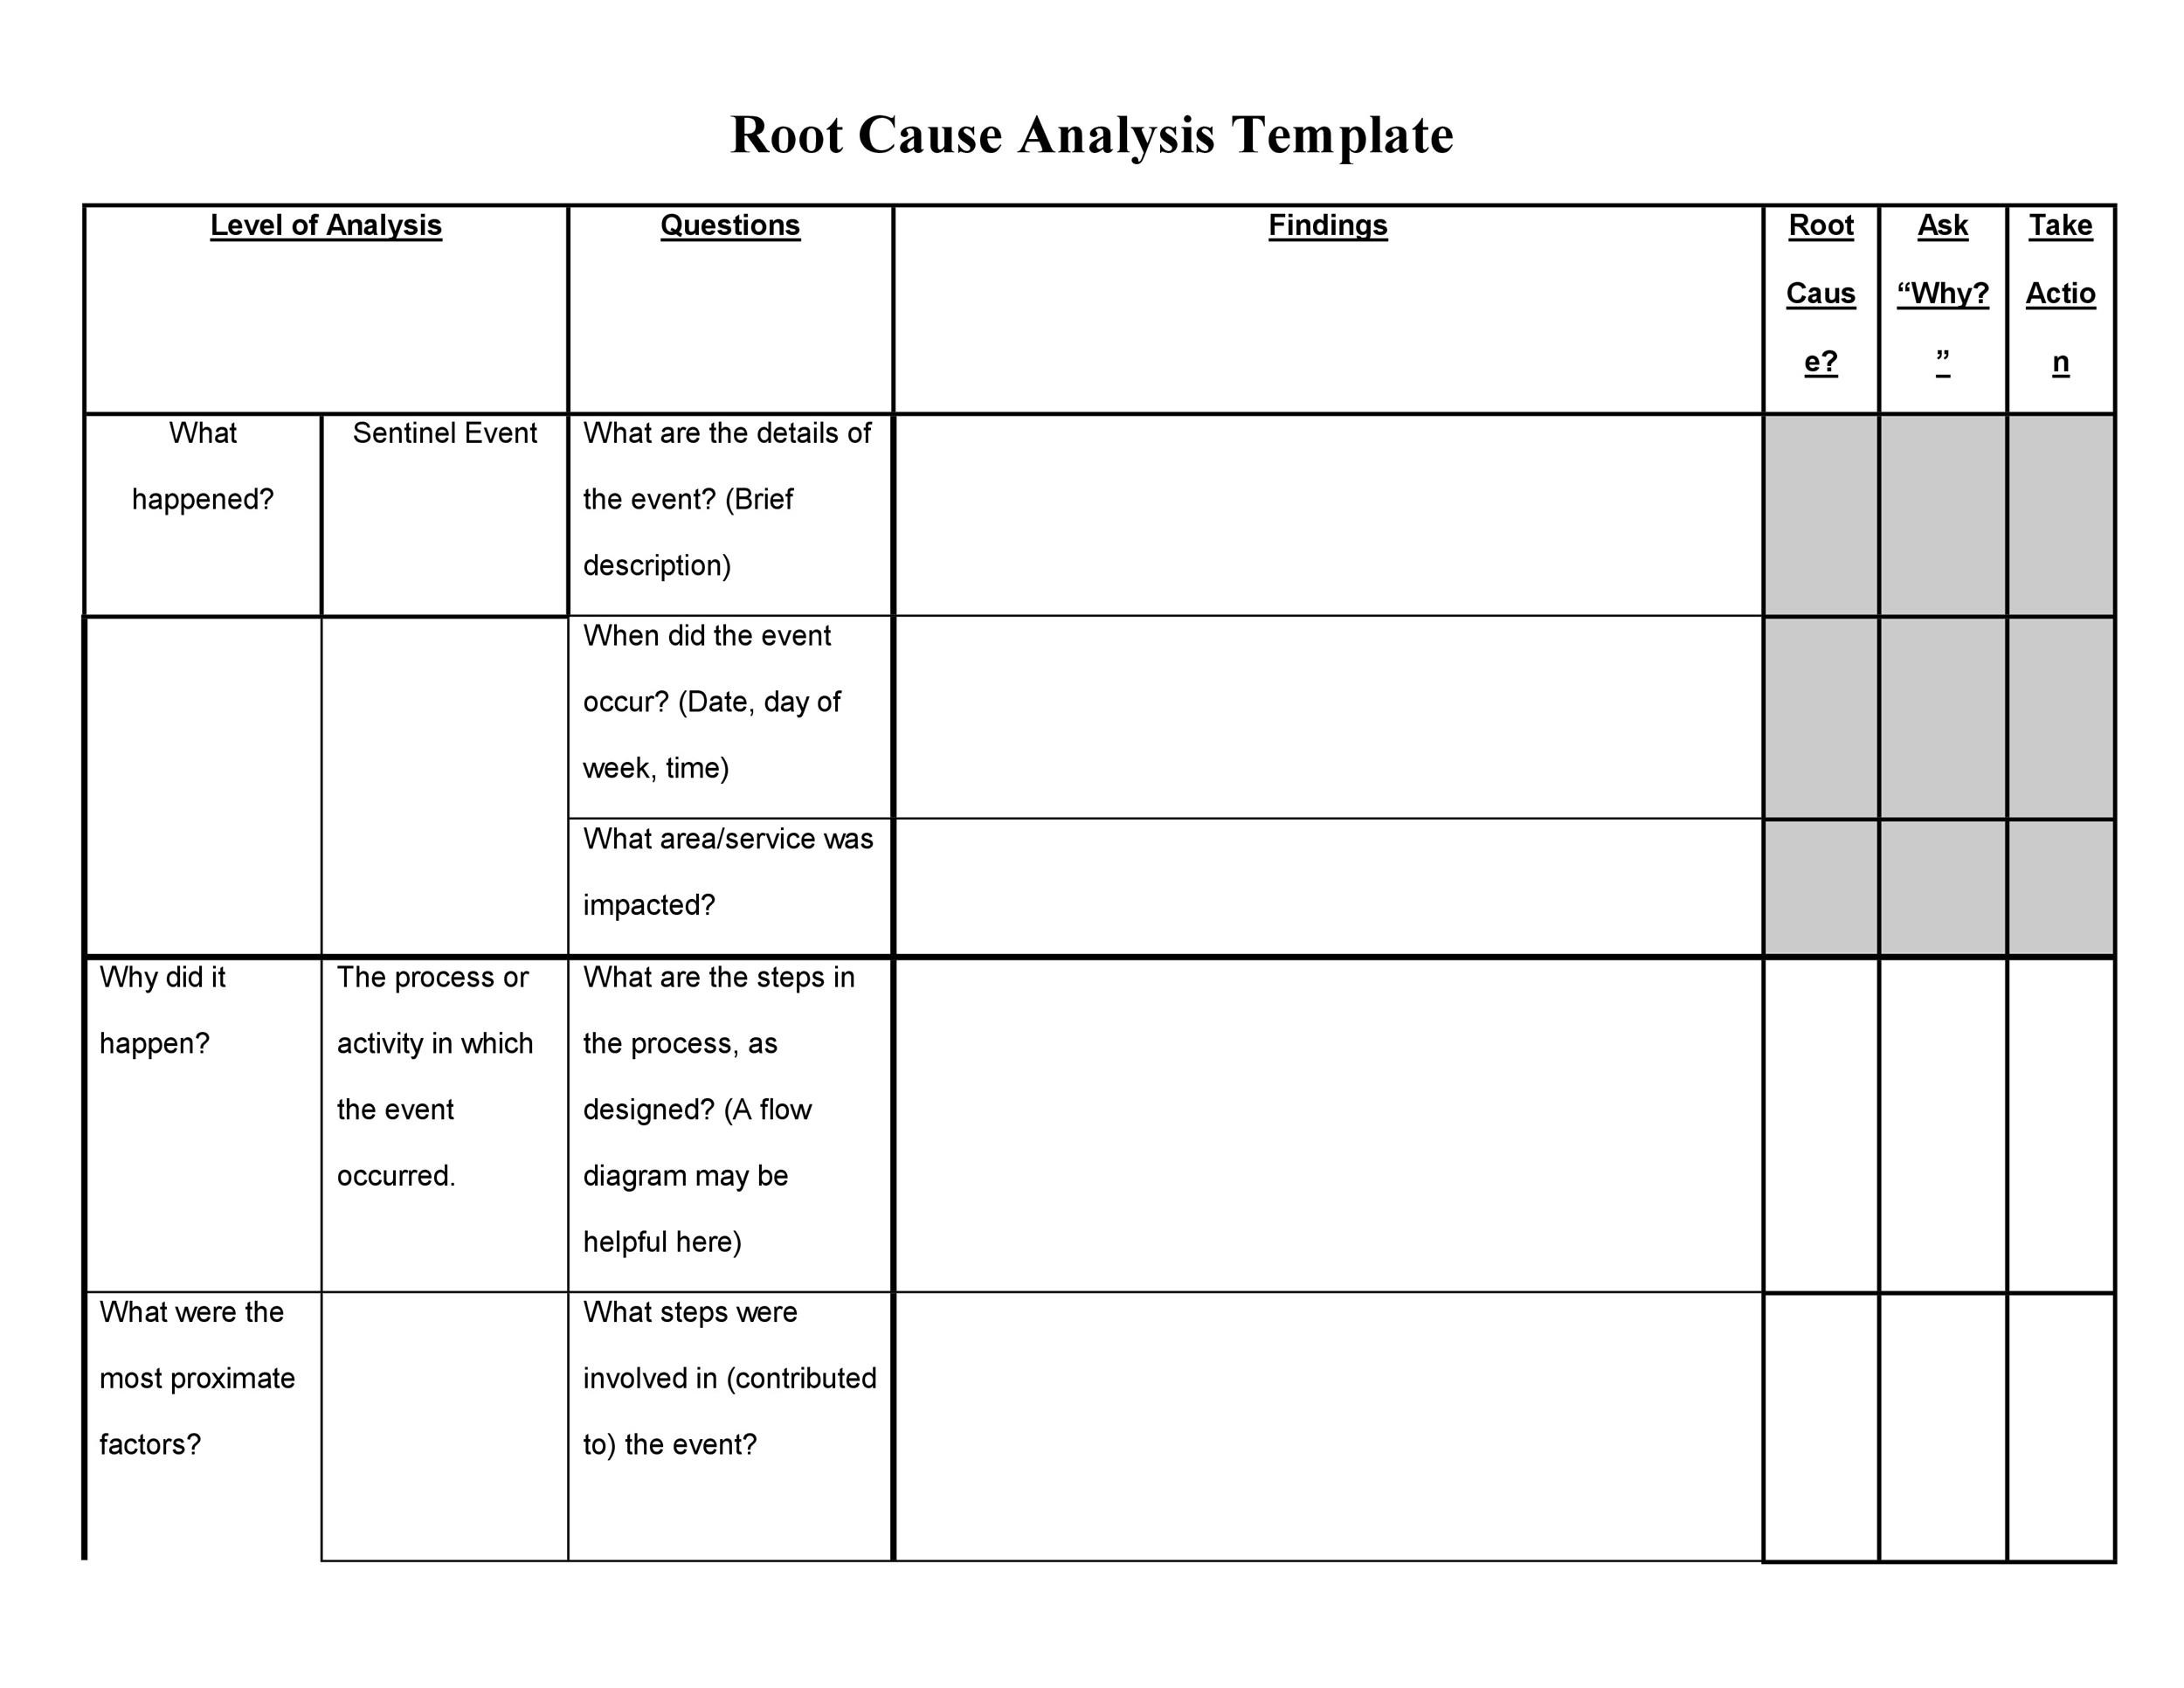
Every organization faces hiccups—missed deadlines, product defects, or customer complaints. While quick fixes can calm the immediate storm, they rarely address the underlying fault. Root Cause Analysis (RCA) forces you to stop the band-aid mentality and ask the hard question: “Why did this happen?” By answering that, you unlock the power to prevent recurrence, improve processes, and boost confidence across teams.
The Business Case
- Cost Reduction: Eliminating recurring issues saves money on rework, warranty claims, and downtime.
- Risk Mitigation: Understanding root causes reduces exposure to regulatory fines and reputational damage.
- Continuous Improvement: RCA feeds into Kaizen and Six Sigma initiatives, creating a culture of perpetual learning.
Anatomy of a Robust Root Cause Analysis Report
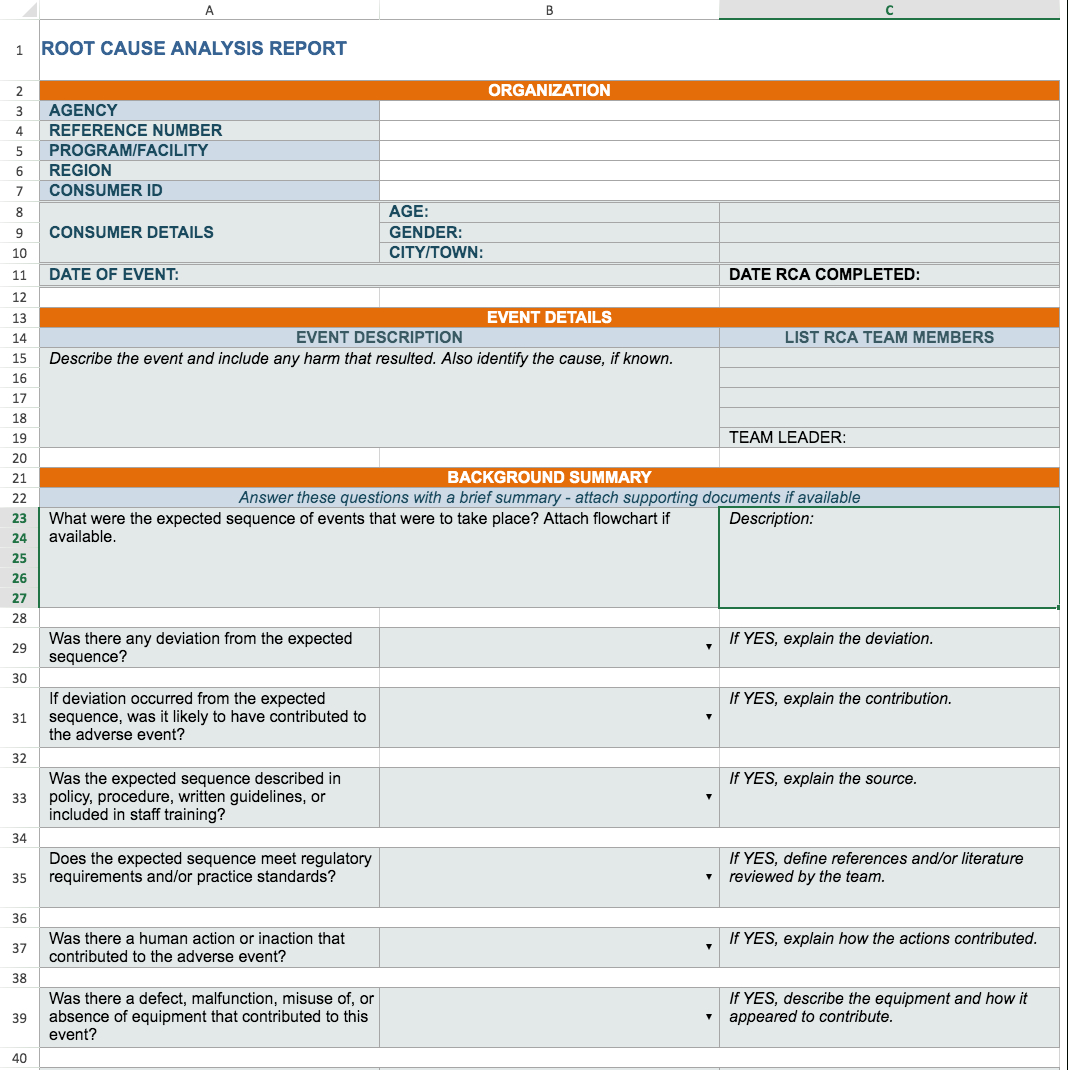
A well‑structured RCA report follows a predictable flow, making it easier for stakeholders to digest insights and take action. Below is a quick map of the core sections you’ll find in the example template.
1. Incident Overview
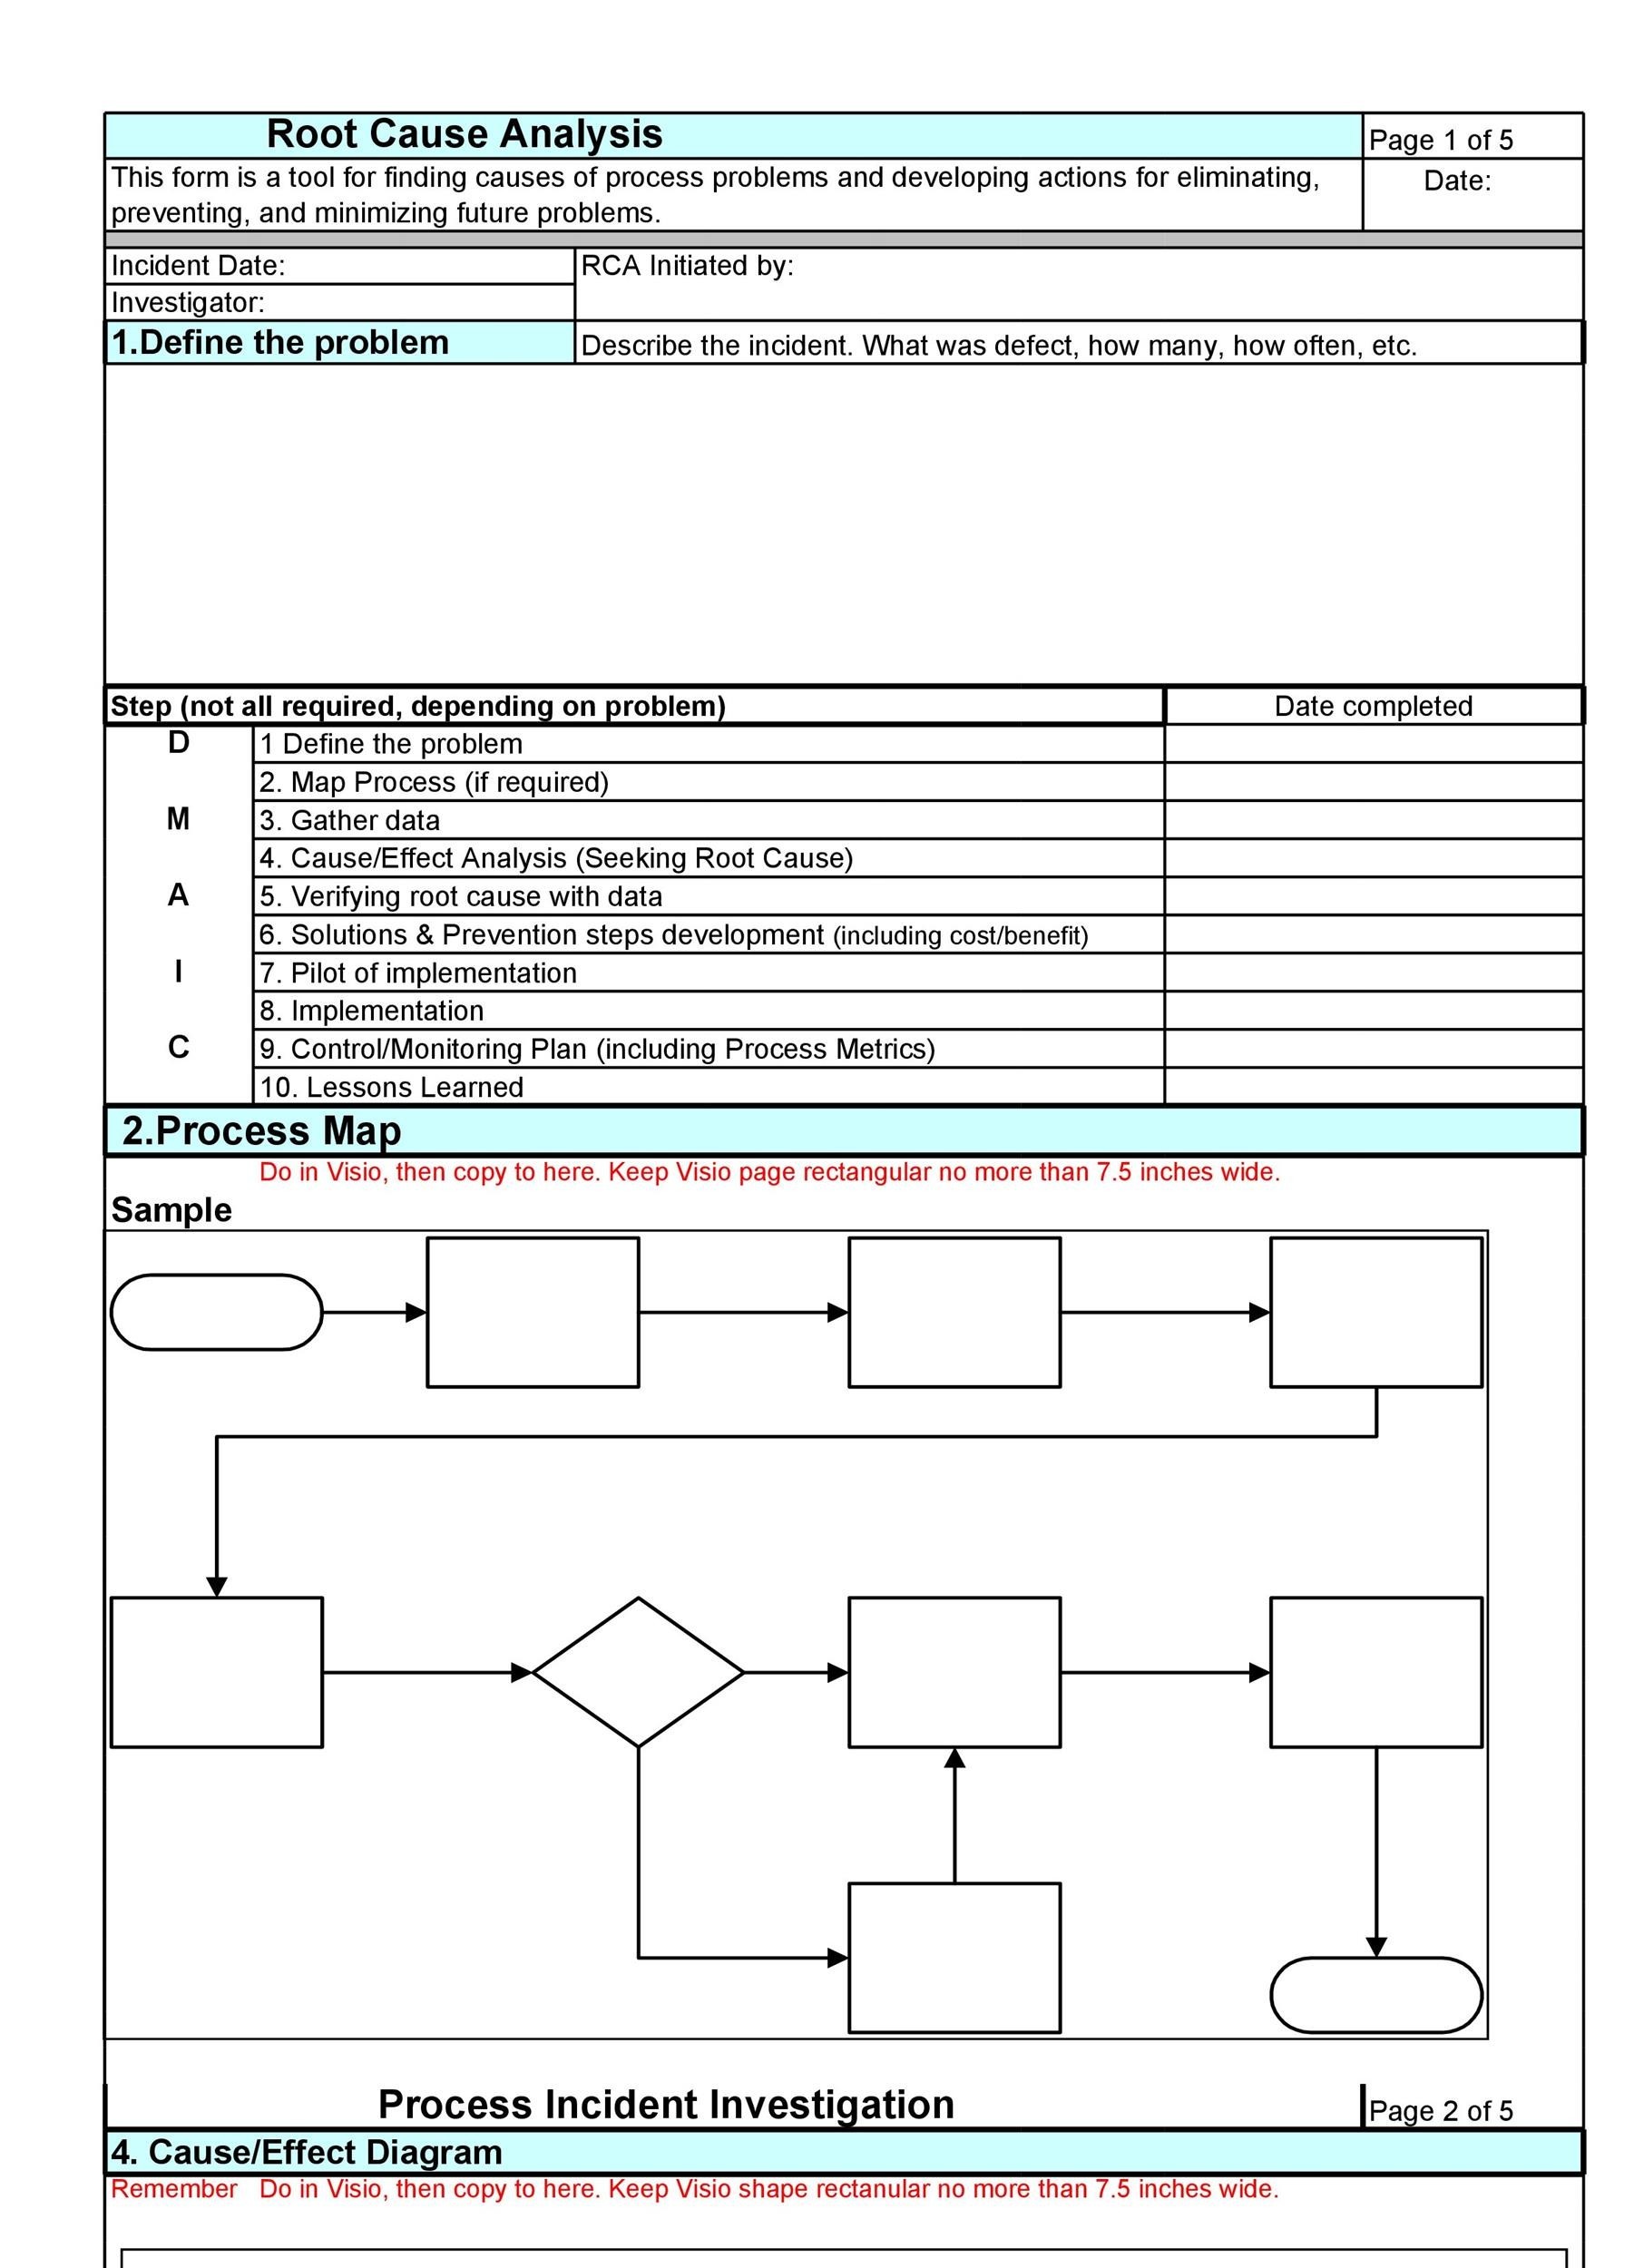
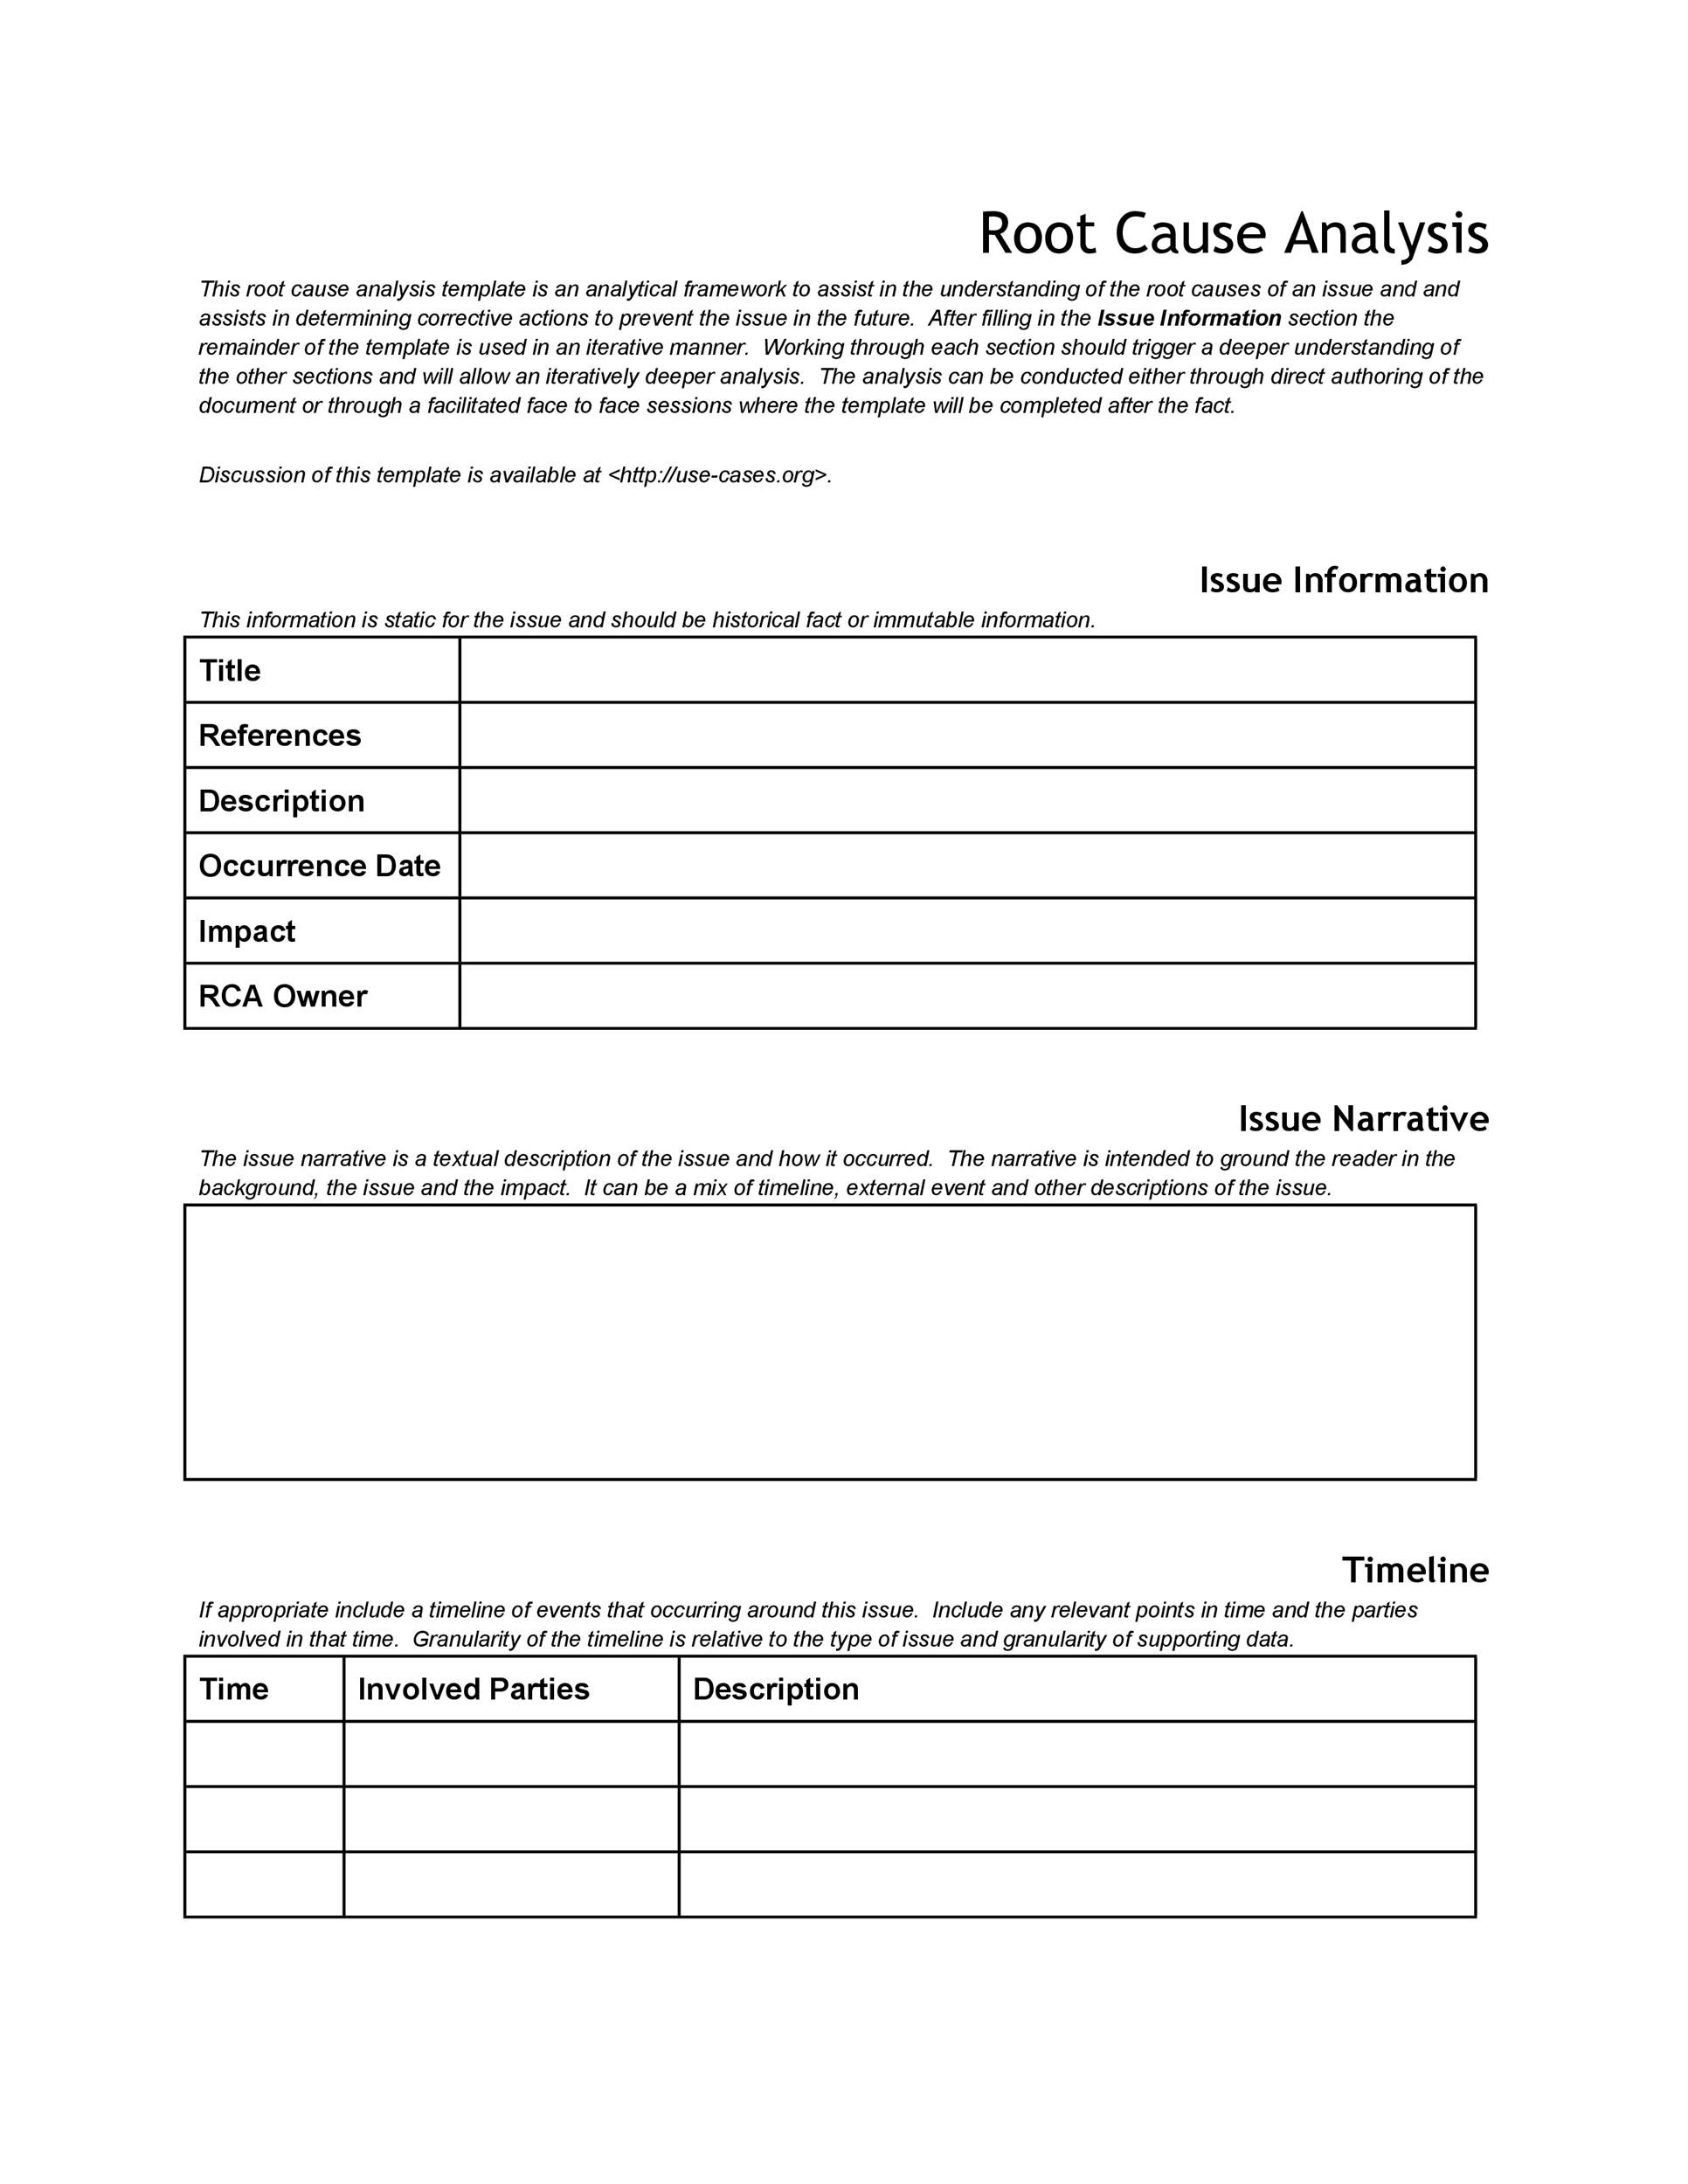
Start with a concise description—what happened, where, when, and who was impacted. Adding a timeline or event sequence clarifies context for readers who weren’t on the front lines.
2. Problem Statement
Frame the issue in business terms. “Product X consistently fails the pressure test at 4.5 bar, causing a 12% increase in warranty claims.” A clear problem statement keeps the investigation laser‑focused.
3. Data & Evidence
Compile logs, sensor readings, customer tickets, or inspection reports. Visuals like charts or photos help convey the magnitude and patterns of the problem.
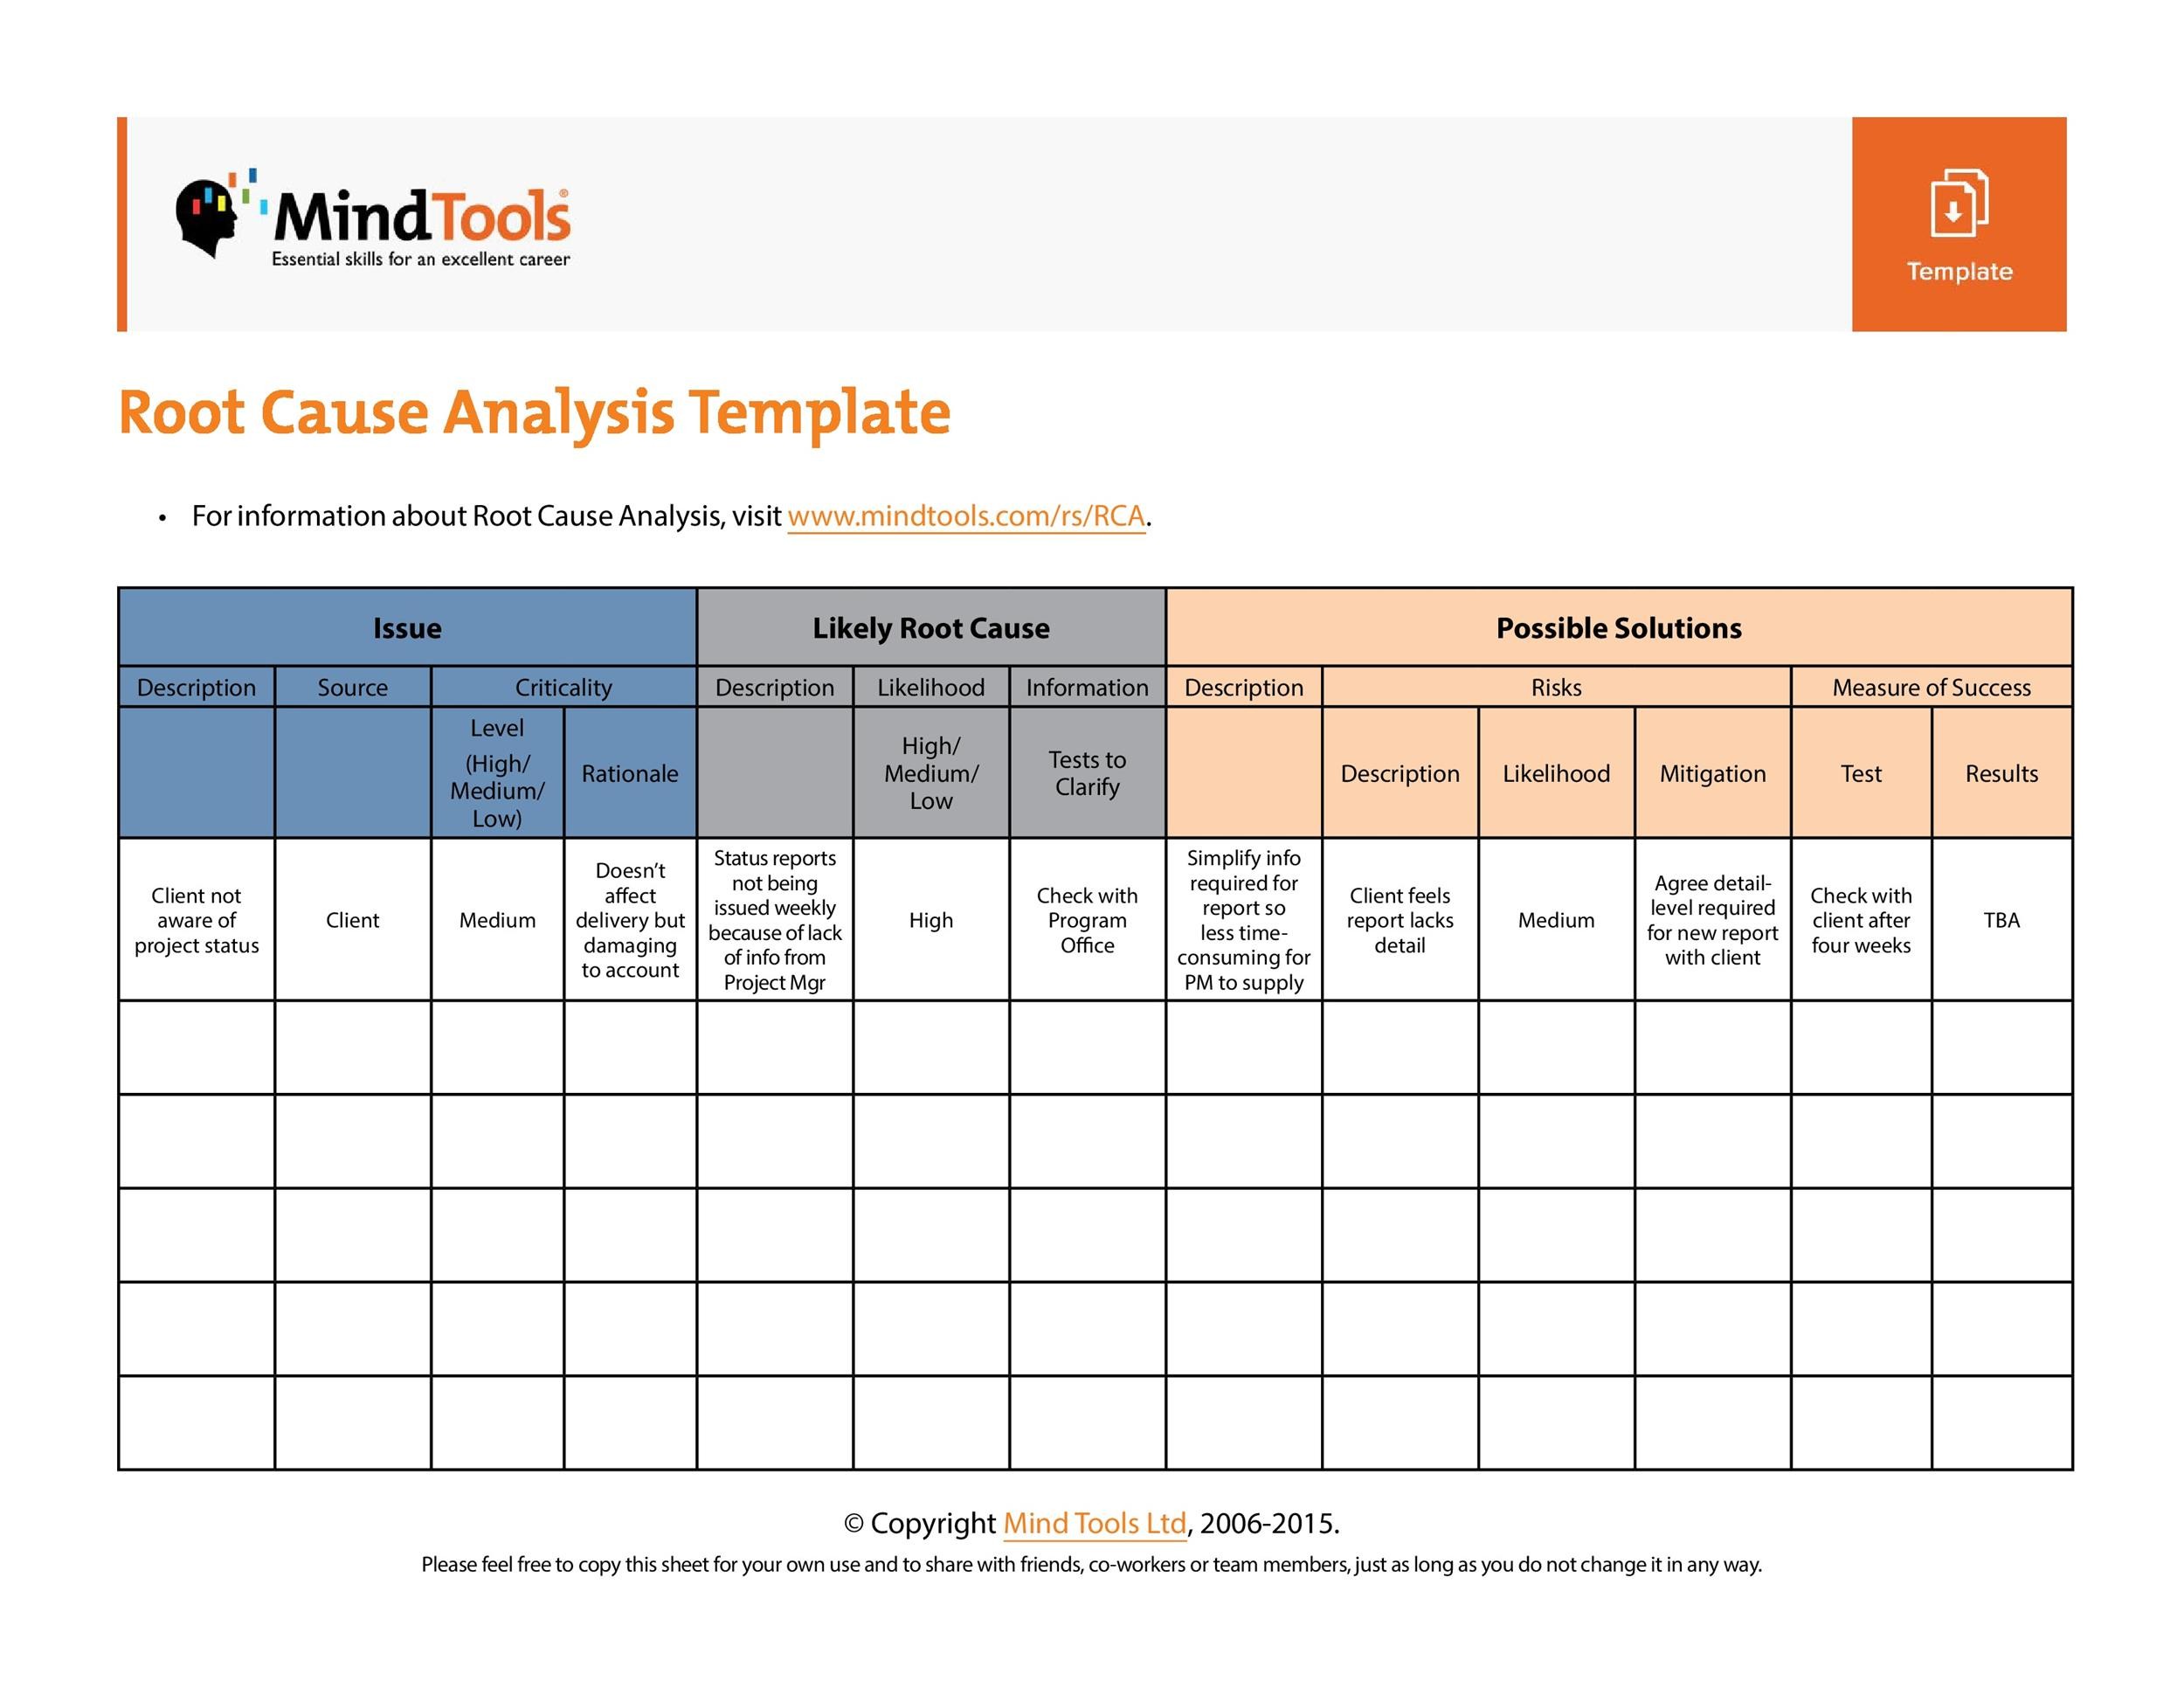
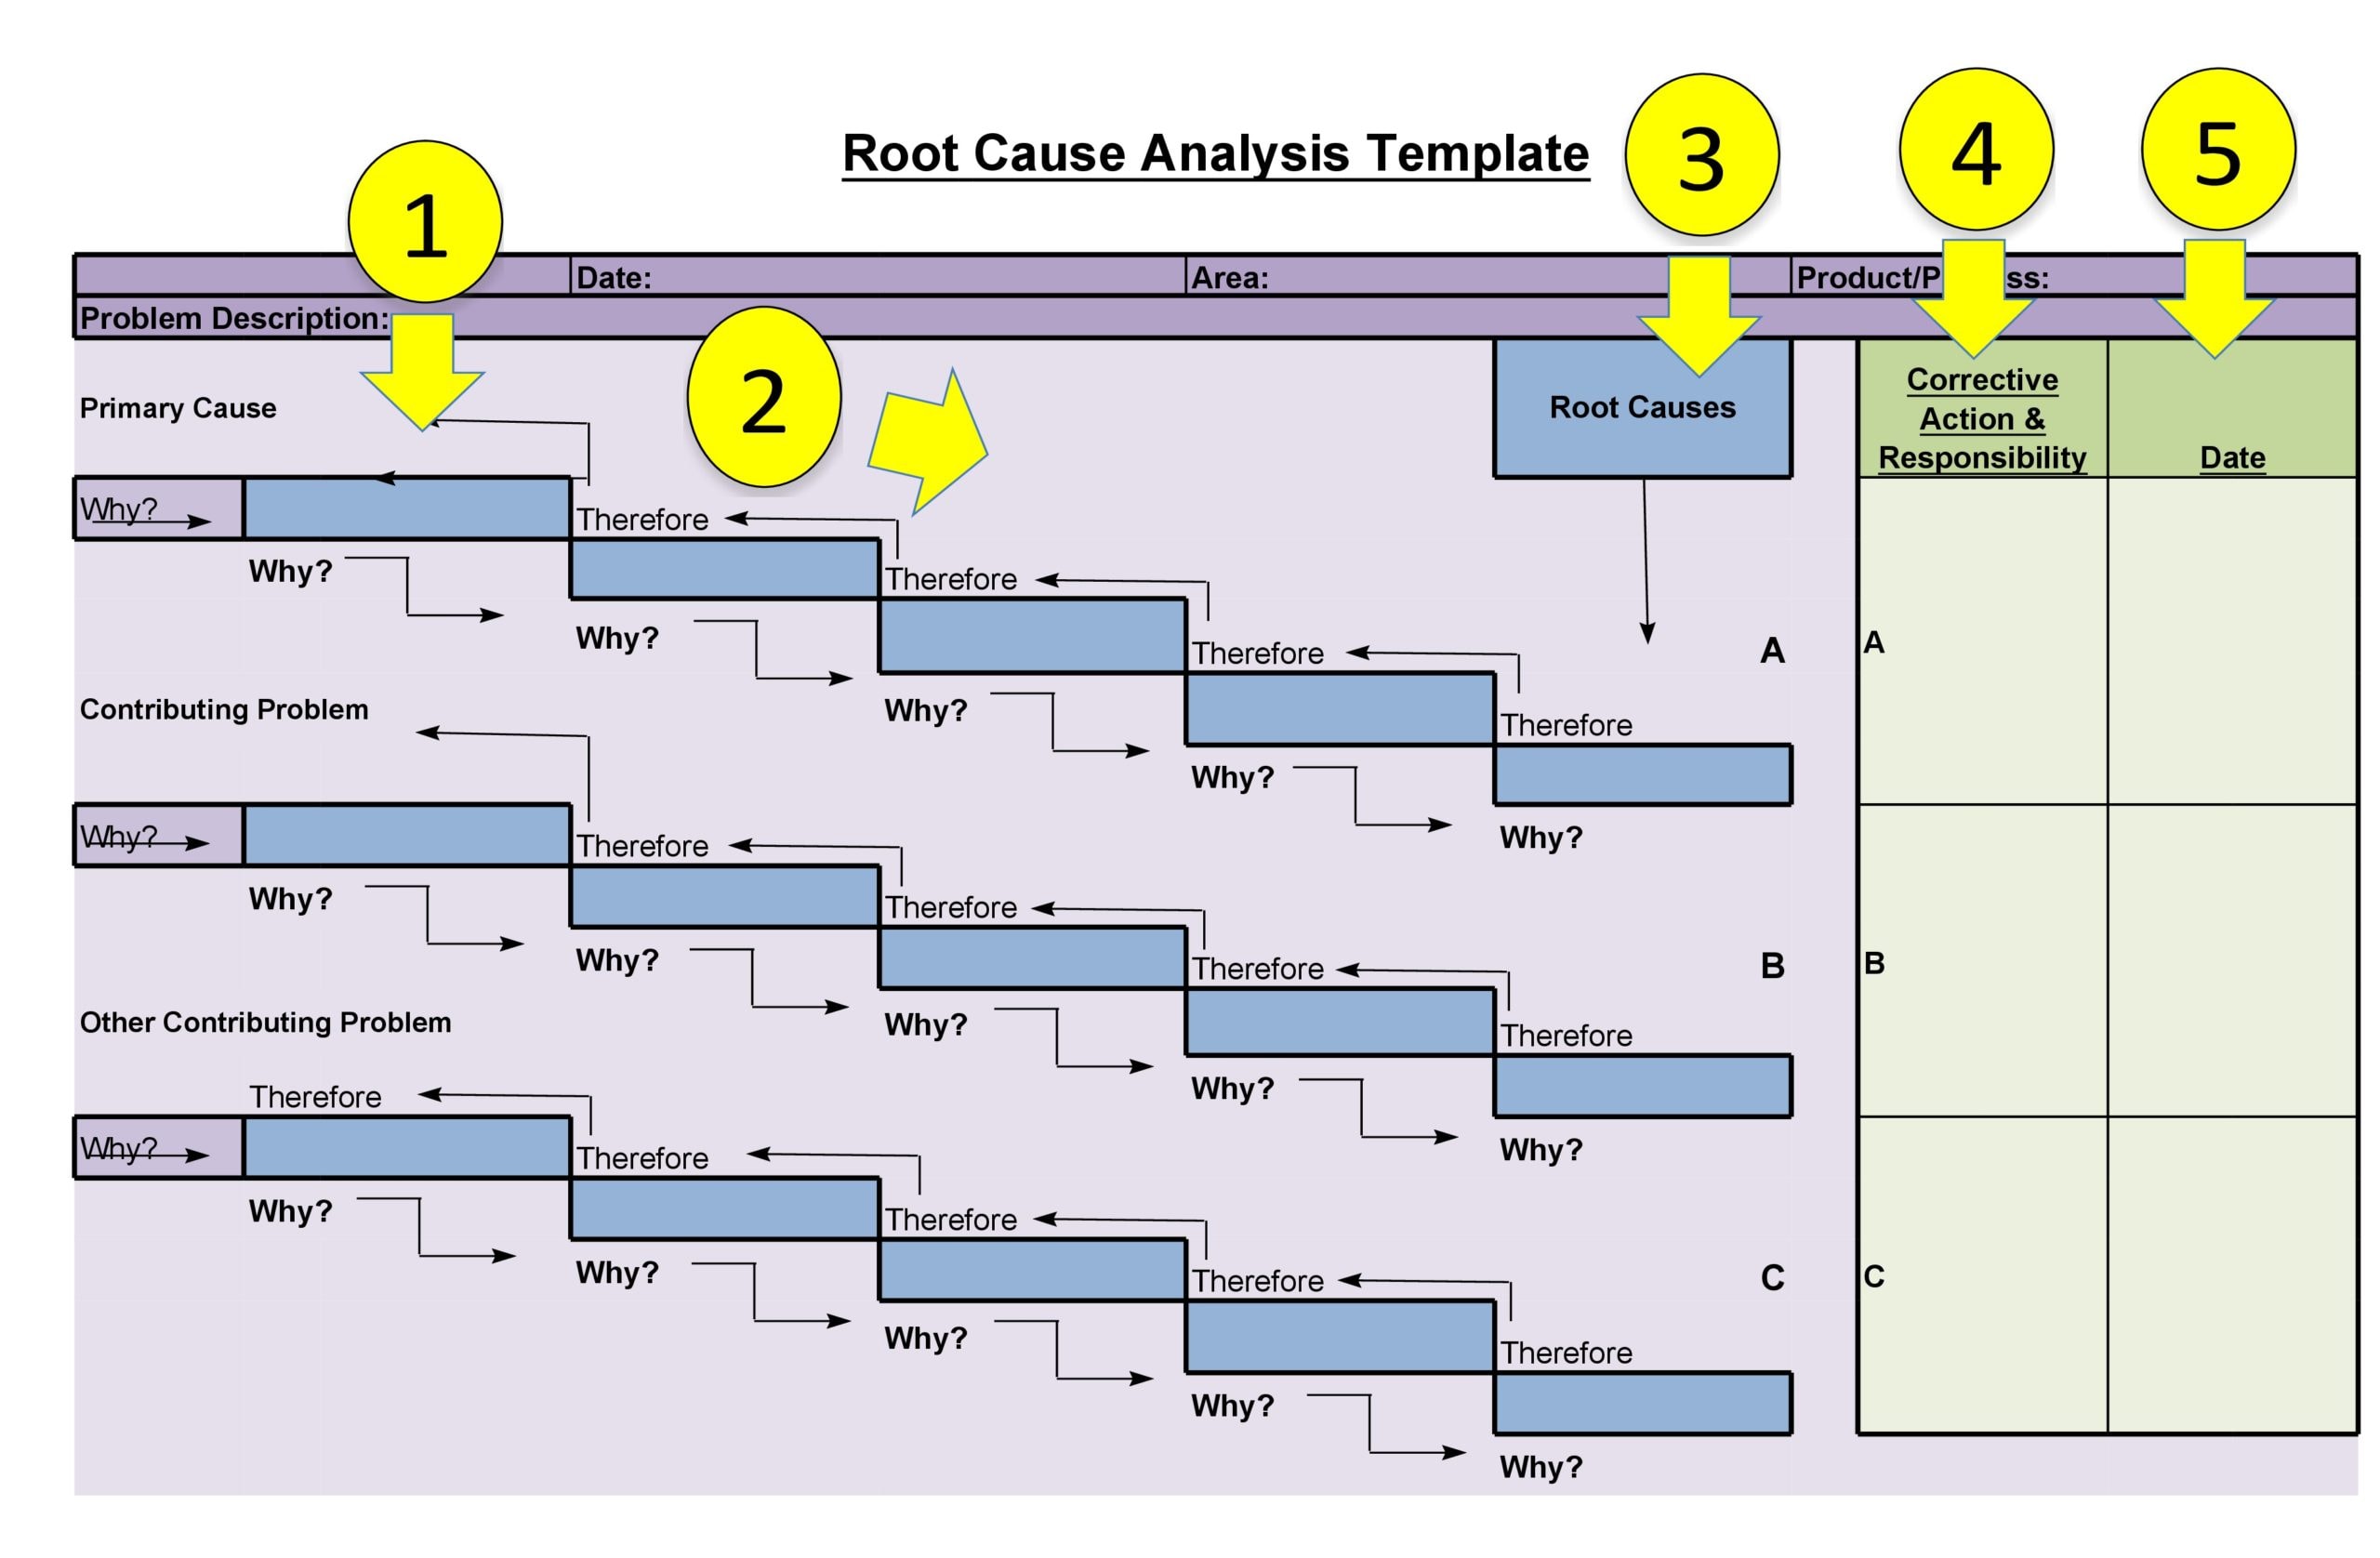
4. Root Cause Identification
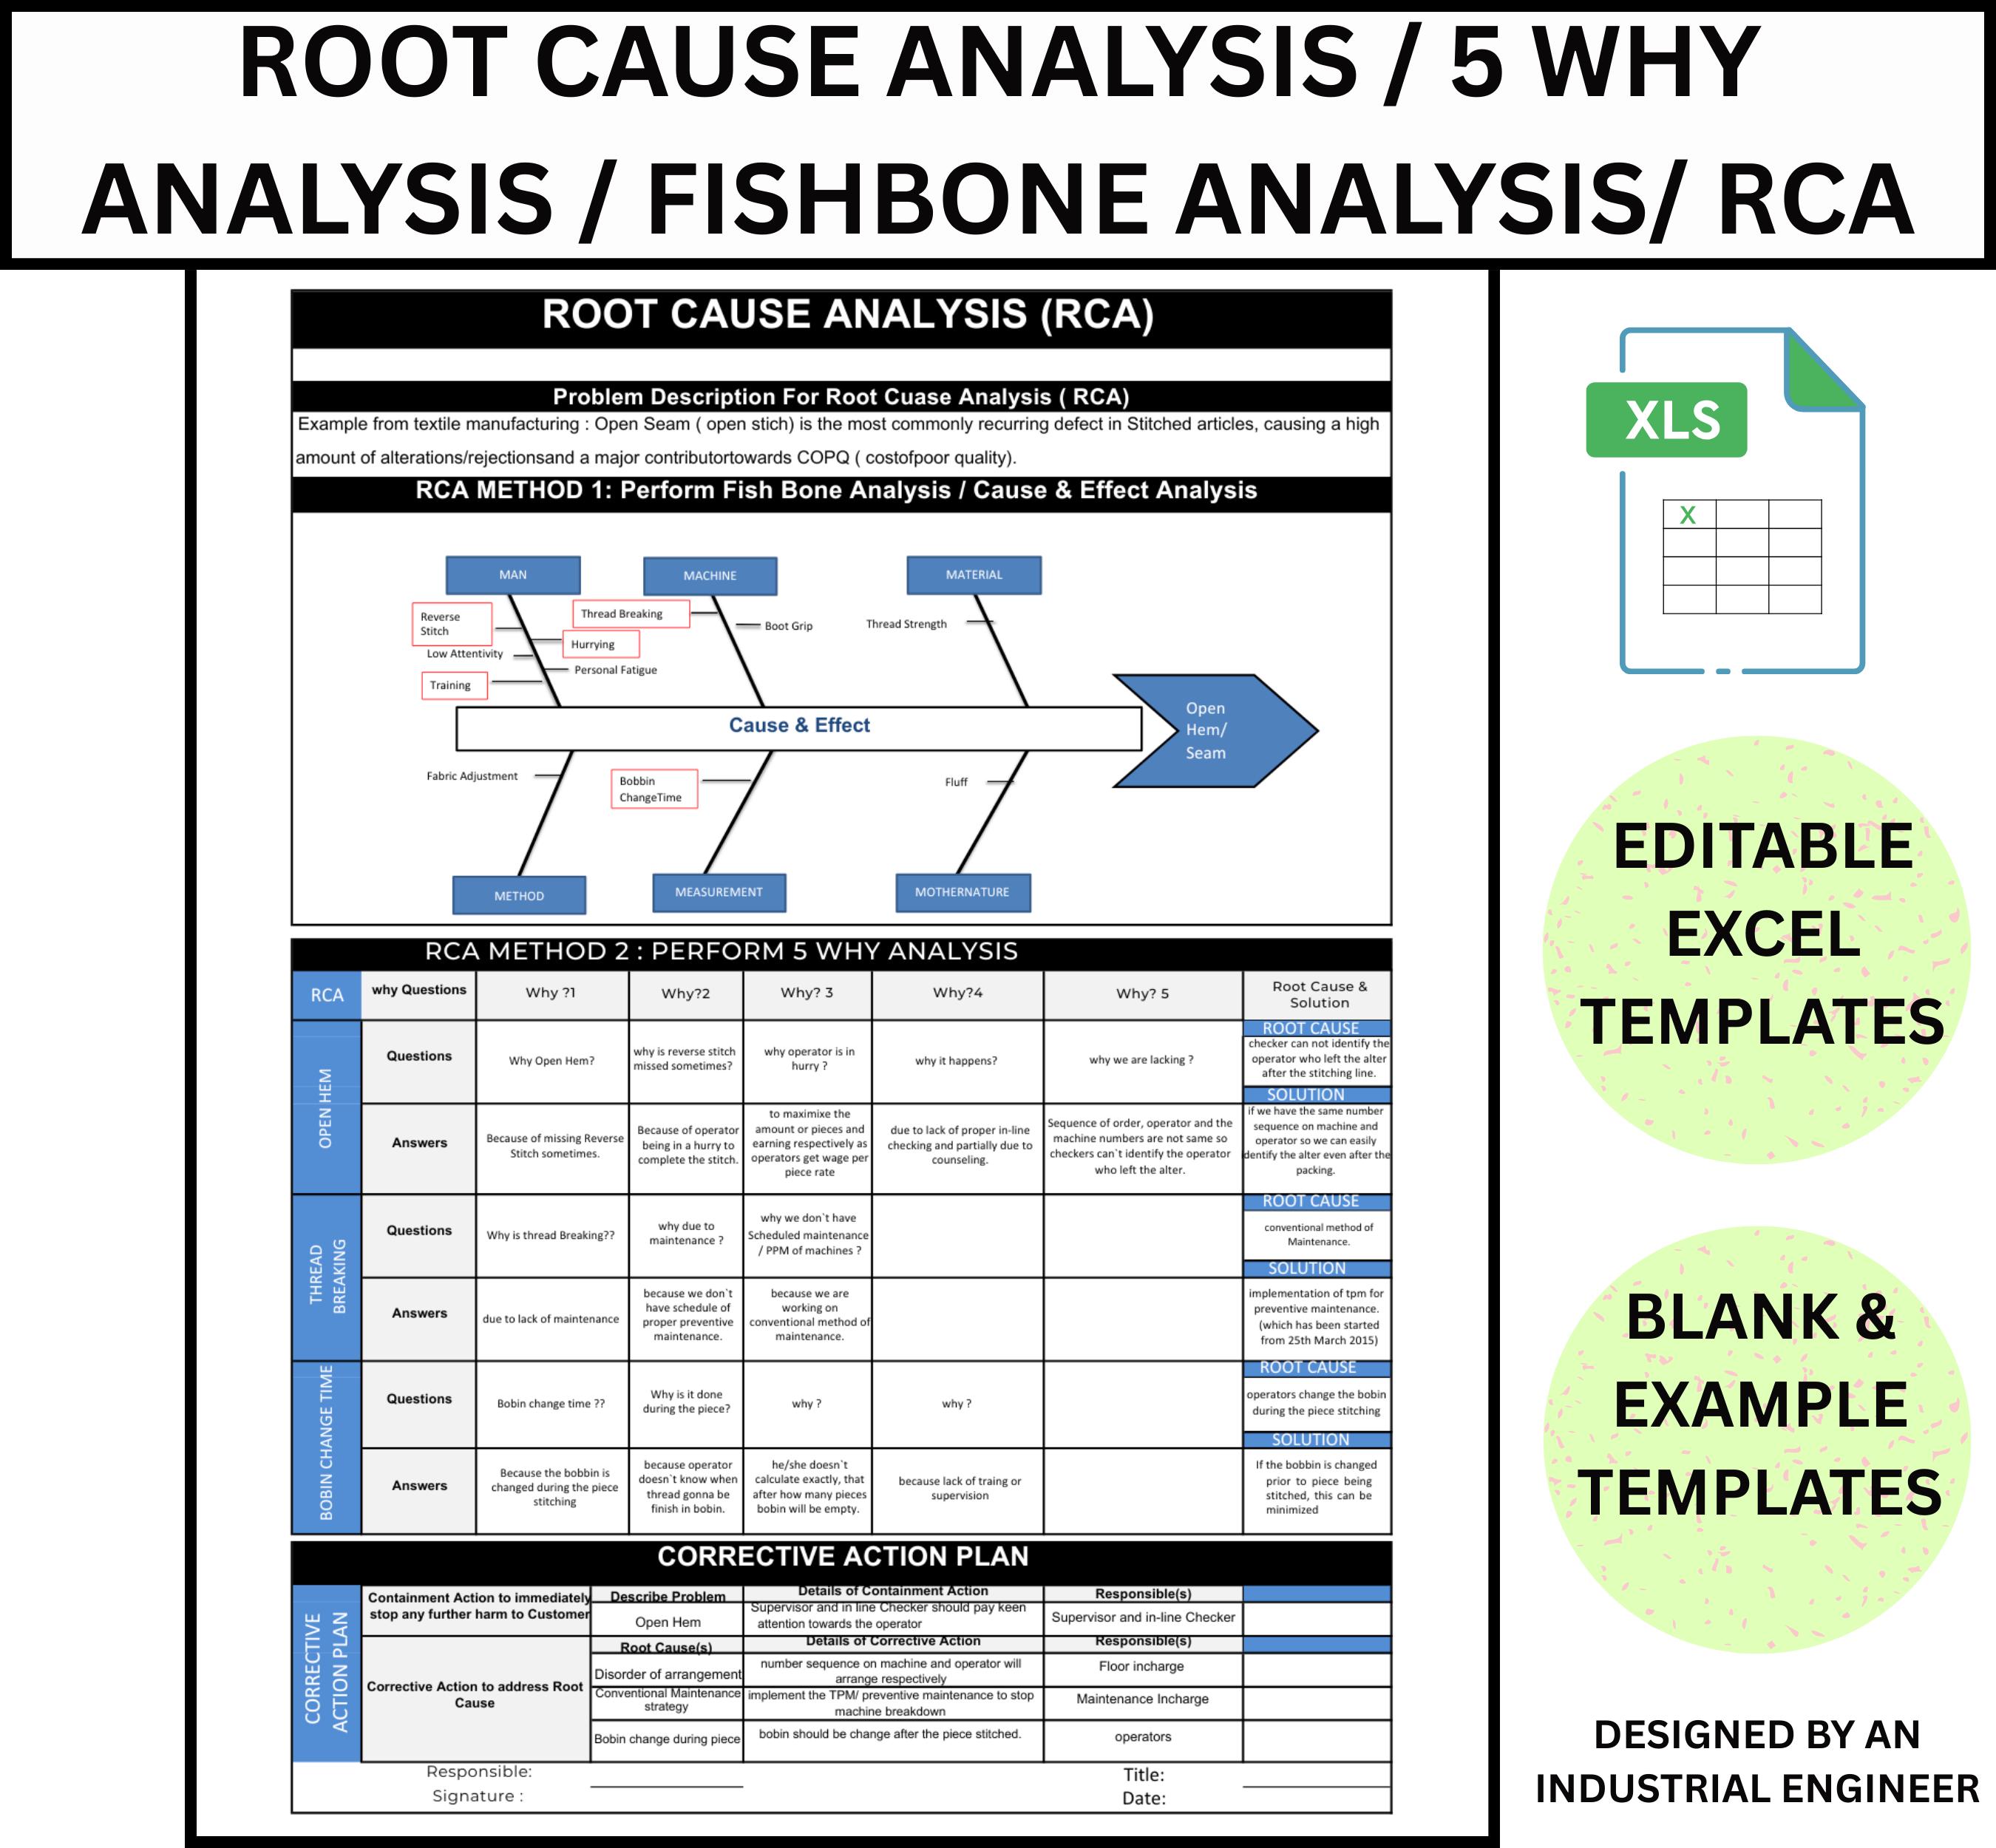
Apply analytical tools (5 Whys, Fishbone Diagram, Fault Tree Analysis) and document the causal chain. This section often contains the most valuable insights.
5. Action Plan & Recommendations
Translate findings into specific, measurable actions—process changes, design tweaks, or training initiatives. Assign owners and deadlines to ensure accountability.
6. Verification & Follow‑Up
Plan for monitoring the implemented solutions. Define metrics that will confirm whether the root cause has been resolved and schedule follow‑up reviews.
Step-by-Step Guide to Using the Example Root Cause Analysis Report Template
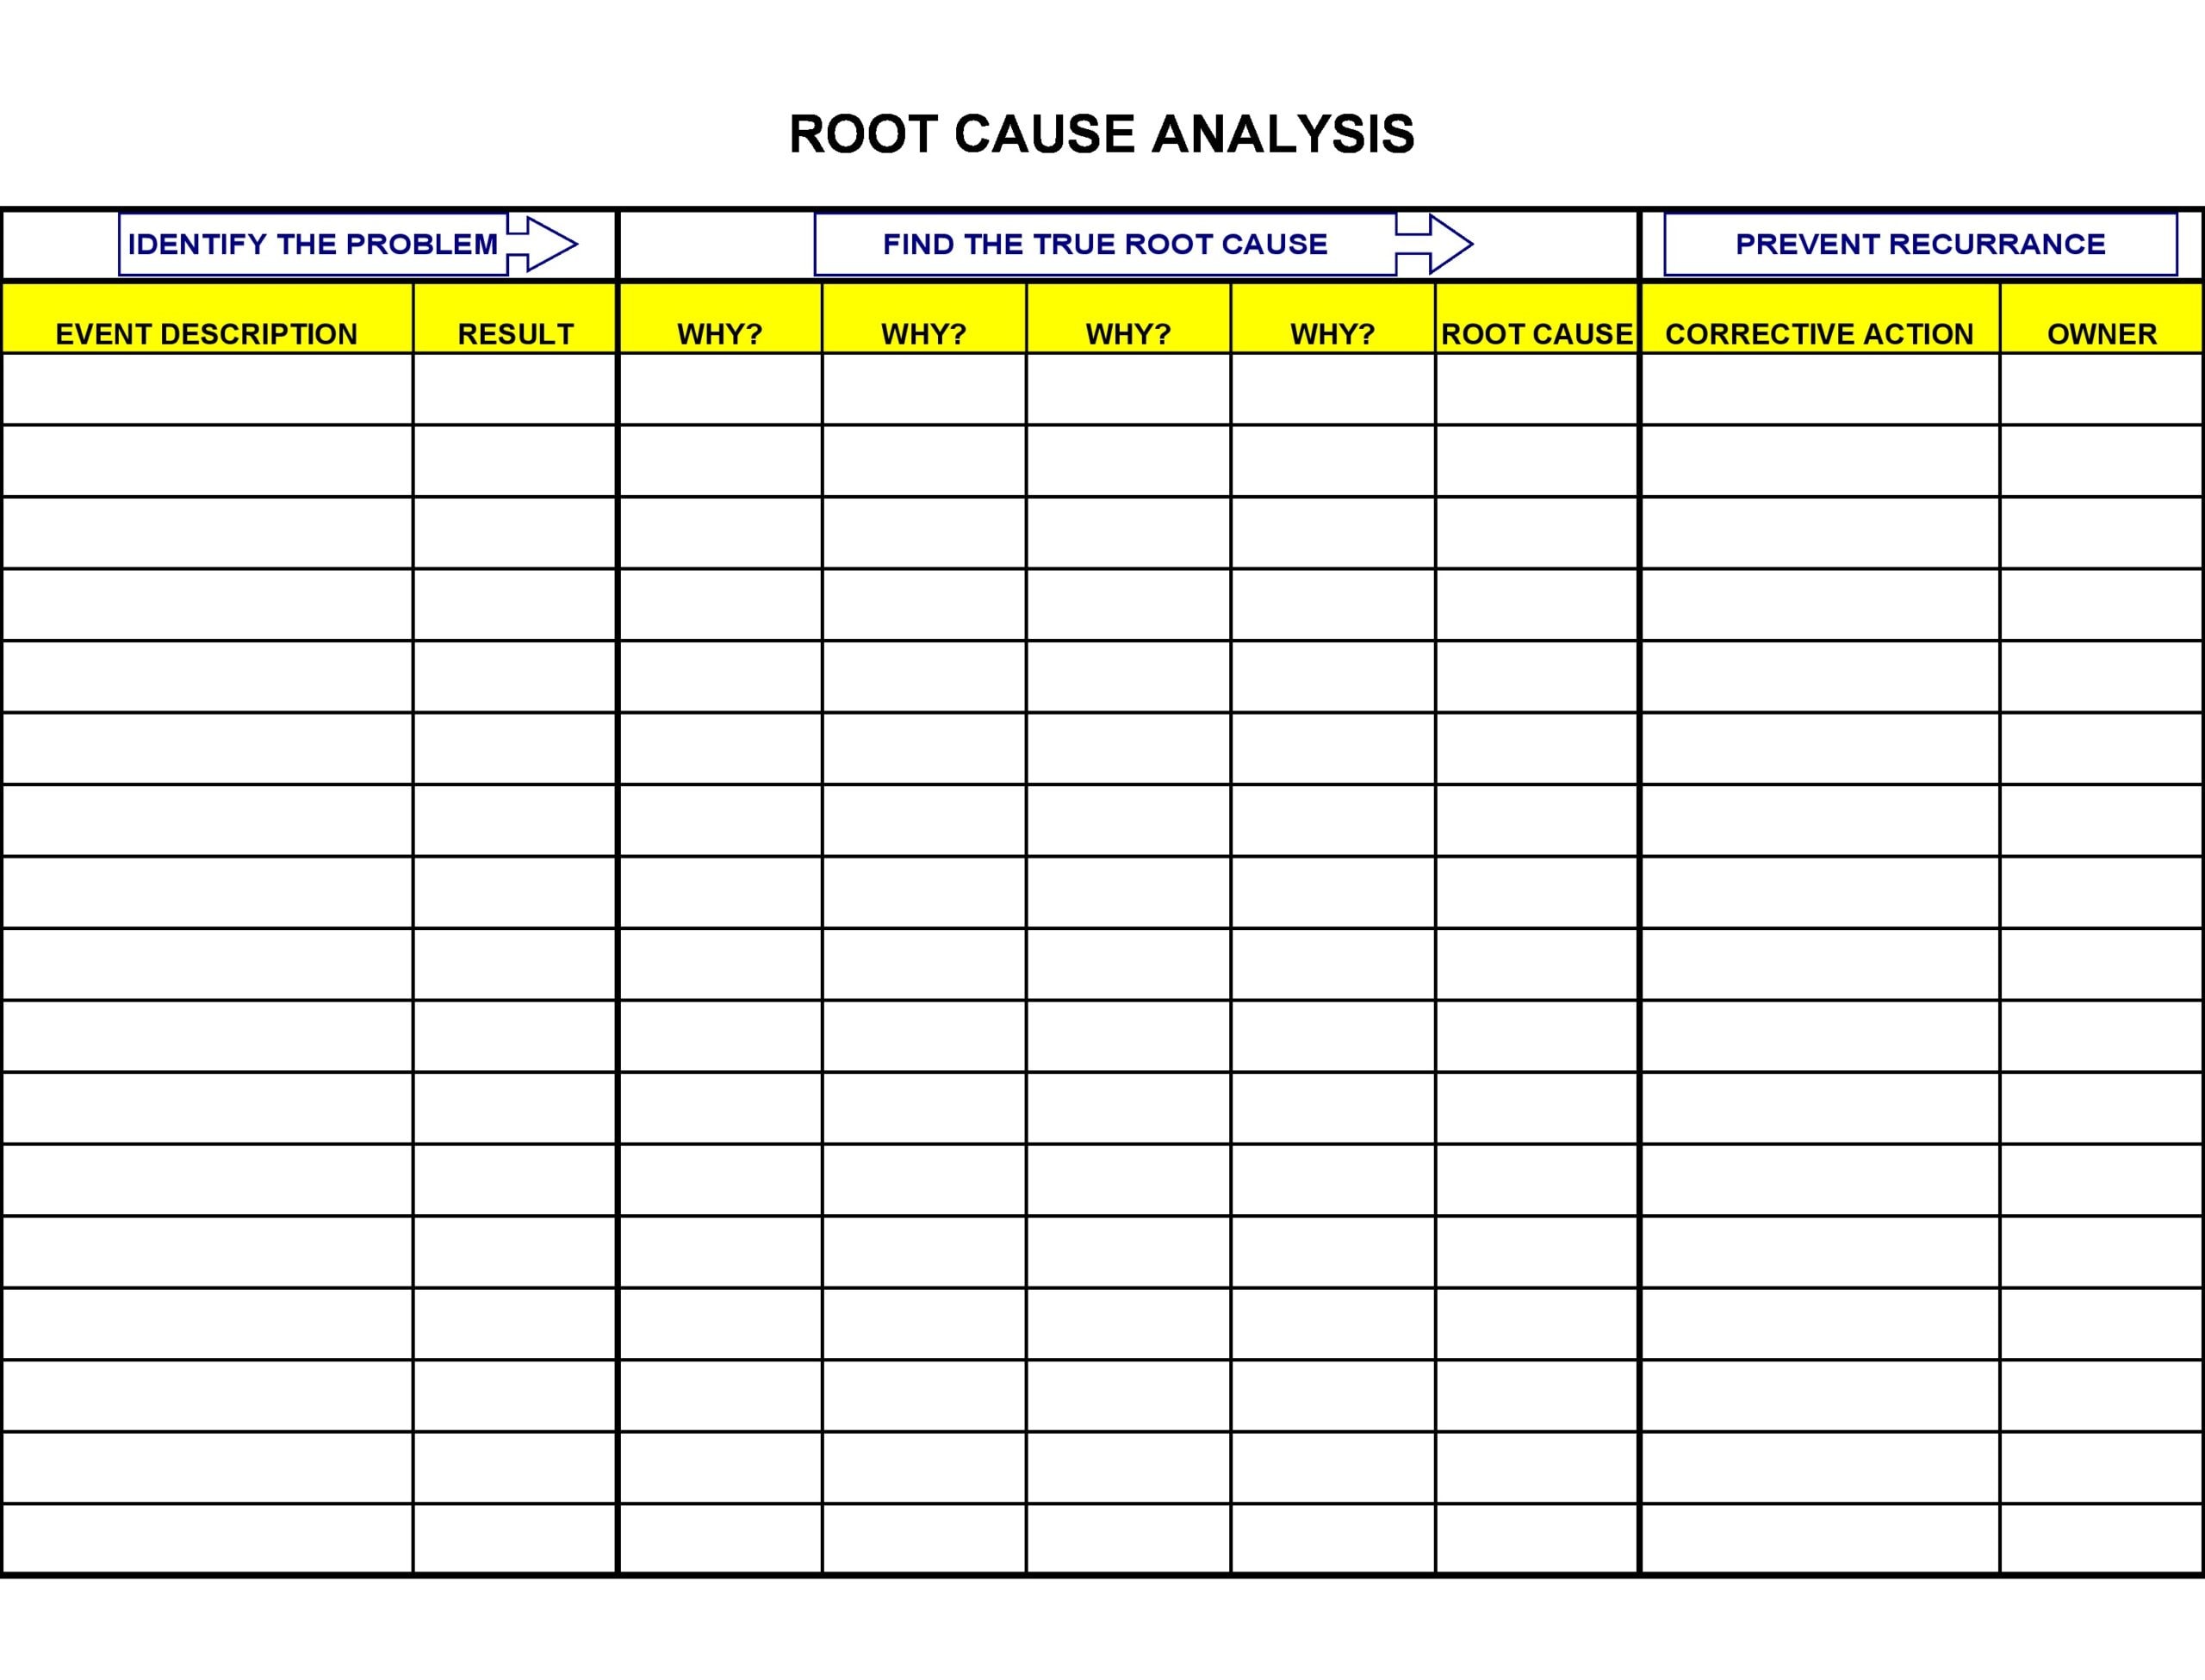
Below is a practical walk‑through, assuming you’re starting fresh with an incident.
Step 1: Gather Your Team
Bring together cross‑functional members—engineering, QA, operations, and customer support. Diversity of perspective prevents blind spots.
Step 2: Populate the Incident Overview
Use the template’s first page to jot down the “who,” “what,” “when,” and “where.” A quick narrative keeps everyone aligned.
Step 3: Craft a Precise Problem Statement
Turn anecdotal symptoms into quantifiable facts. For example, “The yield dropped from 98% to 91% within one month, increasing scrap cost by $15,000.”
Step 4: Collect Evidence
- Sensor logs from the last 30 days.
- Customer complaint tickets labeled “Quality Issue.”
- Inspection photos of defective components.
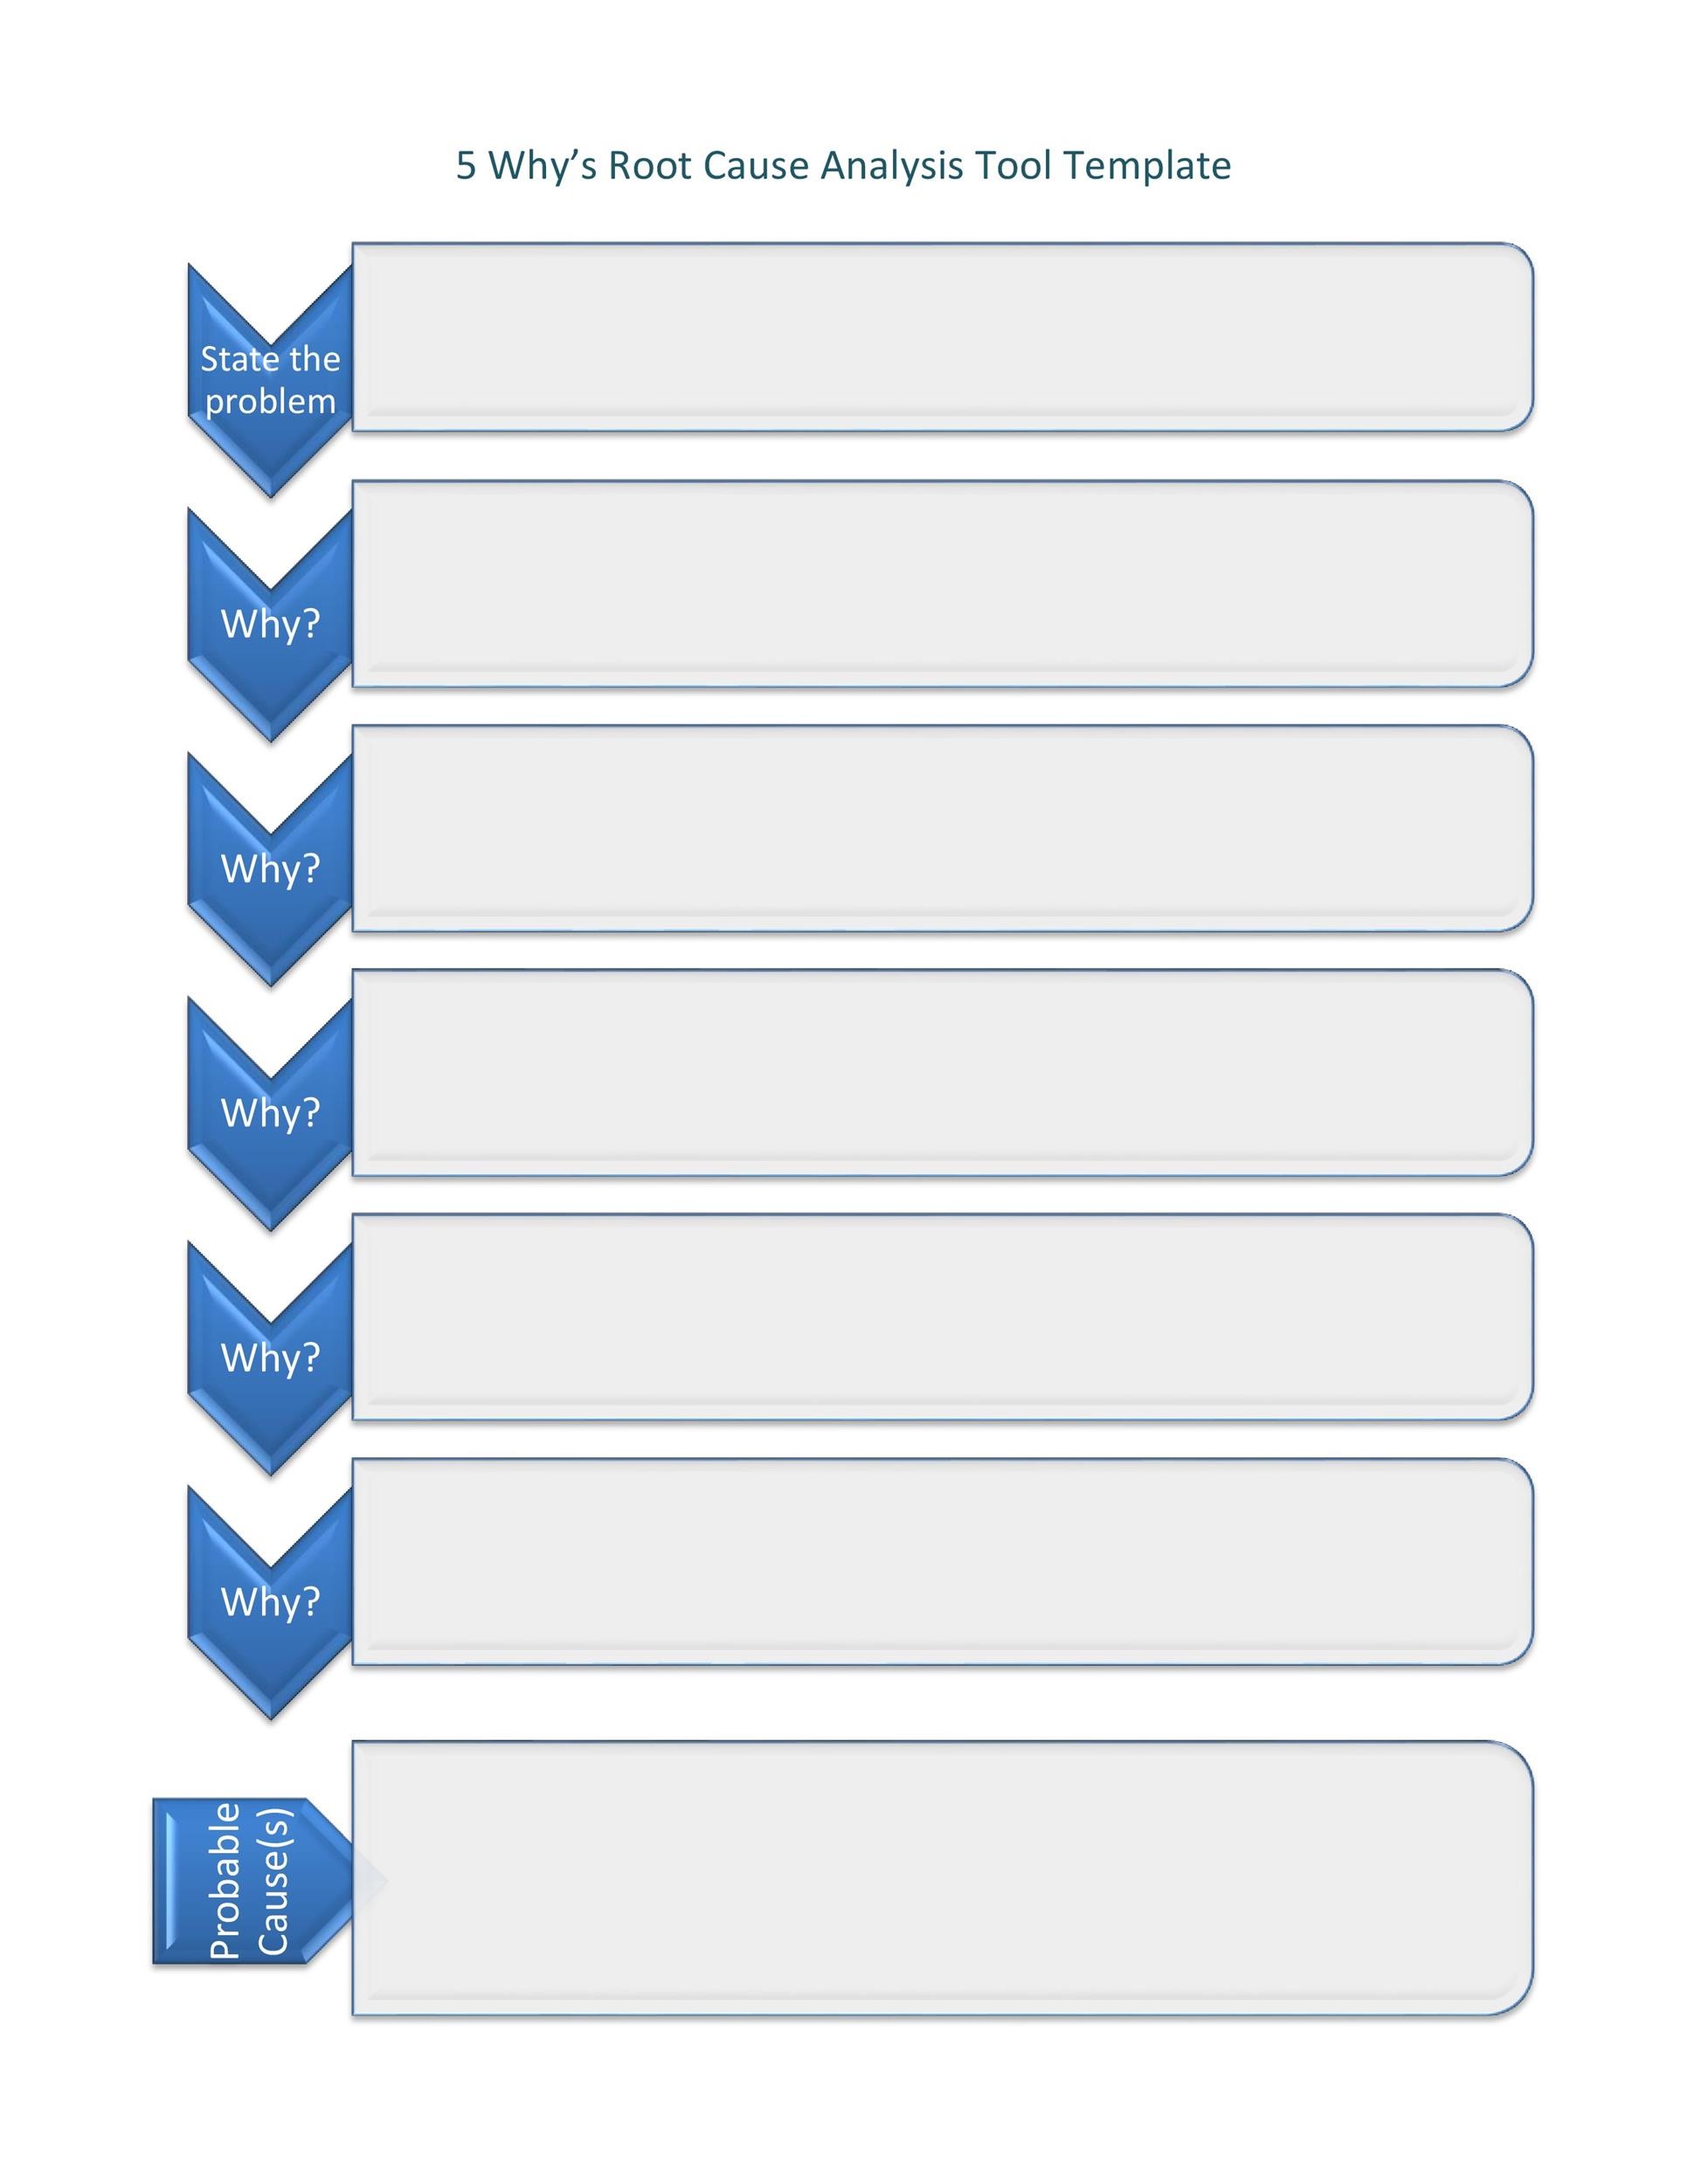
Step 5: Analyze with 5 Whys
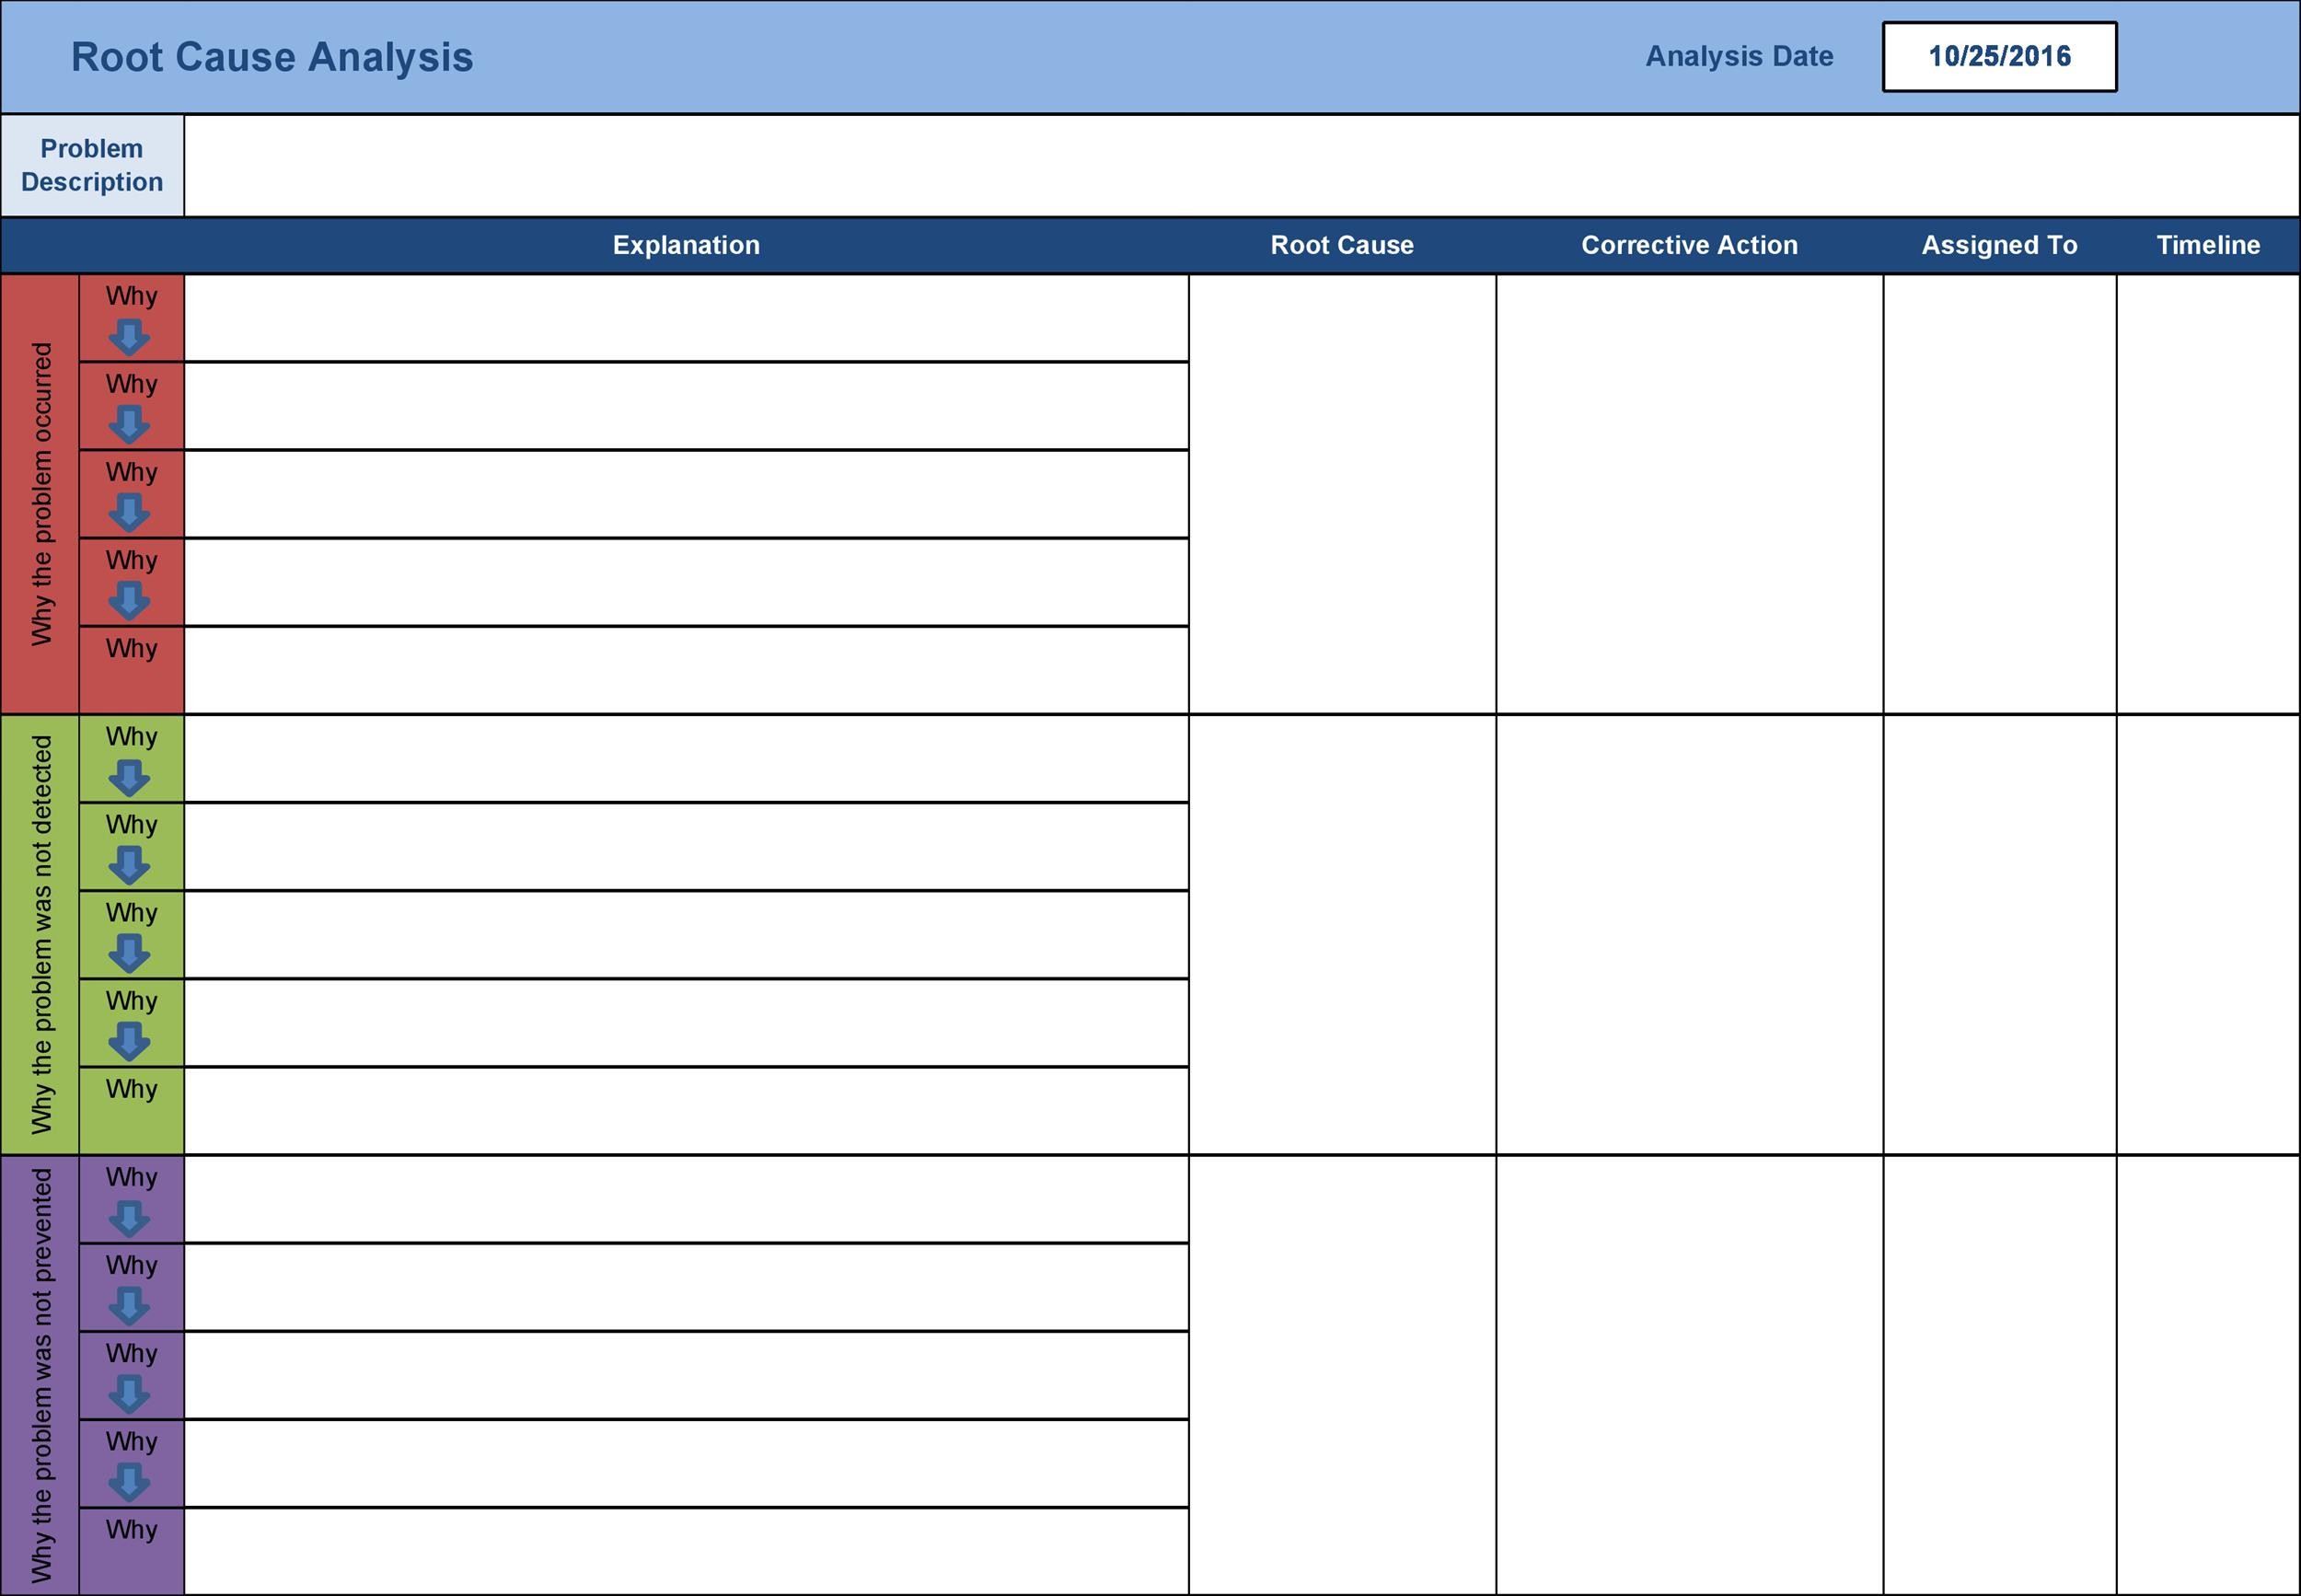
Ask “Why?” repeatedly until you reach a fundamental cause. Document each answer in the template’s structured table.
Step 6: Visualize with a Fishbone Diagram
Sketch the diagram on the second page. Label major categories—People, Process, Equipment, Materials—and fill in contributing factors.
Step 7: Synthesize Root Causes
Combine insights from the 5 Whys and the Fishbone Diagram. Highlight the root cause in bold to make it stand out.
Step 8: Draft the Action Plan
Use the template’s “Recommendations” section to list actions, owners, start and finish dates, and success metrics.
Step 9: Validate with Data
Run a pilot or simulation to confirm that the proposed fix actually mitigates the issue. Update the report with the results.
Step 10: Communicate and Close the Loop
Share the final RCA report with all stakeholders. Celebrate the findings, reinforce lessons learned, and document the closure in the knowledge base.
Real-World Application: A Manufacturing Case Study
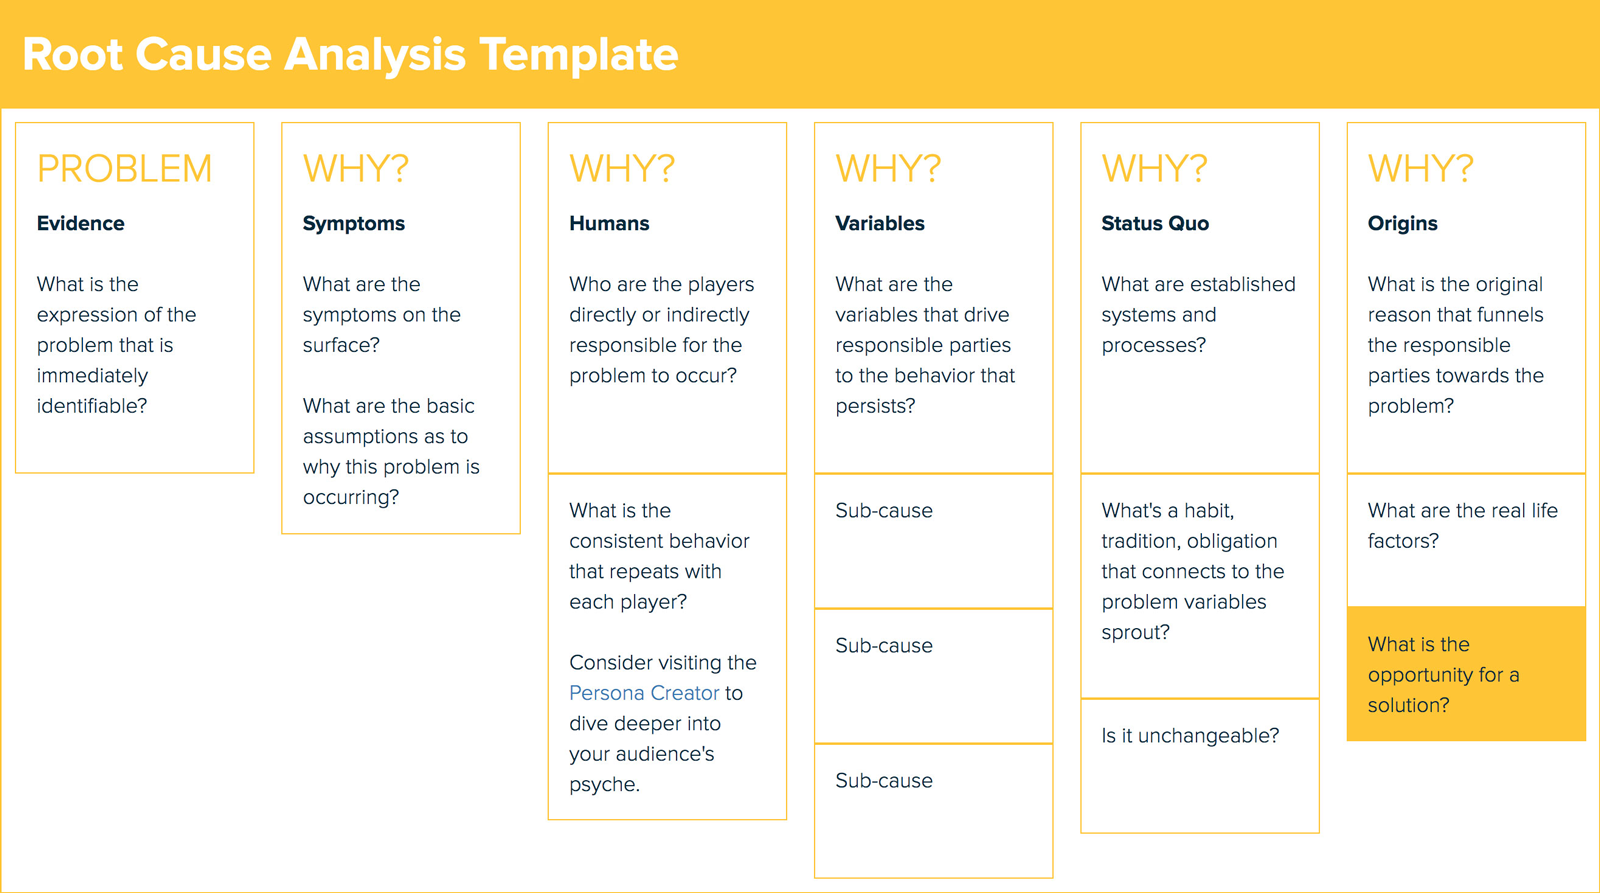
Last year, a mid‑size automotive supplier faced a spike in wheel assembly defects—tire misalignments that caused costly rework. Our team used the example template to investigate.
Incident Overview
Defects reported: 350 units in one week; affected models: X1 and X2.
Data & Evidence
- Machine logs from the stamping press.
- Operator shift reports.
- Customer return records.
Root Cause
The 5 Whys revealed that a misaligned die caused the wheel rim to distort. The die had not been calibrated in 18 months due to a scheduling oversight.
Action Plan
- Immediate: Replace the die; recalibrate all stamping presses.
- Process: Implement quarterly calibration checks.
- Training: Conduct a 2‑hour workshop on equipment maintenance.
Outcome
Within two weeks, defect rates dropped to <2%; scrap cost decreased by $27,000, and customer satisfaction scores climbed by 15 points.
Common Pitfalls and How to Avoid Them

Even seasoned analysts can stumble. Below are frequent missteps and how to sidestep them.
1. Skipping the Problem Statement
Without a clear statement, the investigation drifts. Always begin with a concise, data‑driven problem definition.
2. Relying on Assumptions
Don’t let intuition replace evidence. Document every data source and verify findings with tests.
3. Overlooking Human Factors
Equipment failures often mask operator errors. Include People as a category in your Fishbone Diagram.
4. Failing to Assign Accountability
Recommendations without owners become wishful thinking. Specify who owns each action and the expected completion date.
5. Ignoring Follow‑Up
Solutions can drift into “good enough.” Schedule a post‑implementation review to confirm the root cause remains addressed.
Tips to Customize the Template for Your Team

While the template is a solid foundation, tailoring it to your culture makes it more effective.
Use Your Own Metrics
Replace generic KPI placeholders with metrics that matter to your business—cycle time, defect per million opportunities, or customer churn.
Incorporate Visual Dashboards
Embed links (within the document’s comment fields) to live dashboards that update in real time, keeping the RCA dynamic.
Leverage Color Coding
Use a simple color scheme—red for root causes, green for corrective actions—to make the report instantly scannable.
Integrate with Knowledge Bases
Attach the final RCA to your organization’s wiki or ticketing system so that future incidents reference historical lessons.
Leveraging Data and Visuals
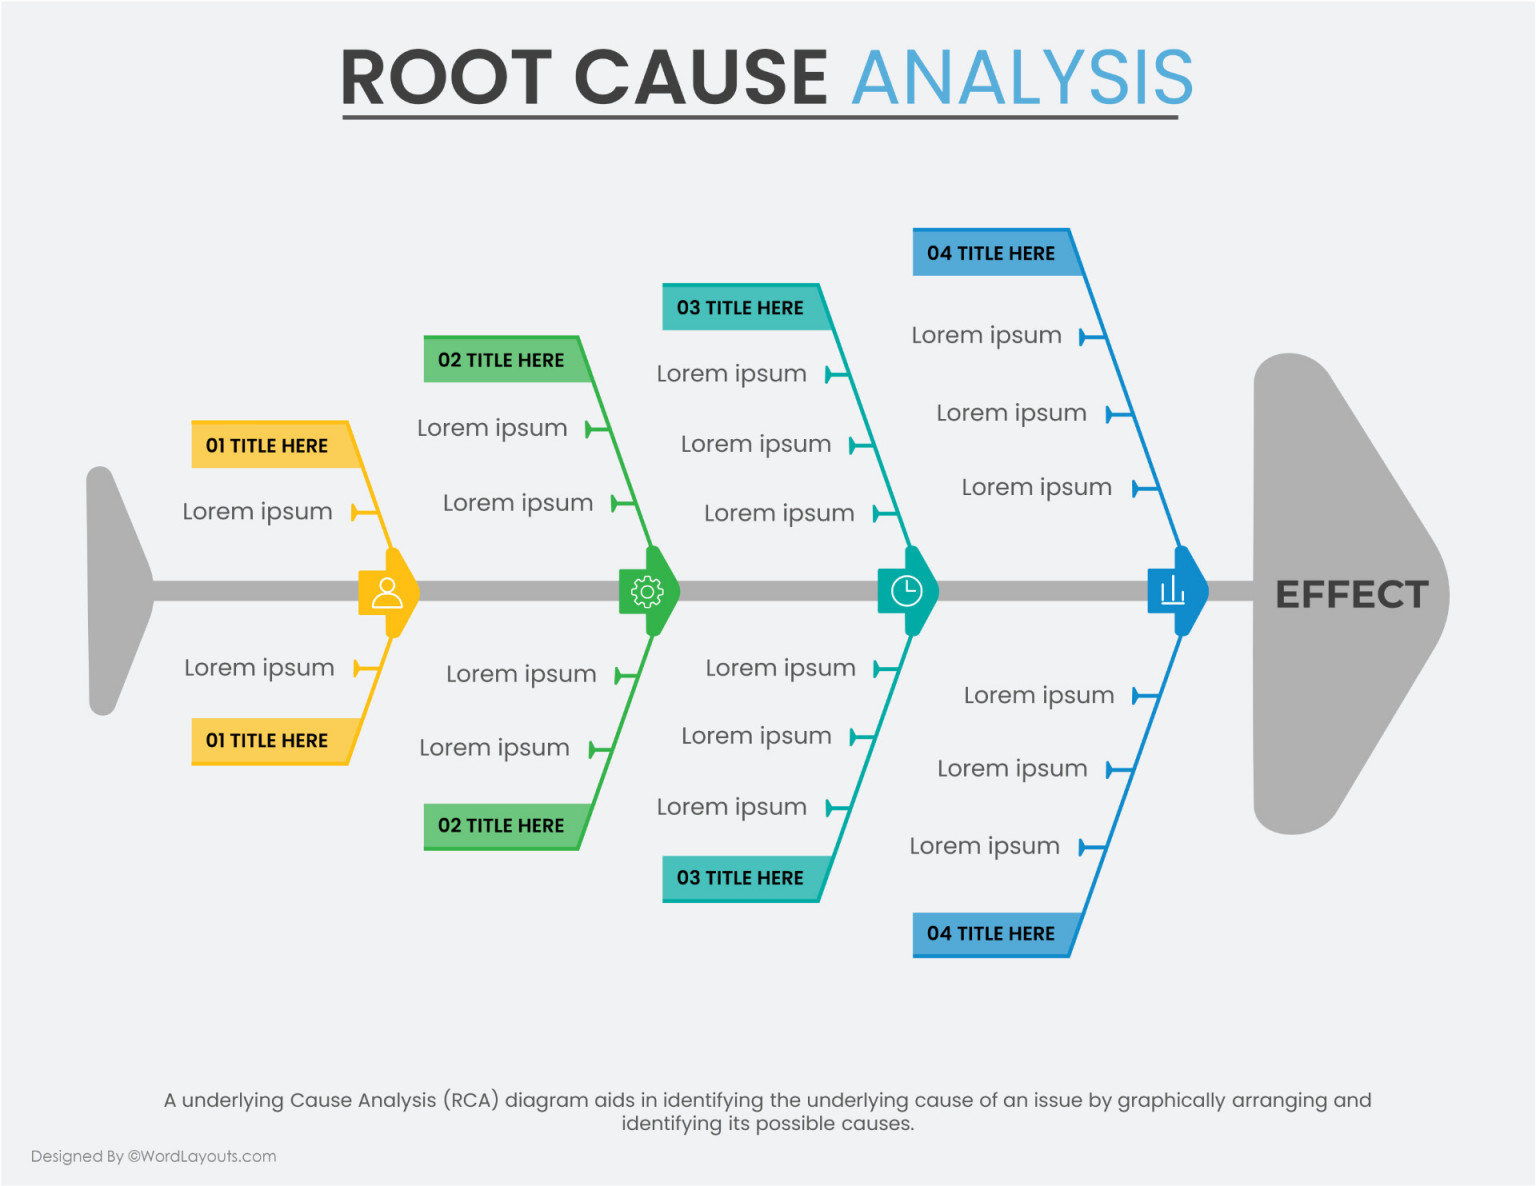
Numbers and images can transform a bland report into an engaging story.
Statistical Control Charts
Plot defect rates before and after the intervention. A sudden shift in the mean signals a successful fix.
Cause‑Effect Graphs
Show how each contributing factor links to the root cause. Visual pathways help non‑technical stakeholders follow the logic.
Photographic Evidence
Include before‑and‑after shots of the defective component or the corrected process step. Visual proof reduces skepticism.
Closing the Loop: Implementation and Follow-Up
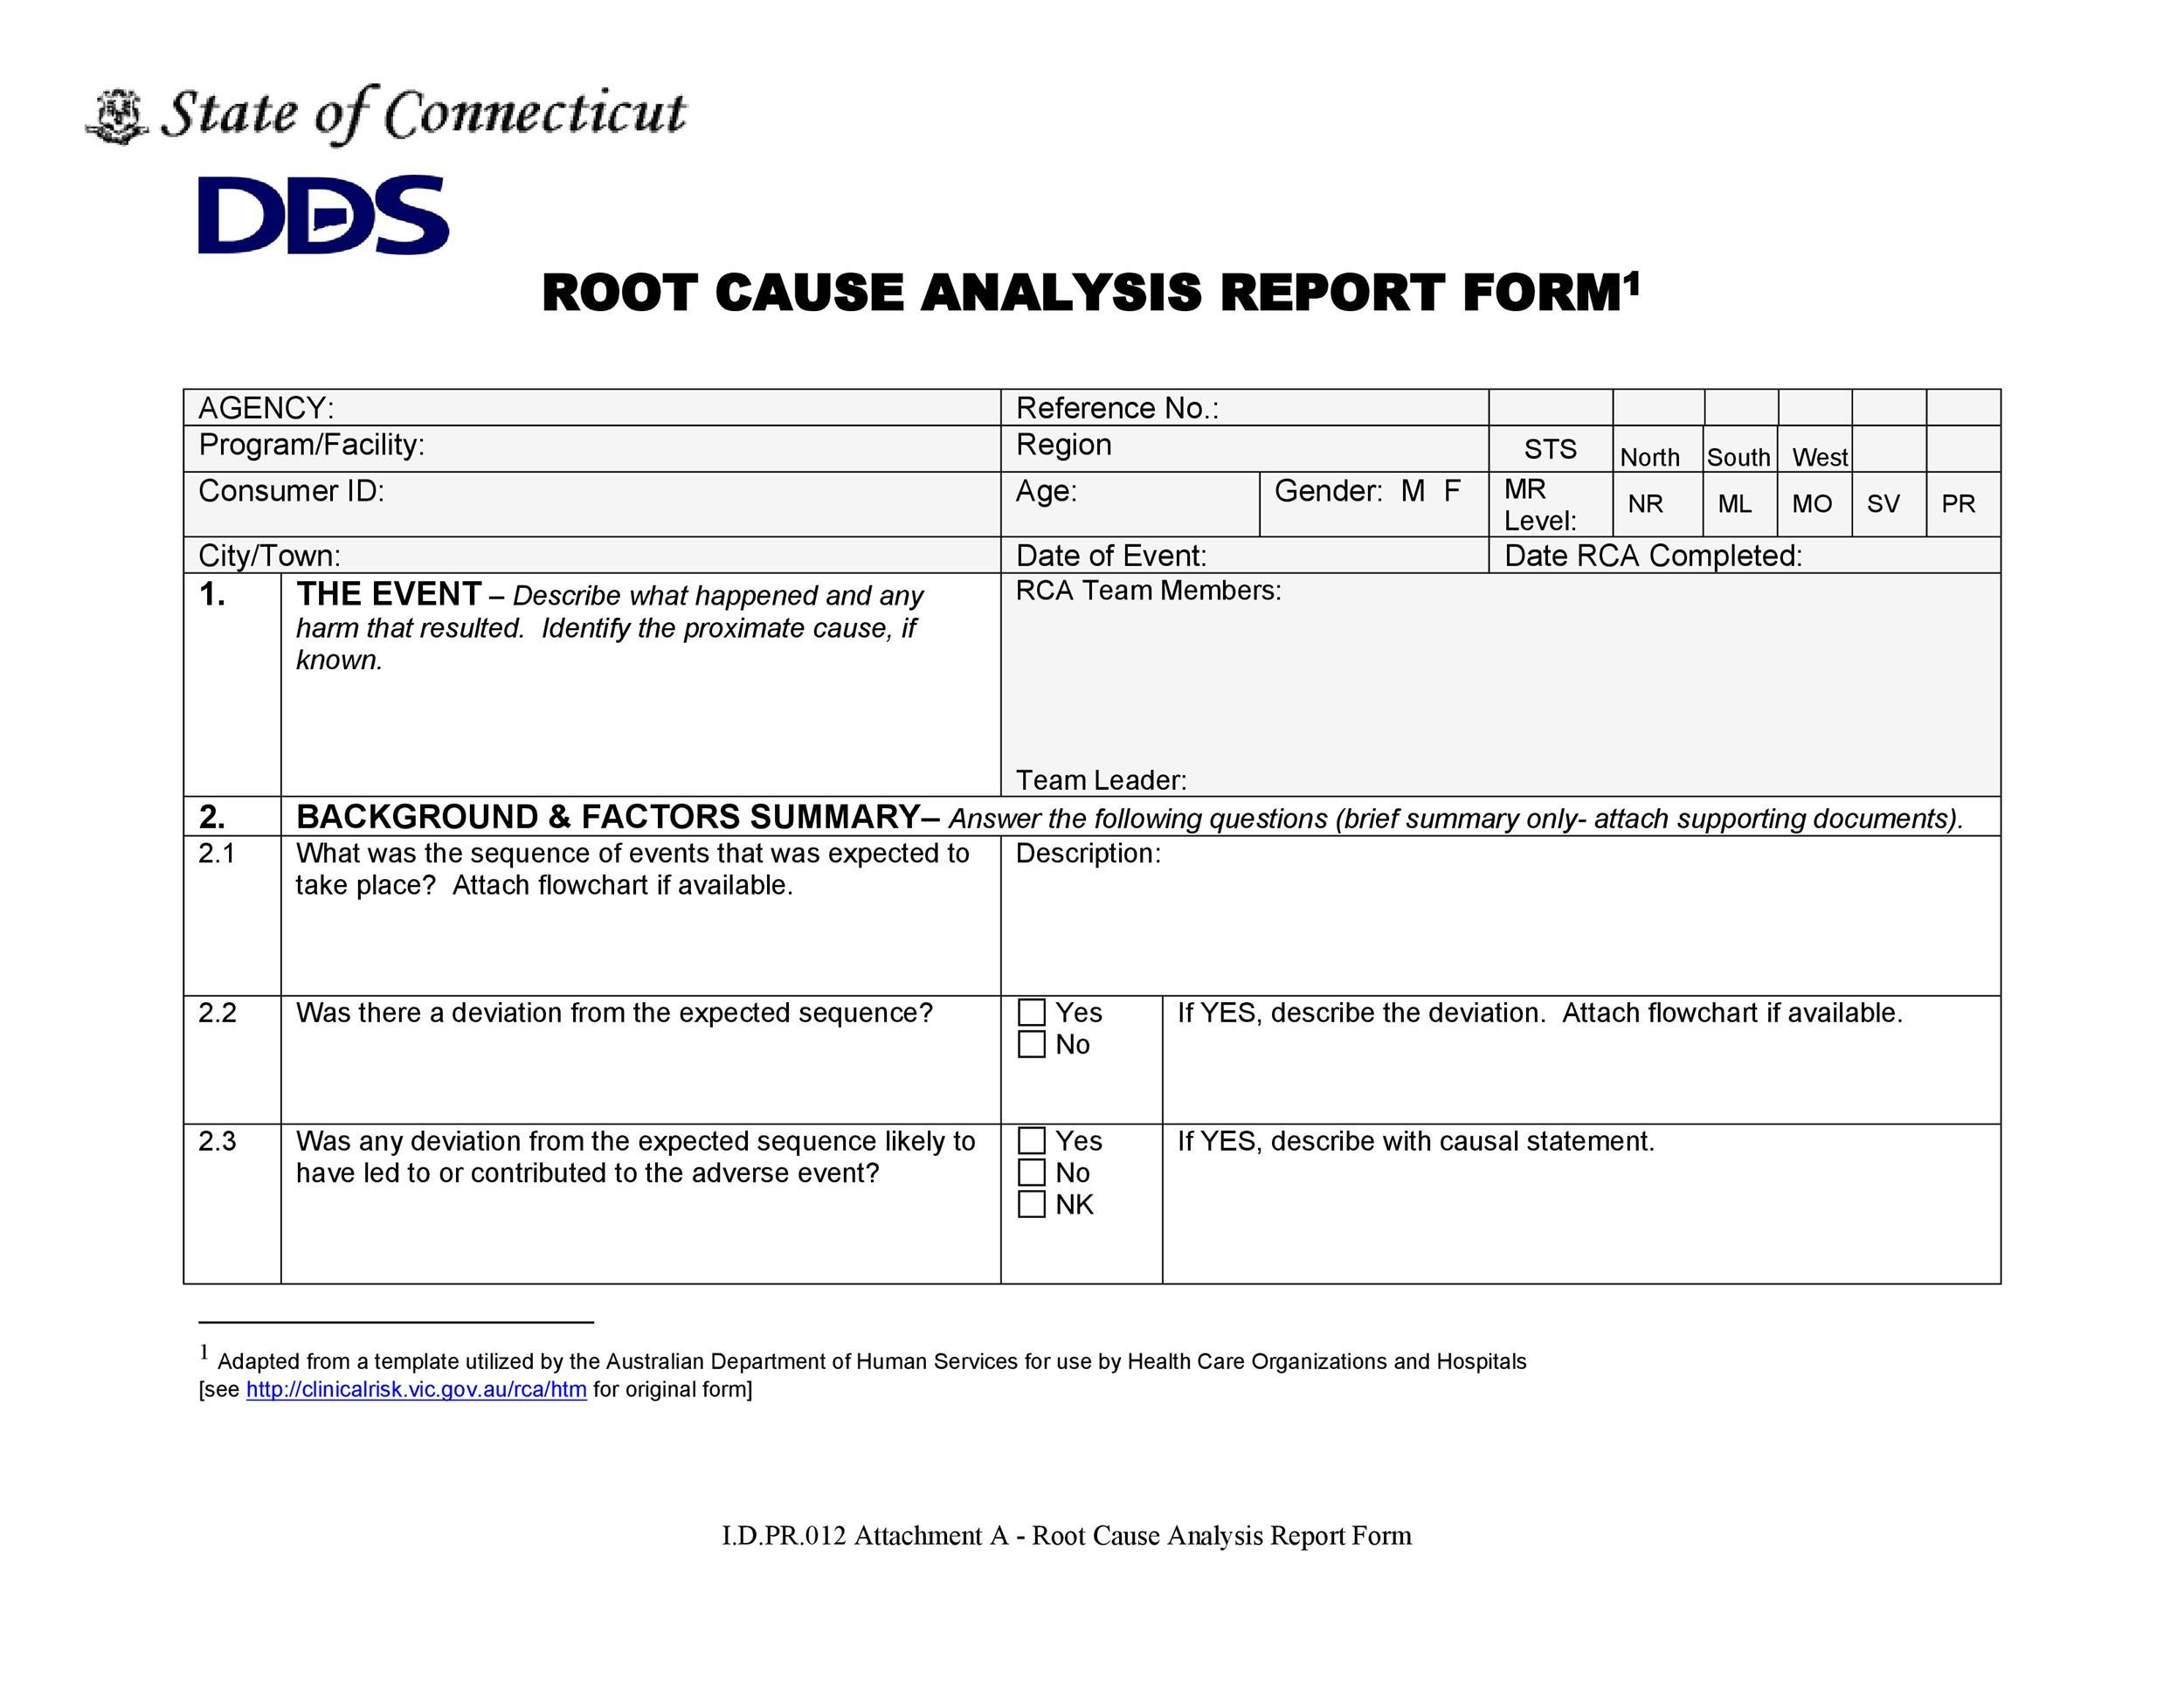
Identifying root causes is just the first half of the equation. The second half—turning insight into action—is where real value emerges.
Assign a Champion
Designate an RCA champion to oversee the execution of corrective actions. This person keeps momentum alive and resolves bottlenecks.
Track Progress with Gantt Charts
Visualize the action plan timeline. Seeing tasks move from “In Progress” to “Completed” reinforces accountability.
Measure Success
Define clear metrics (e.g., reduction in defect rate by 80%) and compare post‑implementation data. Celebrate wins—public recognition boosts morale.
Document Lessons Learned
Update the template’s “Lessons Learned” section with key takeaways. Use these lessons in future training and onboarding.
Final Thoughts
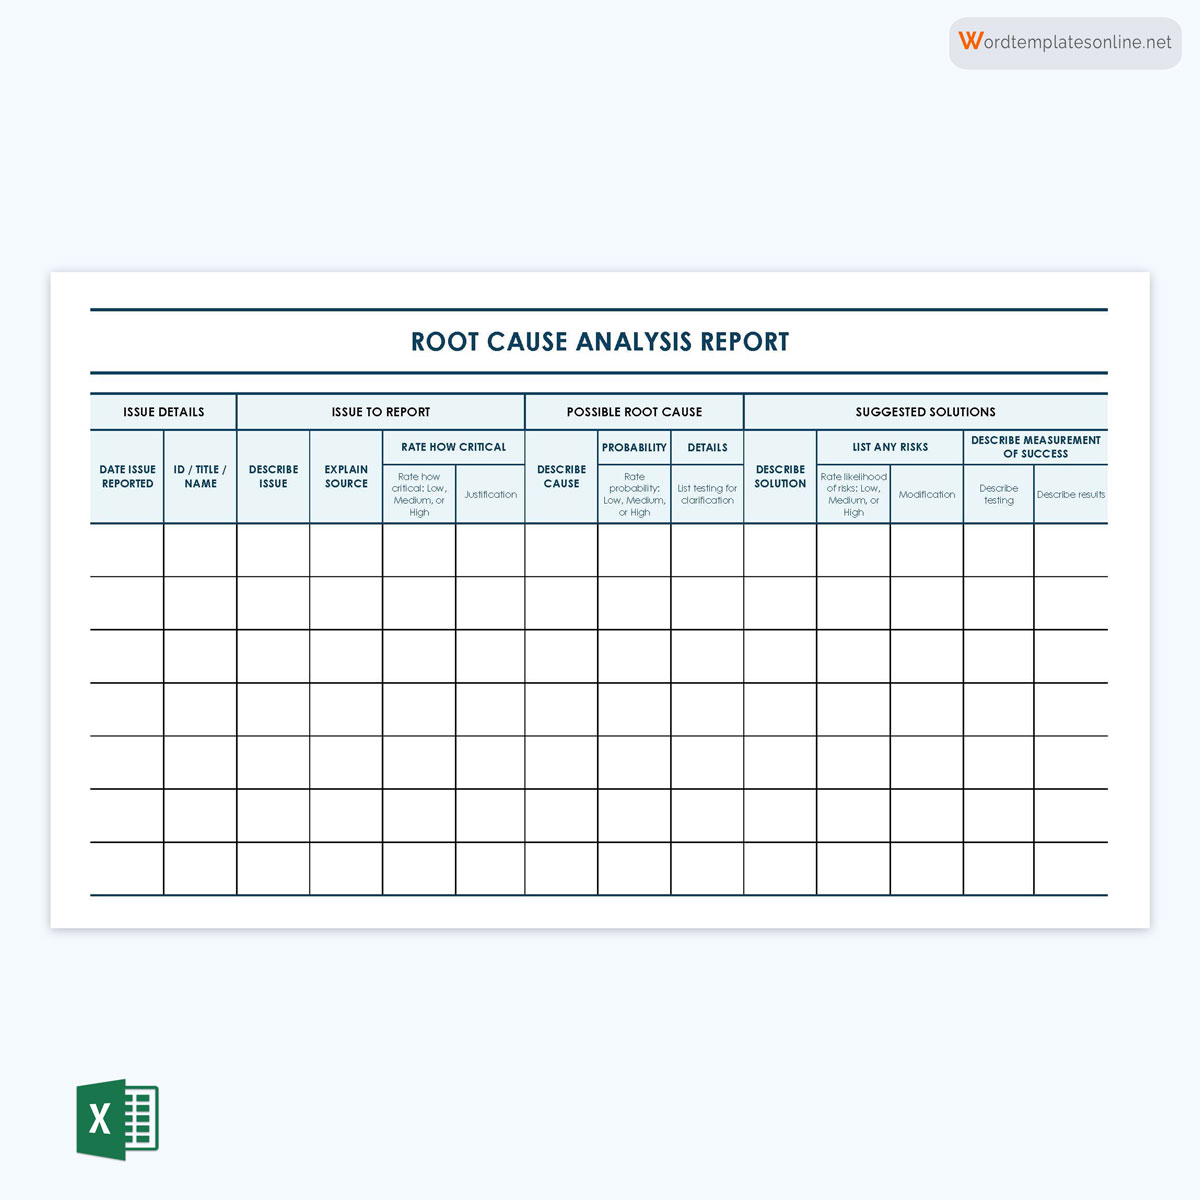
Root Cause Analysis is more than a compliance exercise; it’s a strategic tool that sharpens operational resilience. By embracing the Example Root Cause Analysis Report Template, you provide your team with a clear, repeatable path from problem identification to sustainable solution. Start today, iterate as you learn, and watch as recurring issues shrink into the background. The result? Faster processes, happier customers, and a culture that thrives on continuous improvement.


Related posts of "Example Root Cause Analysis Report Template"
