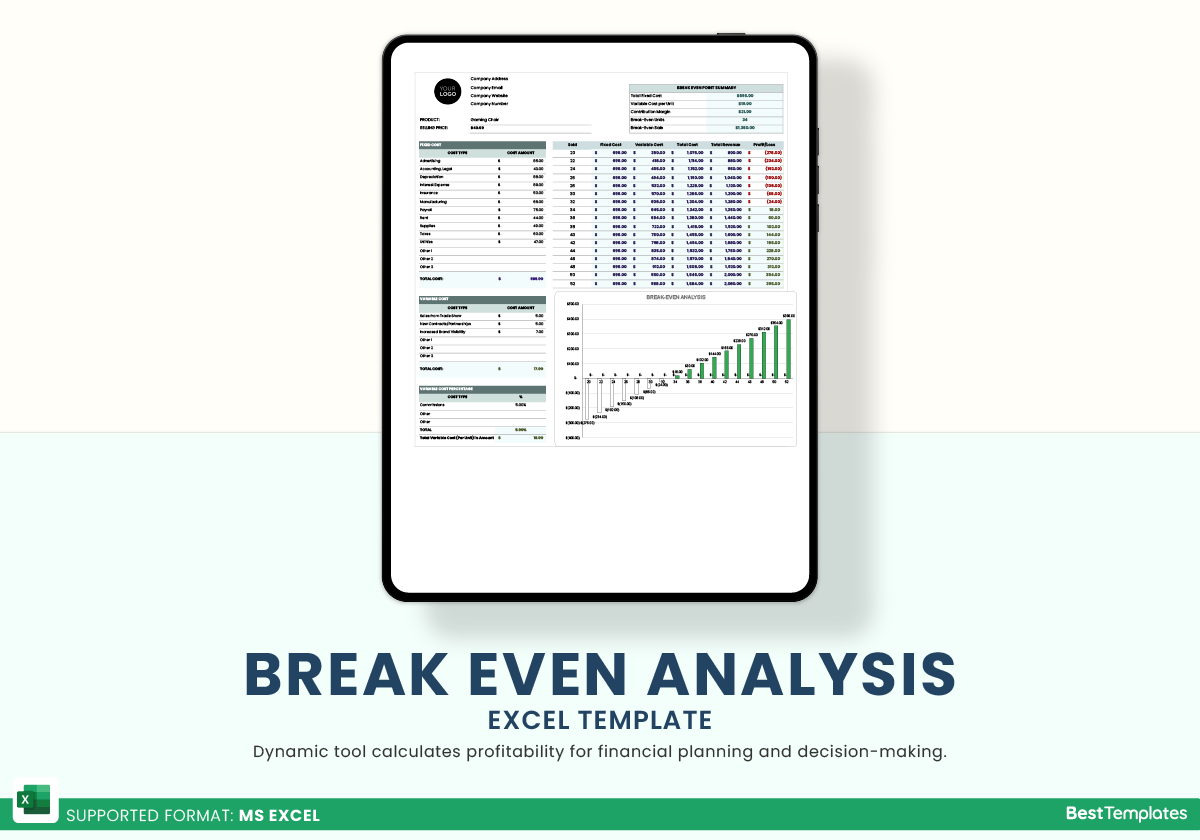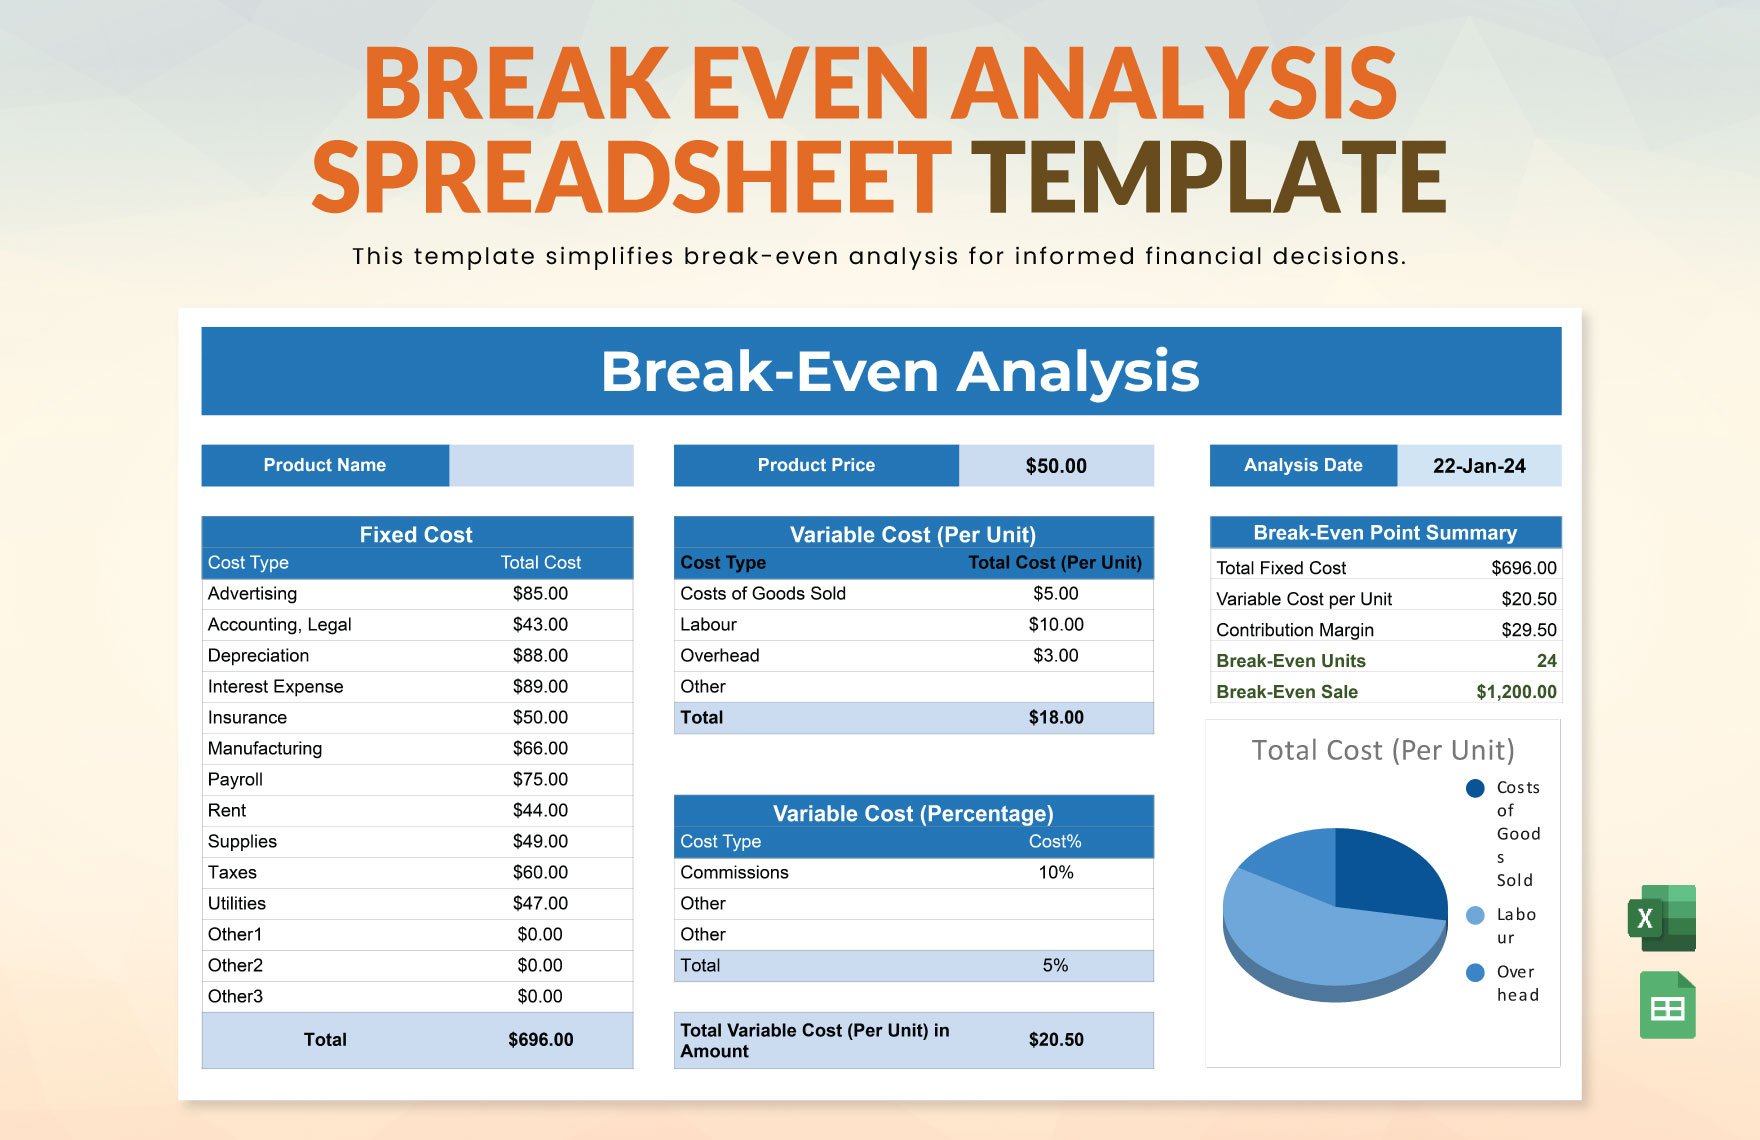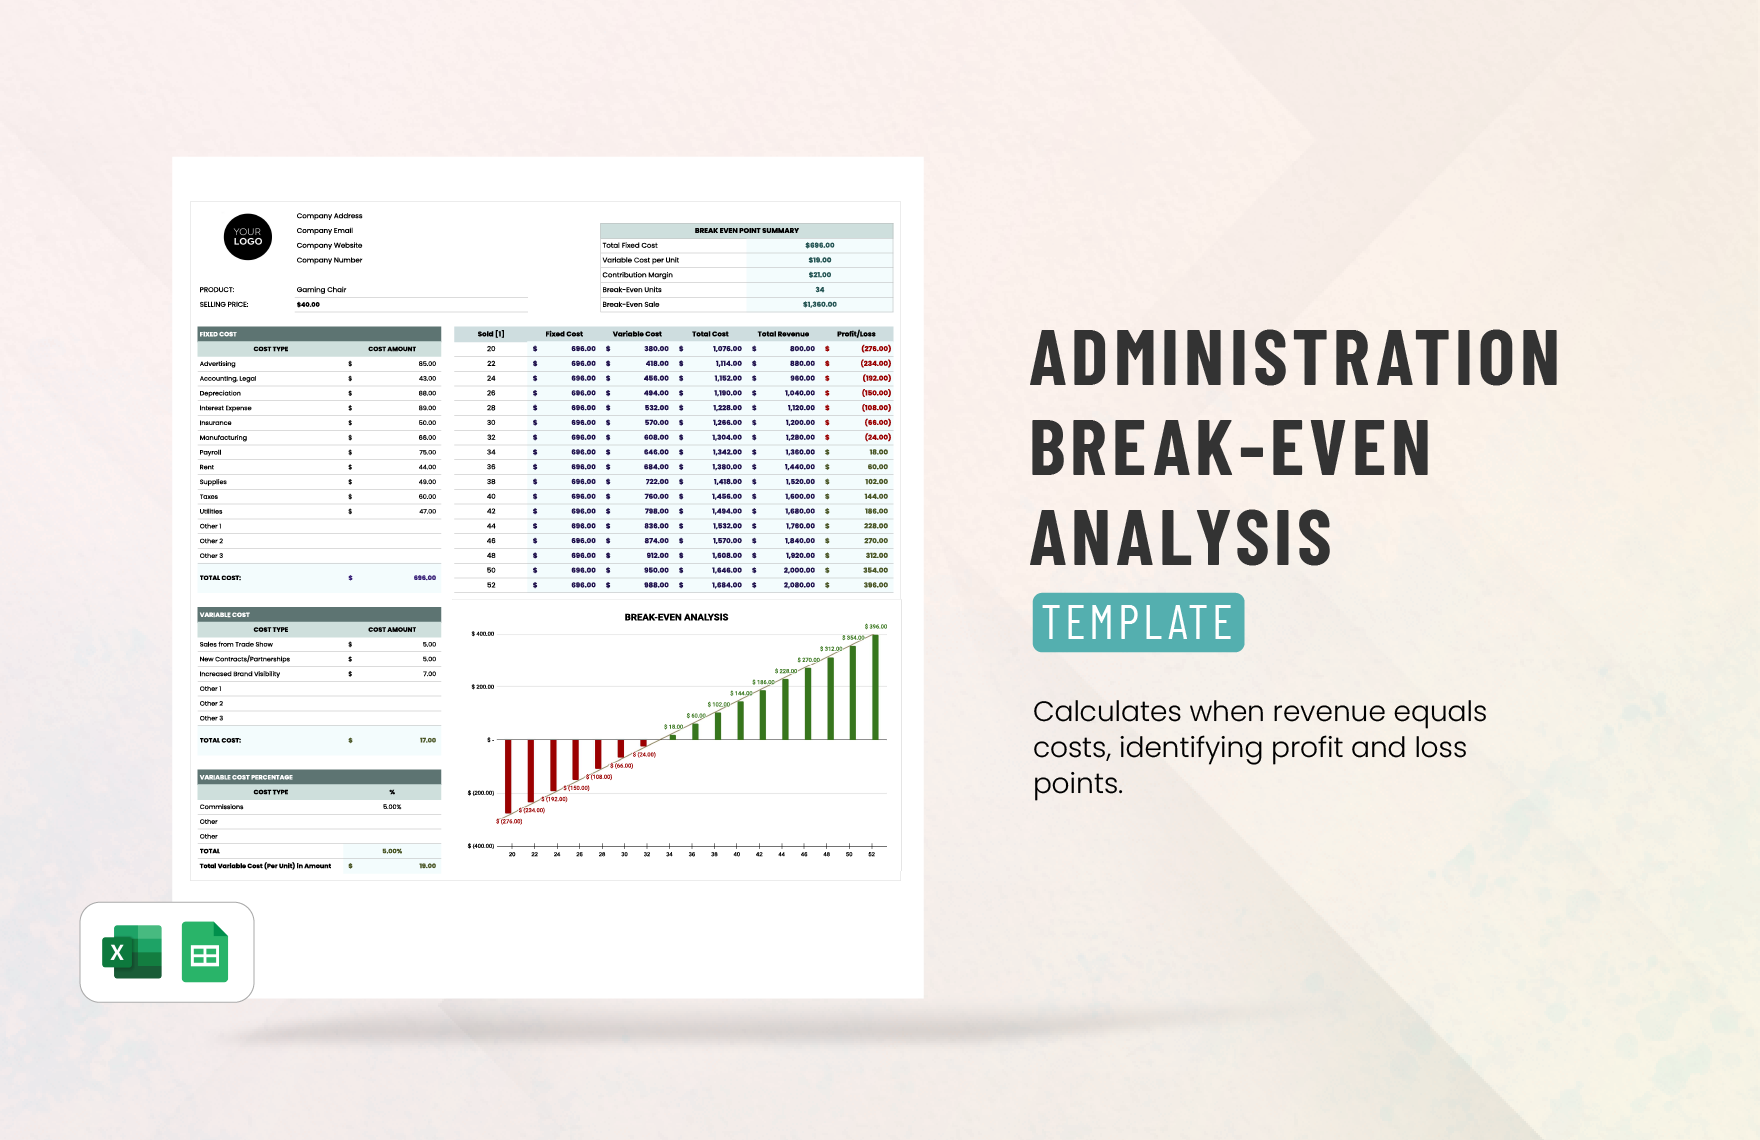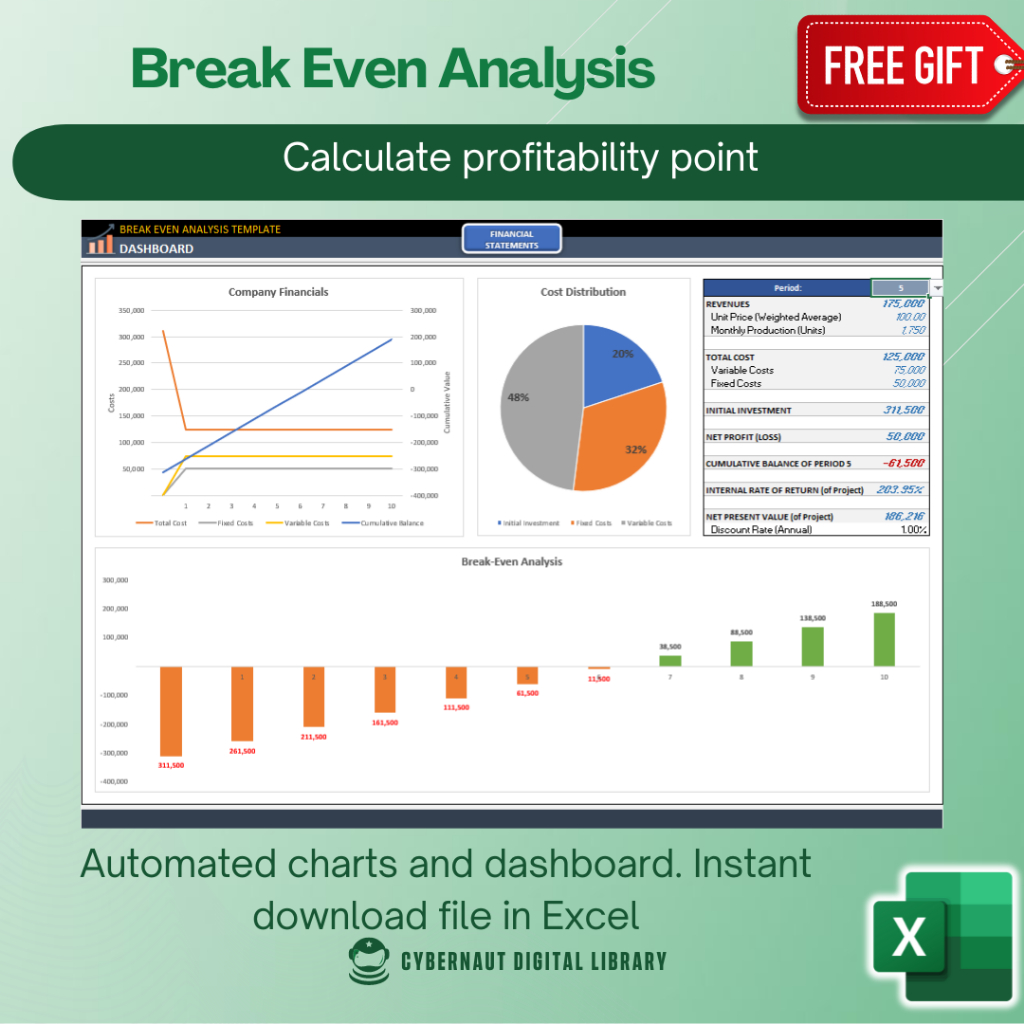
Excel Break Even Analysis Template is the secret weapon that savvy Asian entrepreneurs and seasoned managers alike turn to when they want to demystify profitability, predict cash flow, and make data‑driven decisions without drowning in spreadsheets; this article unpacks why the template matters, how to craft one that sings, and how real‑world Asian businesses use it to stay ahead of the competition.
What Is Break Even Analysis?
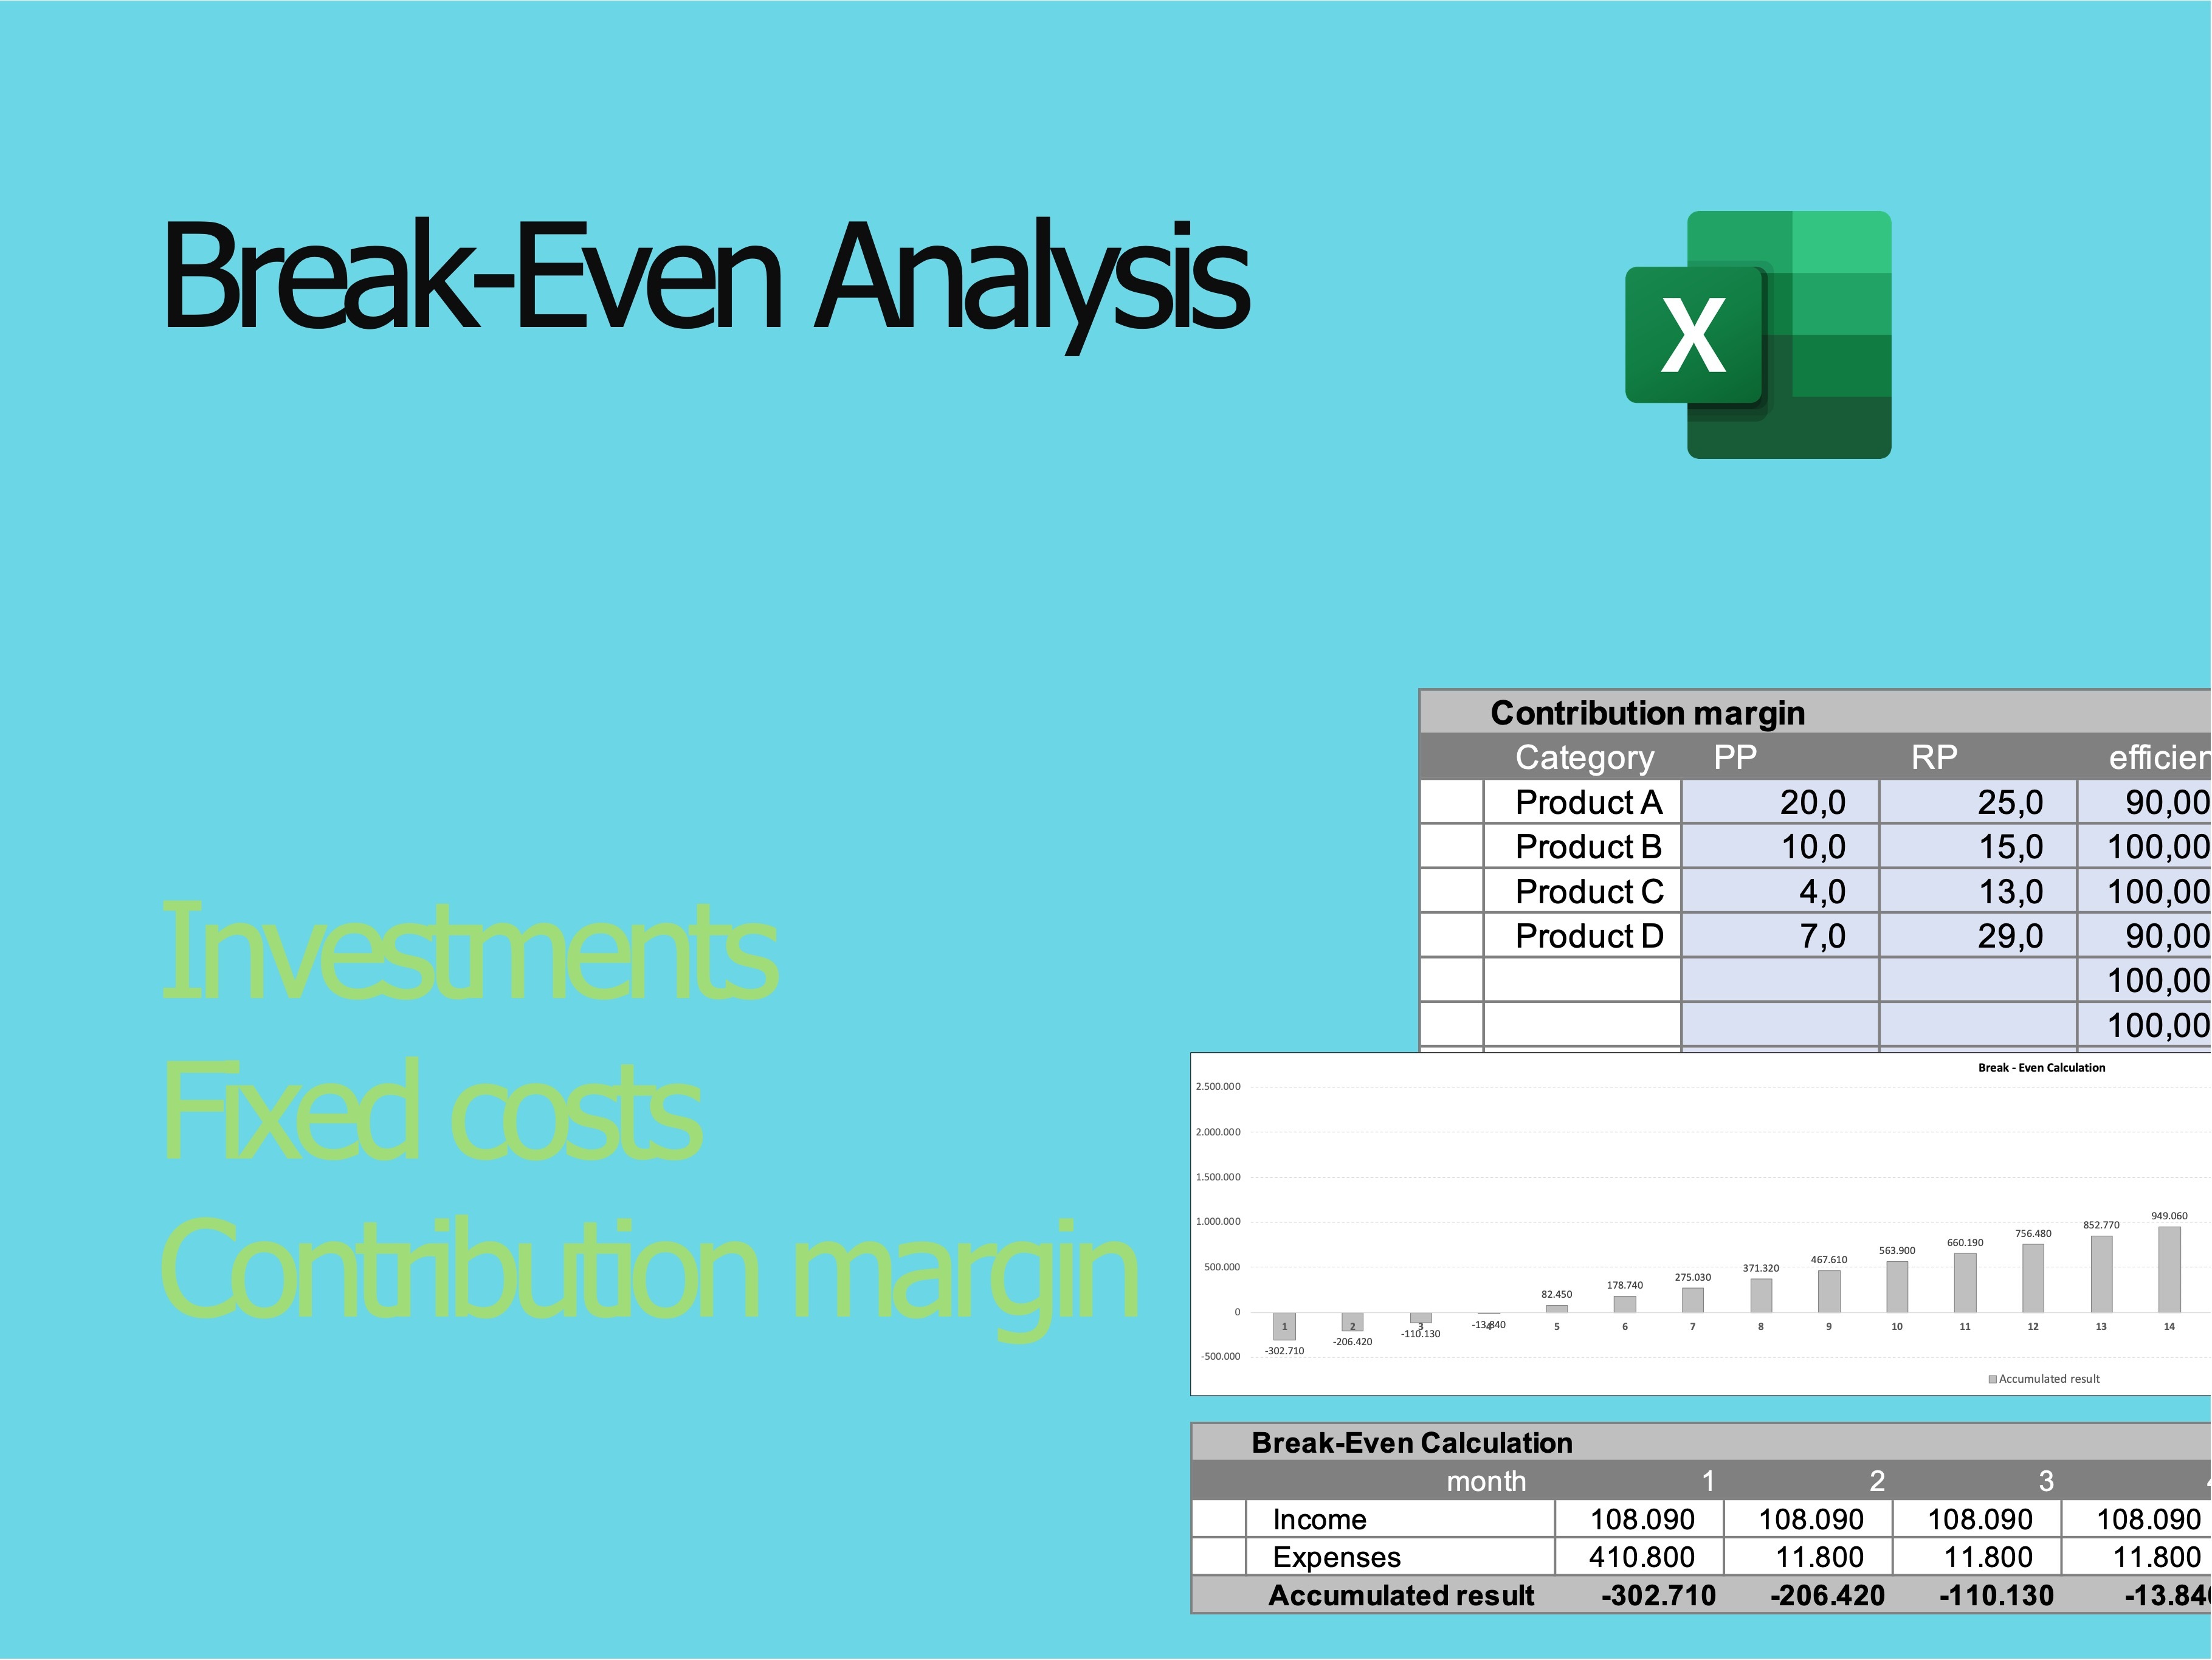
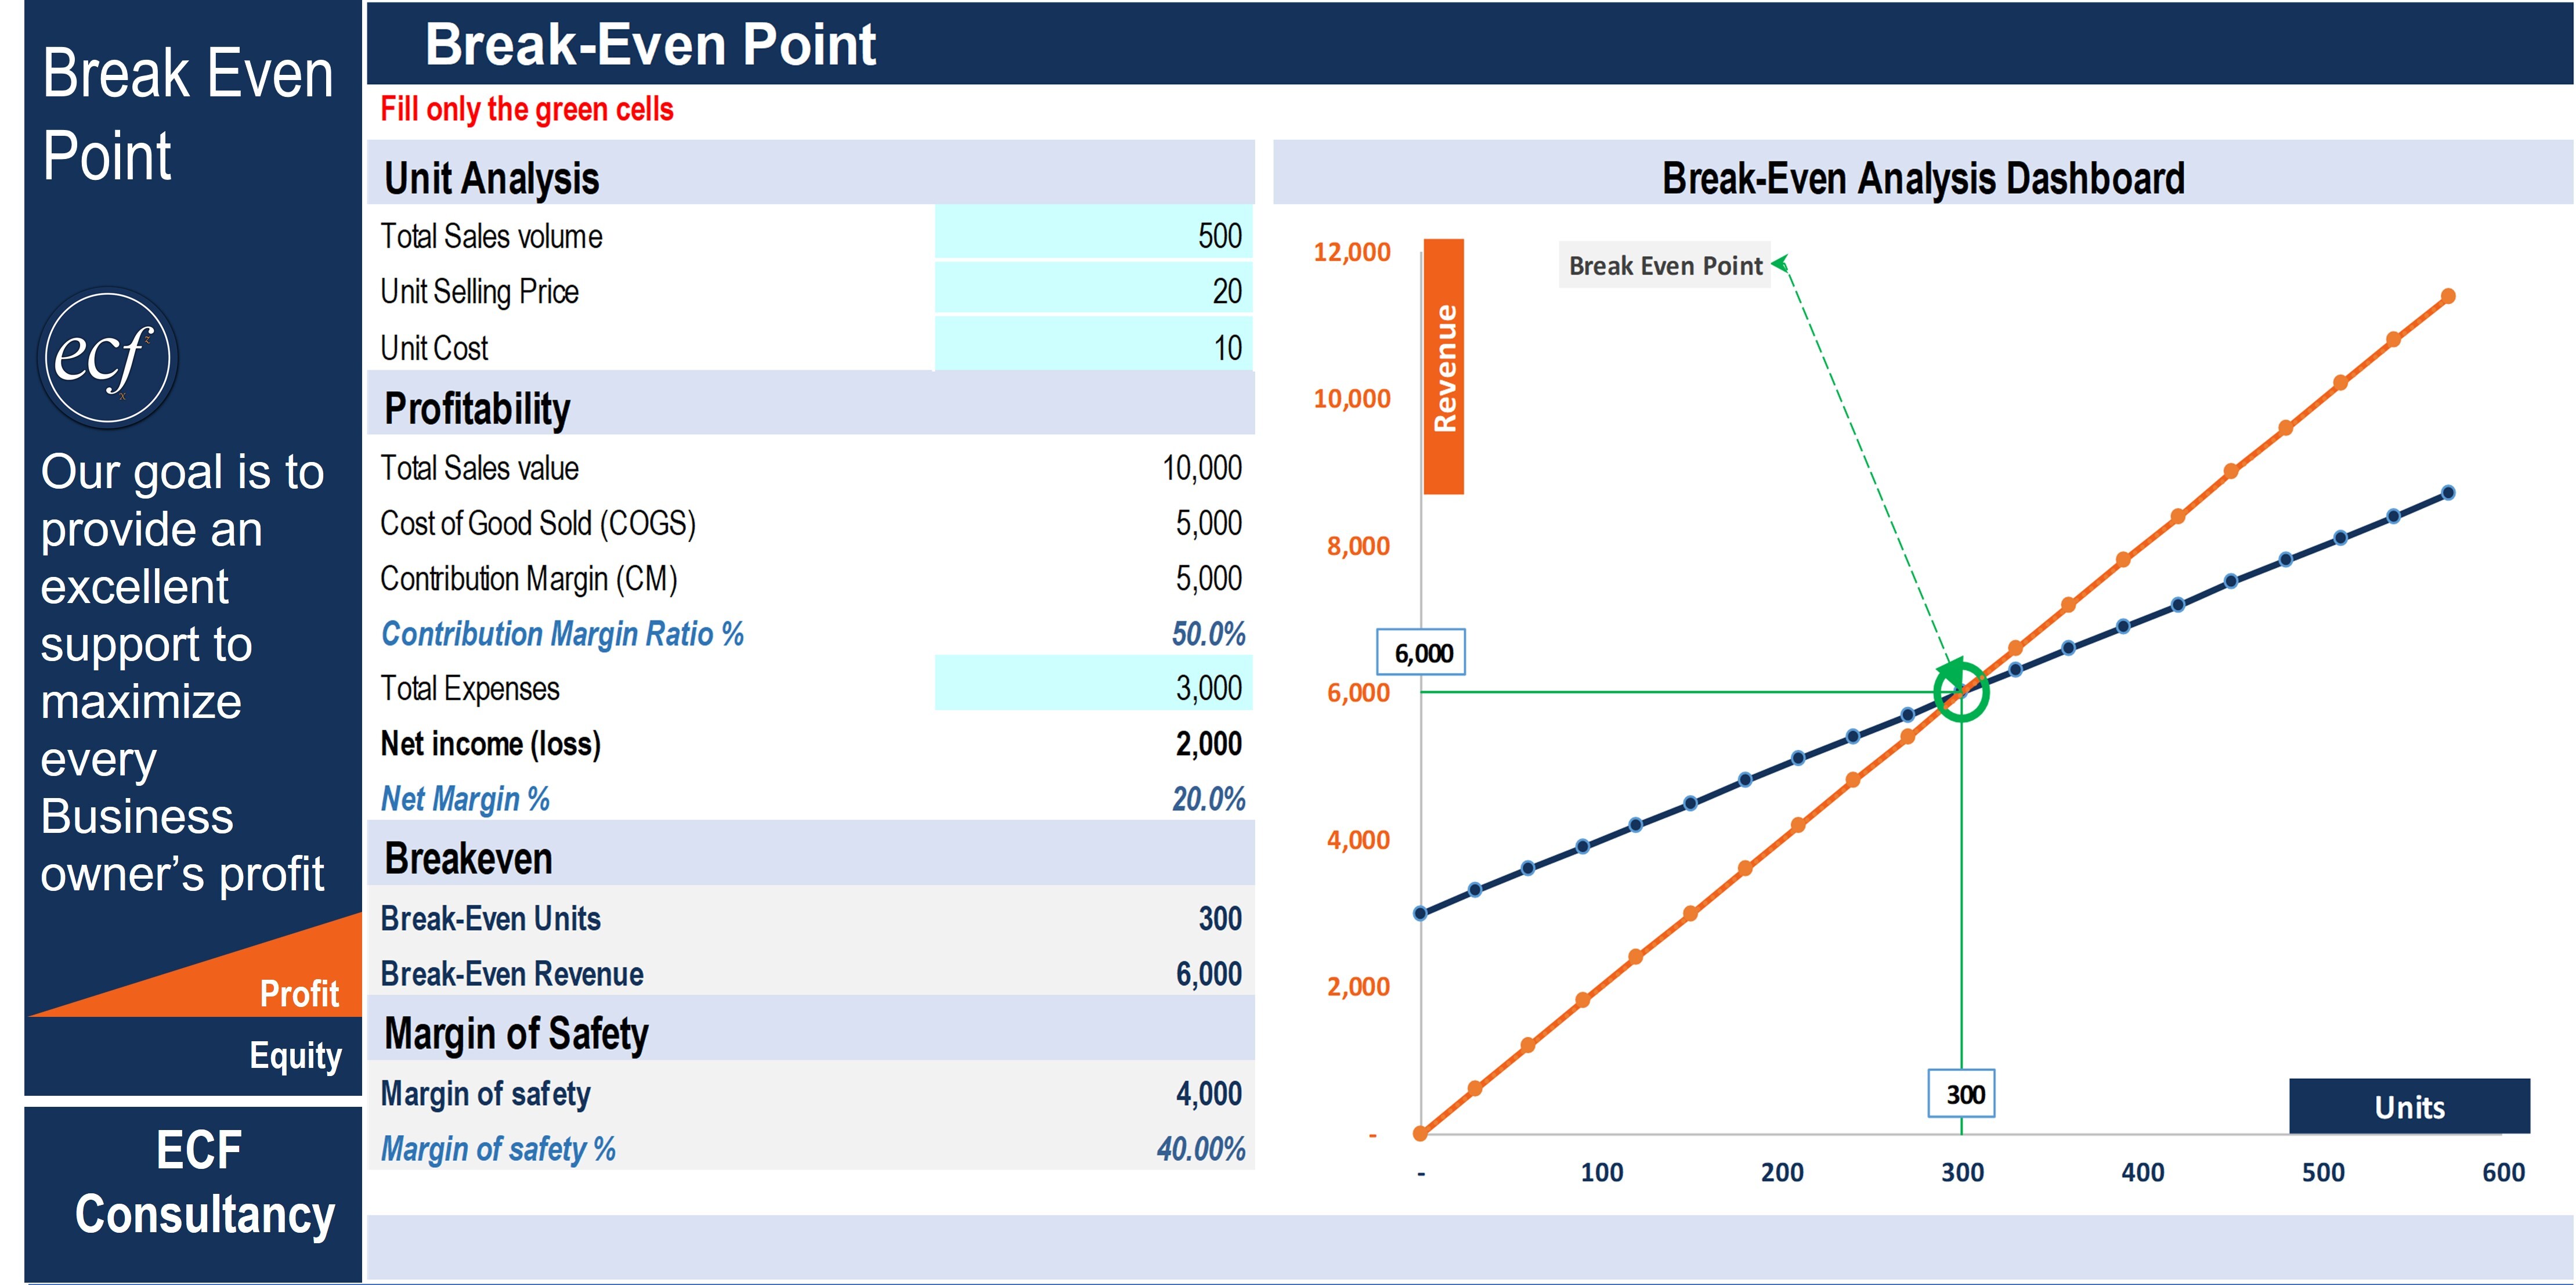
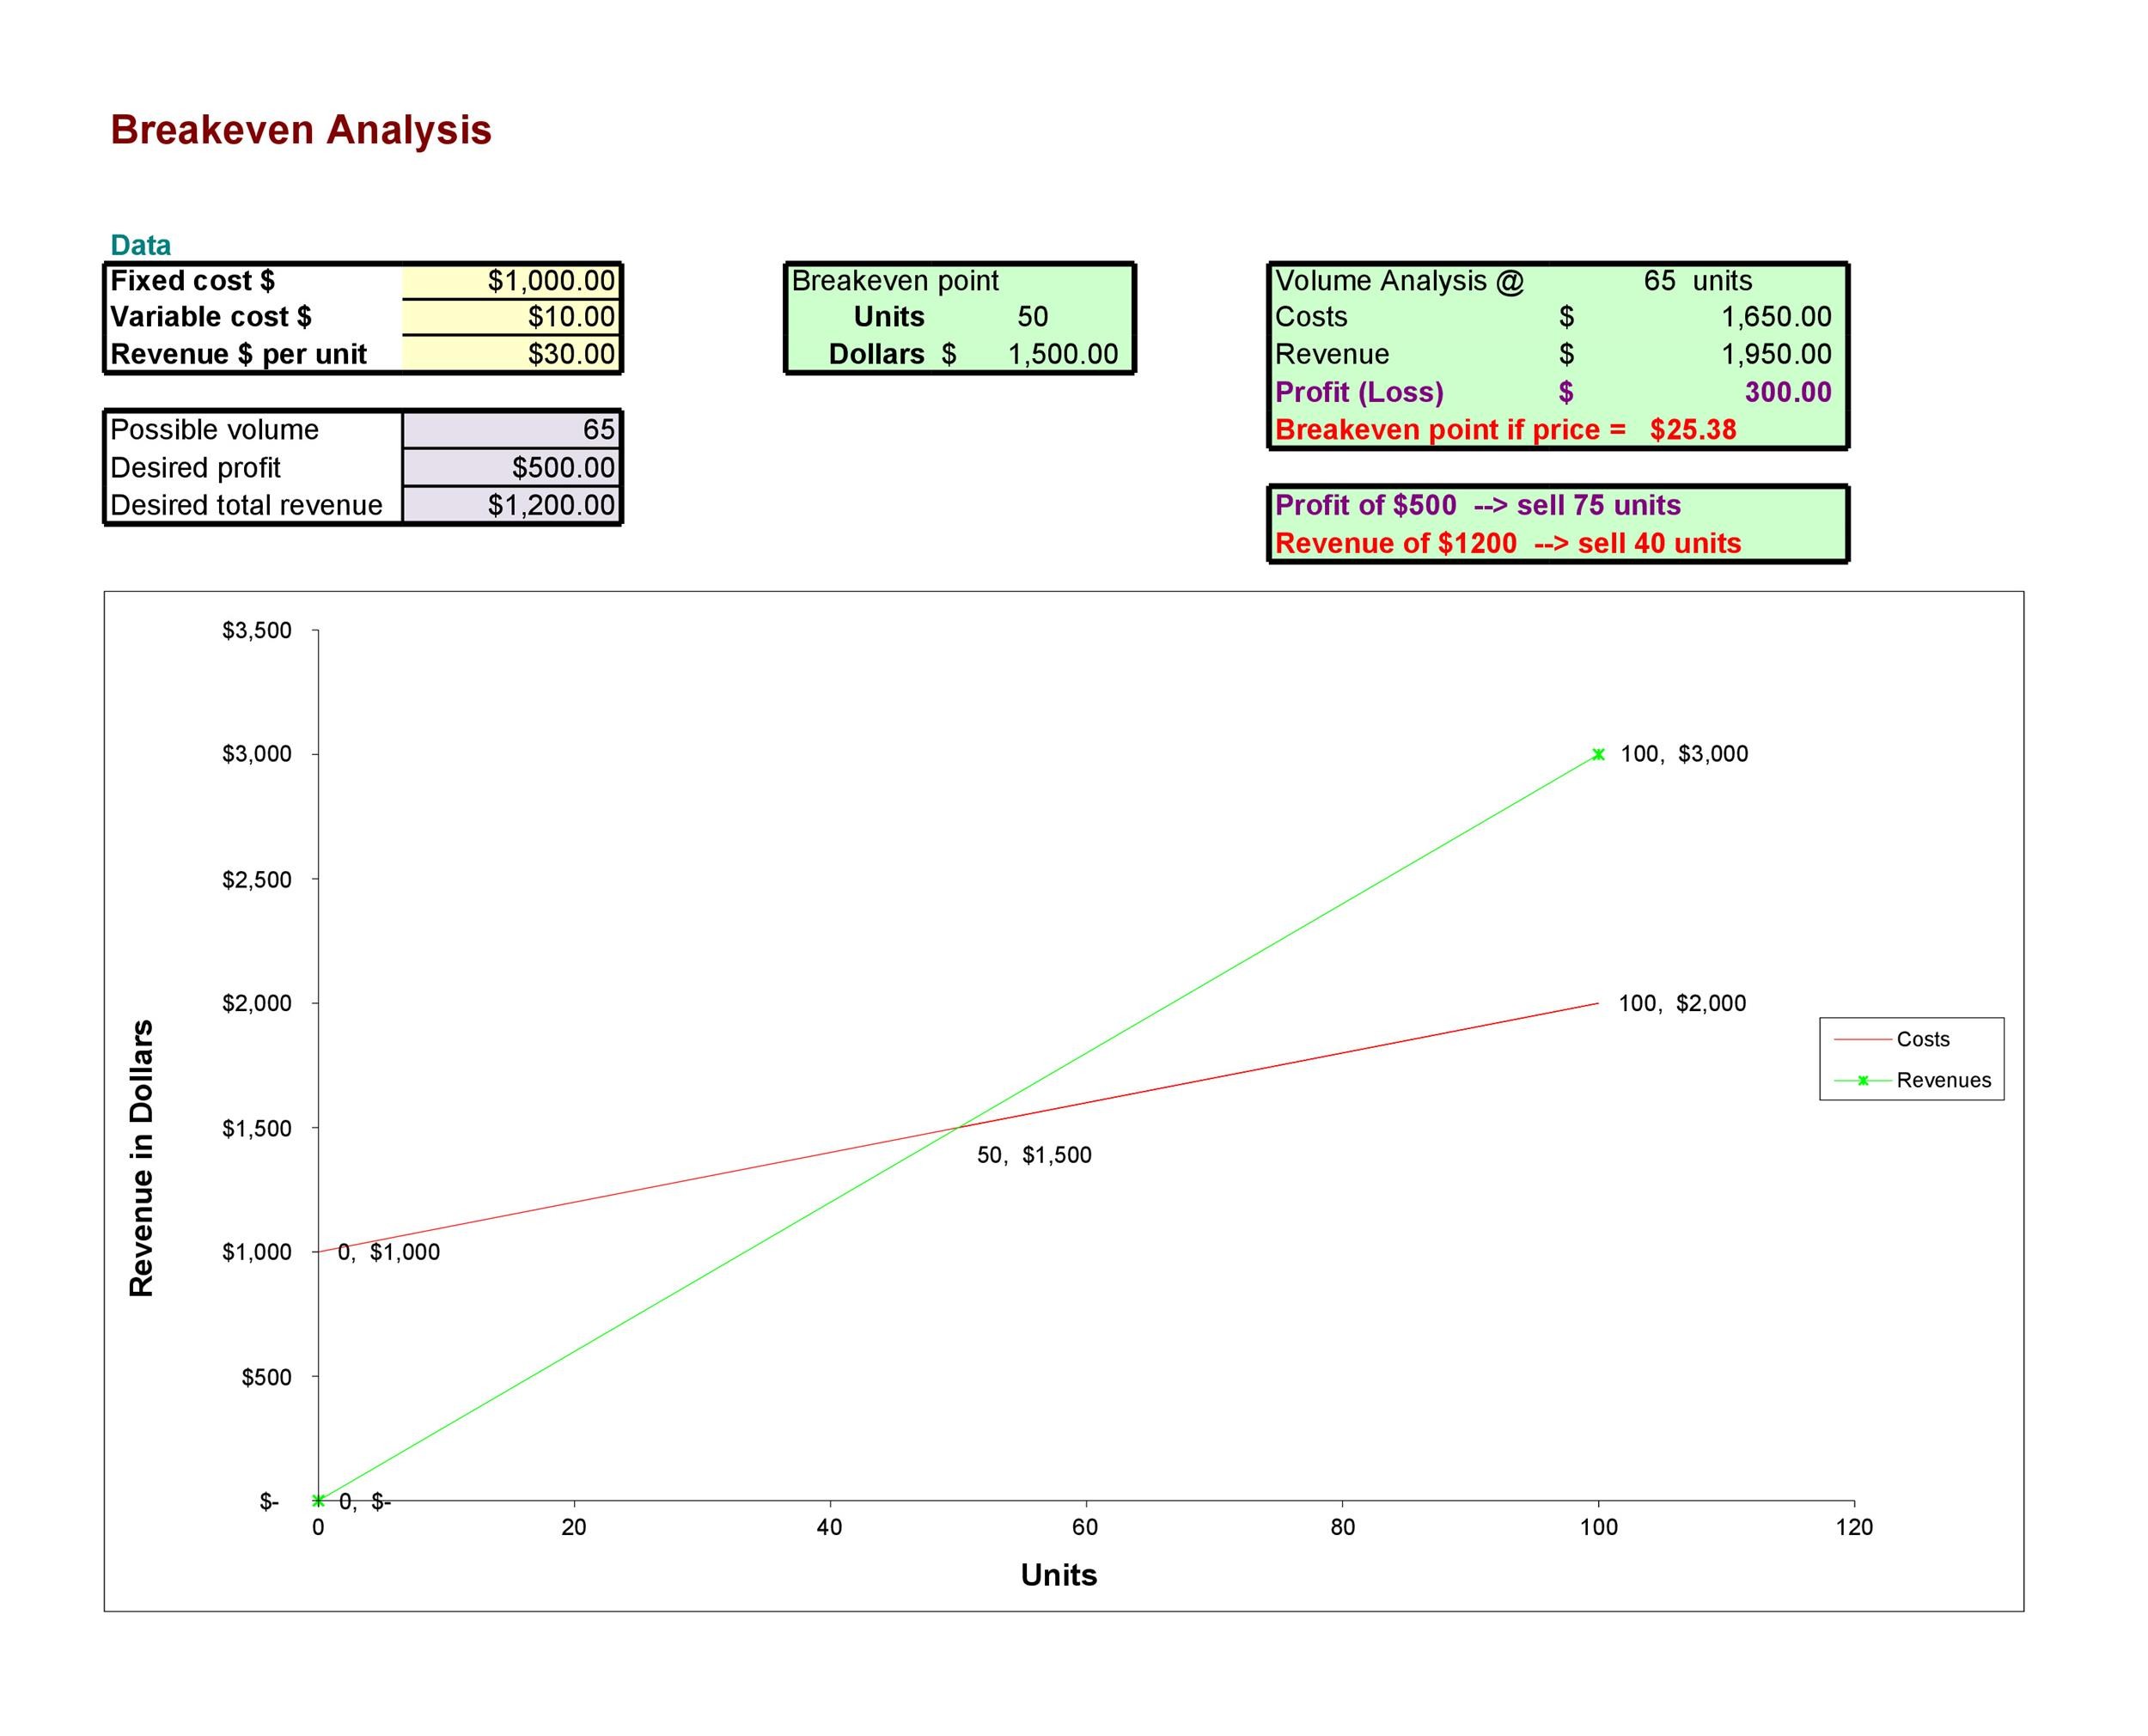
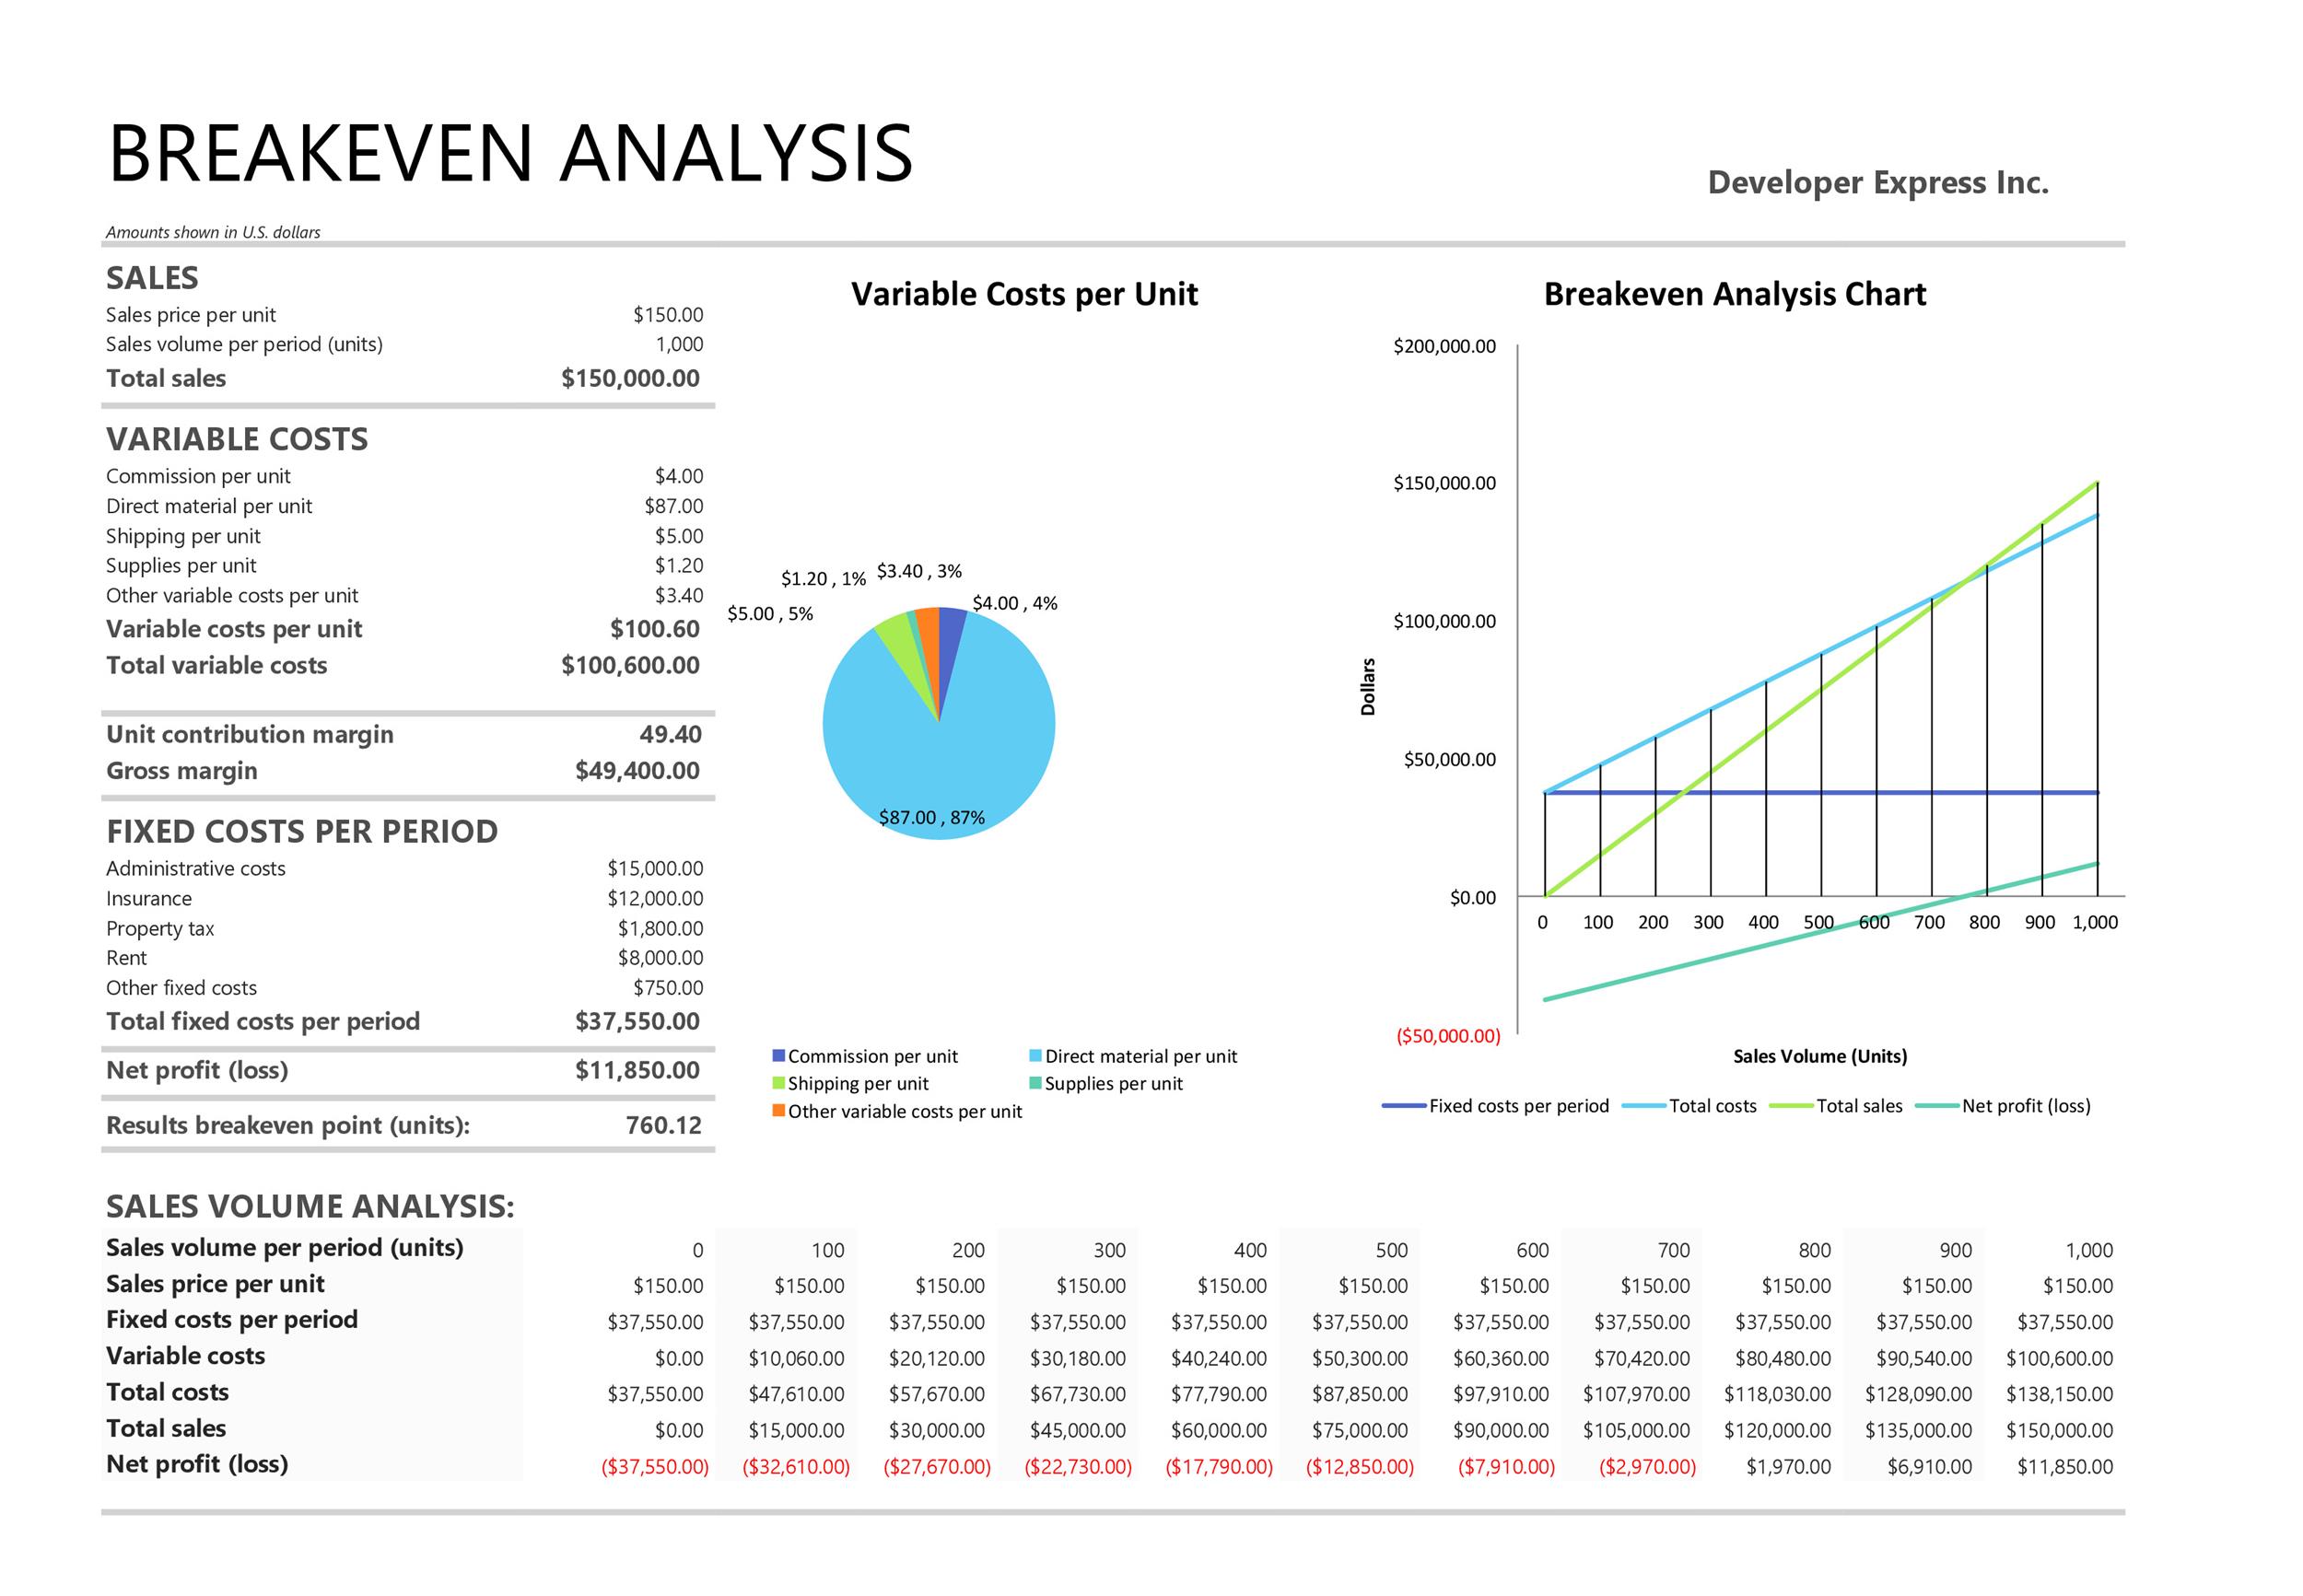
Break even analysis is a financial technique that determines the point at which total revenue exactly covers total costs, meaning no profit and no loss are incurred. In the context of Asian markets—where rapid growth, tight margins, and fierce competition are the norm—knowing the break even point helps you gauge the viability of new products, plan expansion, and negotiate with investors. The analysis typically distinguishes between fixed costs (rent, salaries, equipment depreciation) and variable costs (materials, commissions, utilities that change with production volume). By plotting these elements on a chart, you can visually see where the revenue line crosses the total cost line, revealing the critical sales volume needed to start generating profit.
Why Use an Excel Break Even Analysis Template?
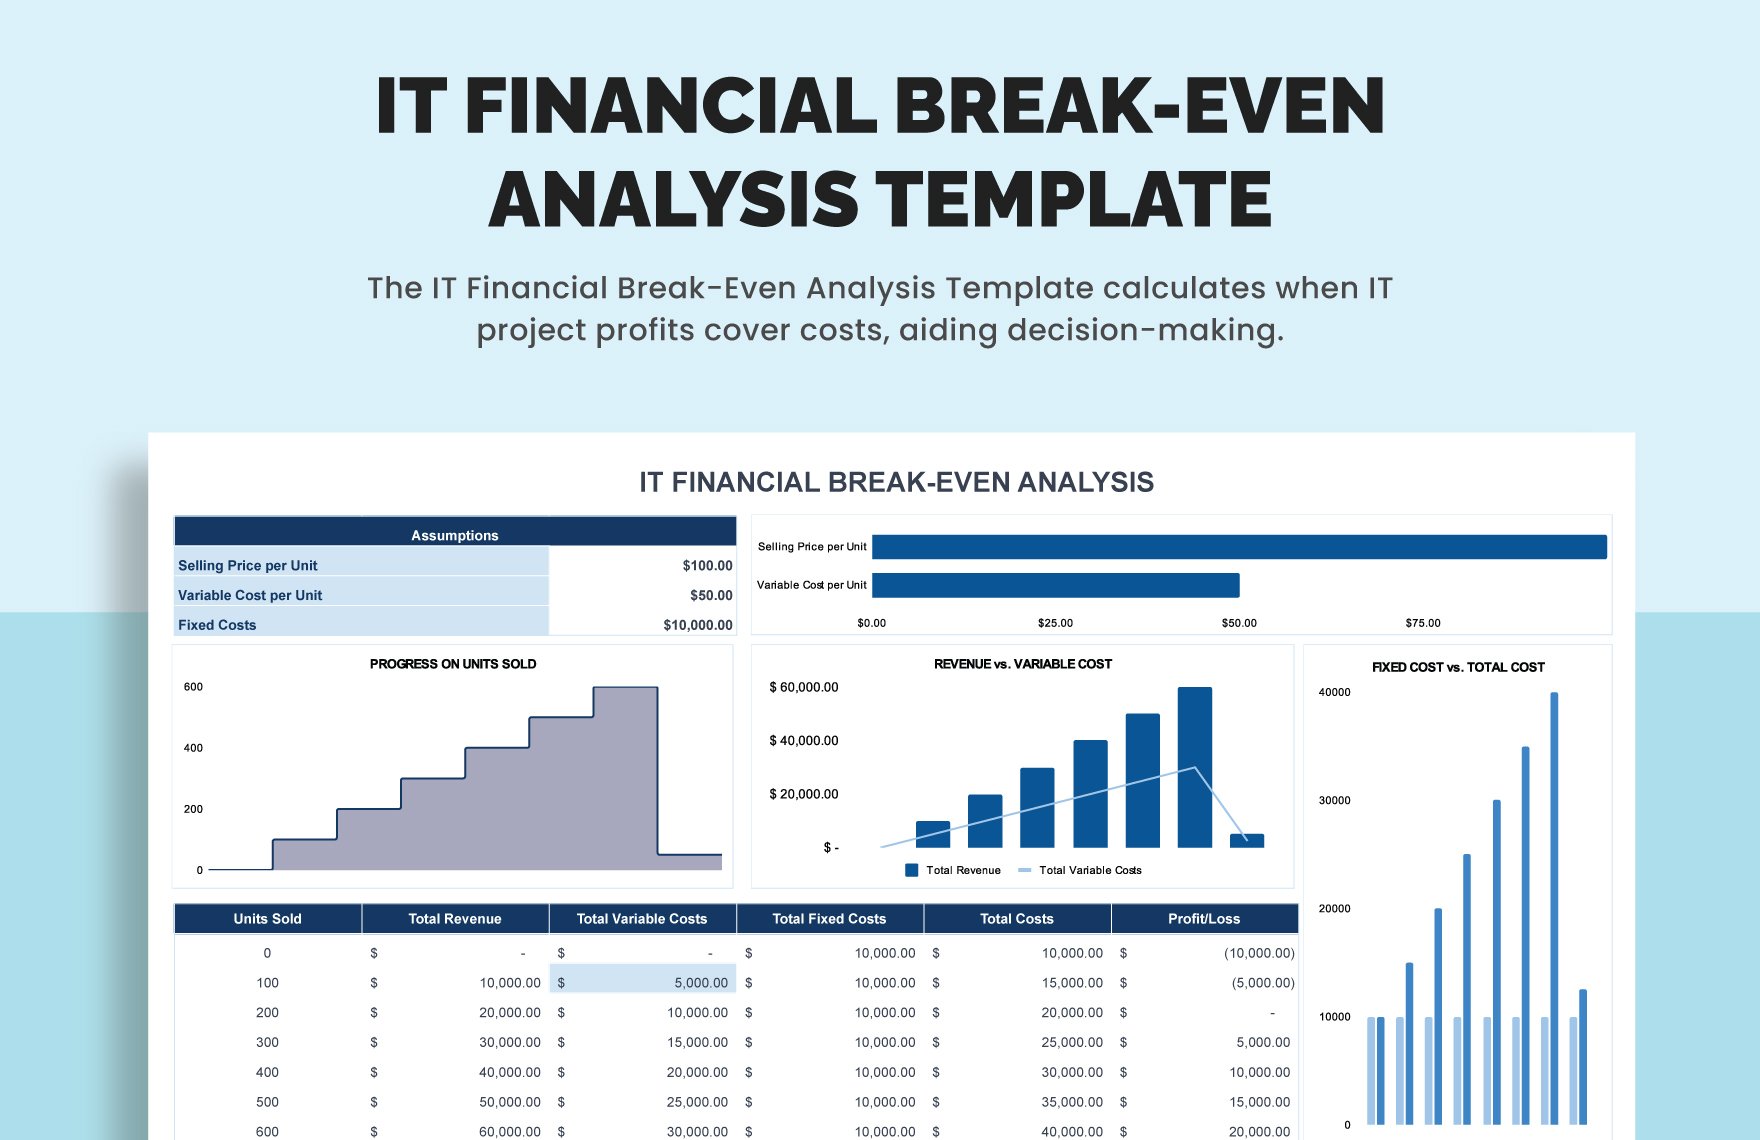
Excel remains the go‑to platform for financial modeling in Asia because it is widely available, familiar to finance teams, and flexible enough to handle complex scenarios. An Excel Break Even Analysis Template streamlines the process by providing a pre‑designed layout with built‑in formulas, data validation, and dynamic charts. This reduces the risk of manual errors, saves countless hours that would otherwise be spent recreating the same calculations, and allows you to focus on strategic insights rather than number crunching. Moreover, the template can be easily shared across multinational teams, customized for local currency, tax rules, or specific industry cost structures, and integrated with other Excel tools such as pivot tables and scenario managers.
Key Components of a Powerful Template
Fixed Costs
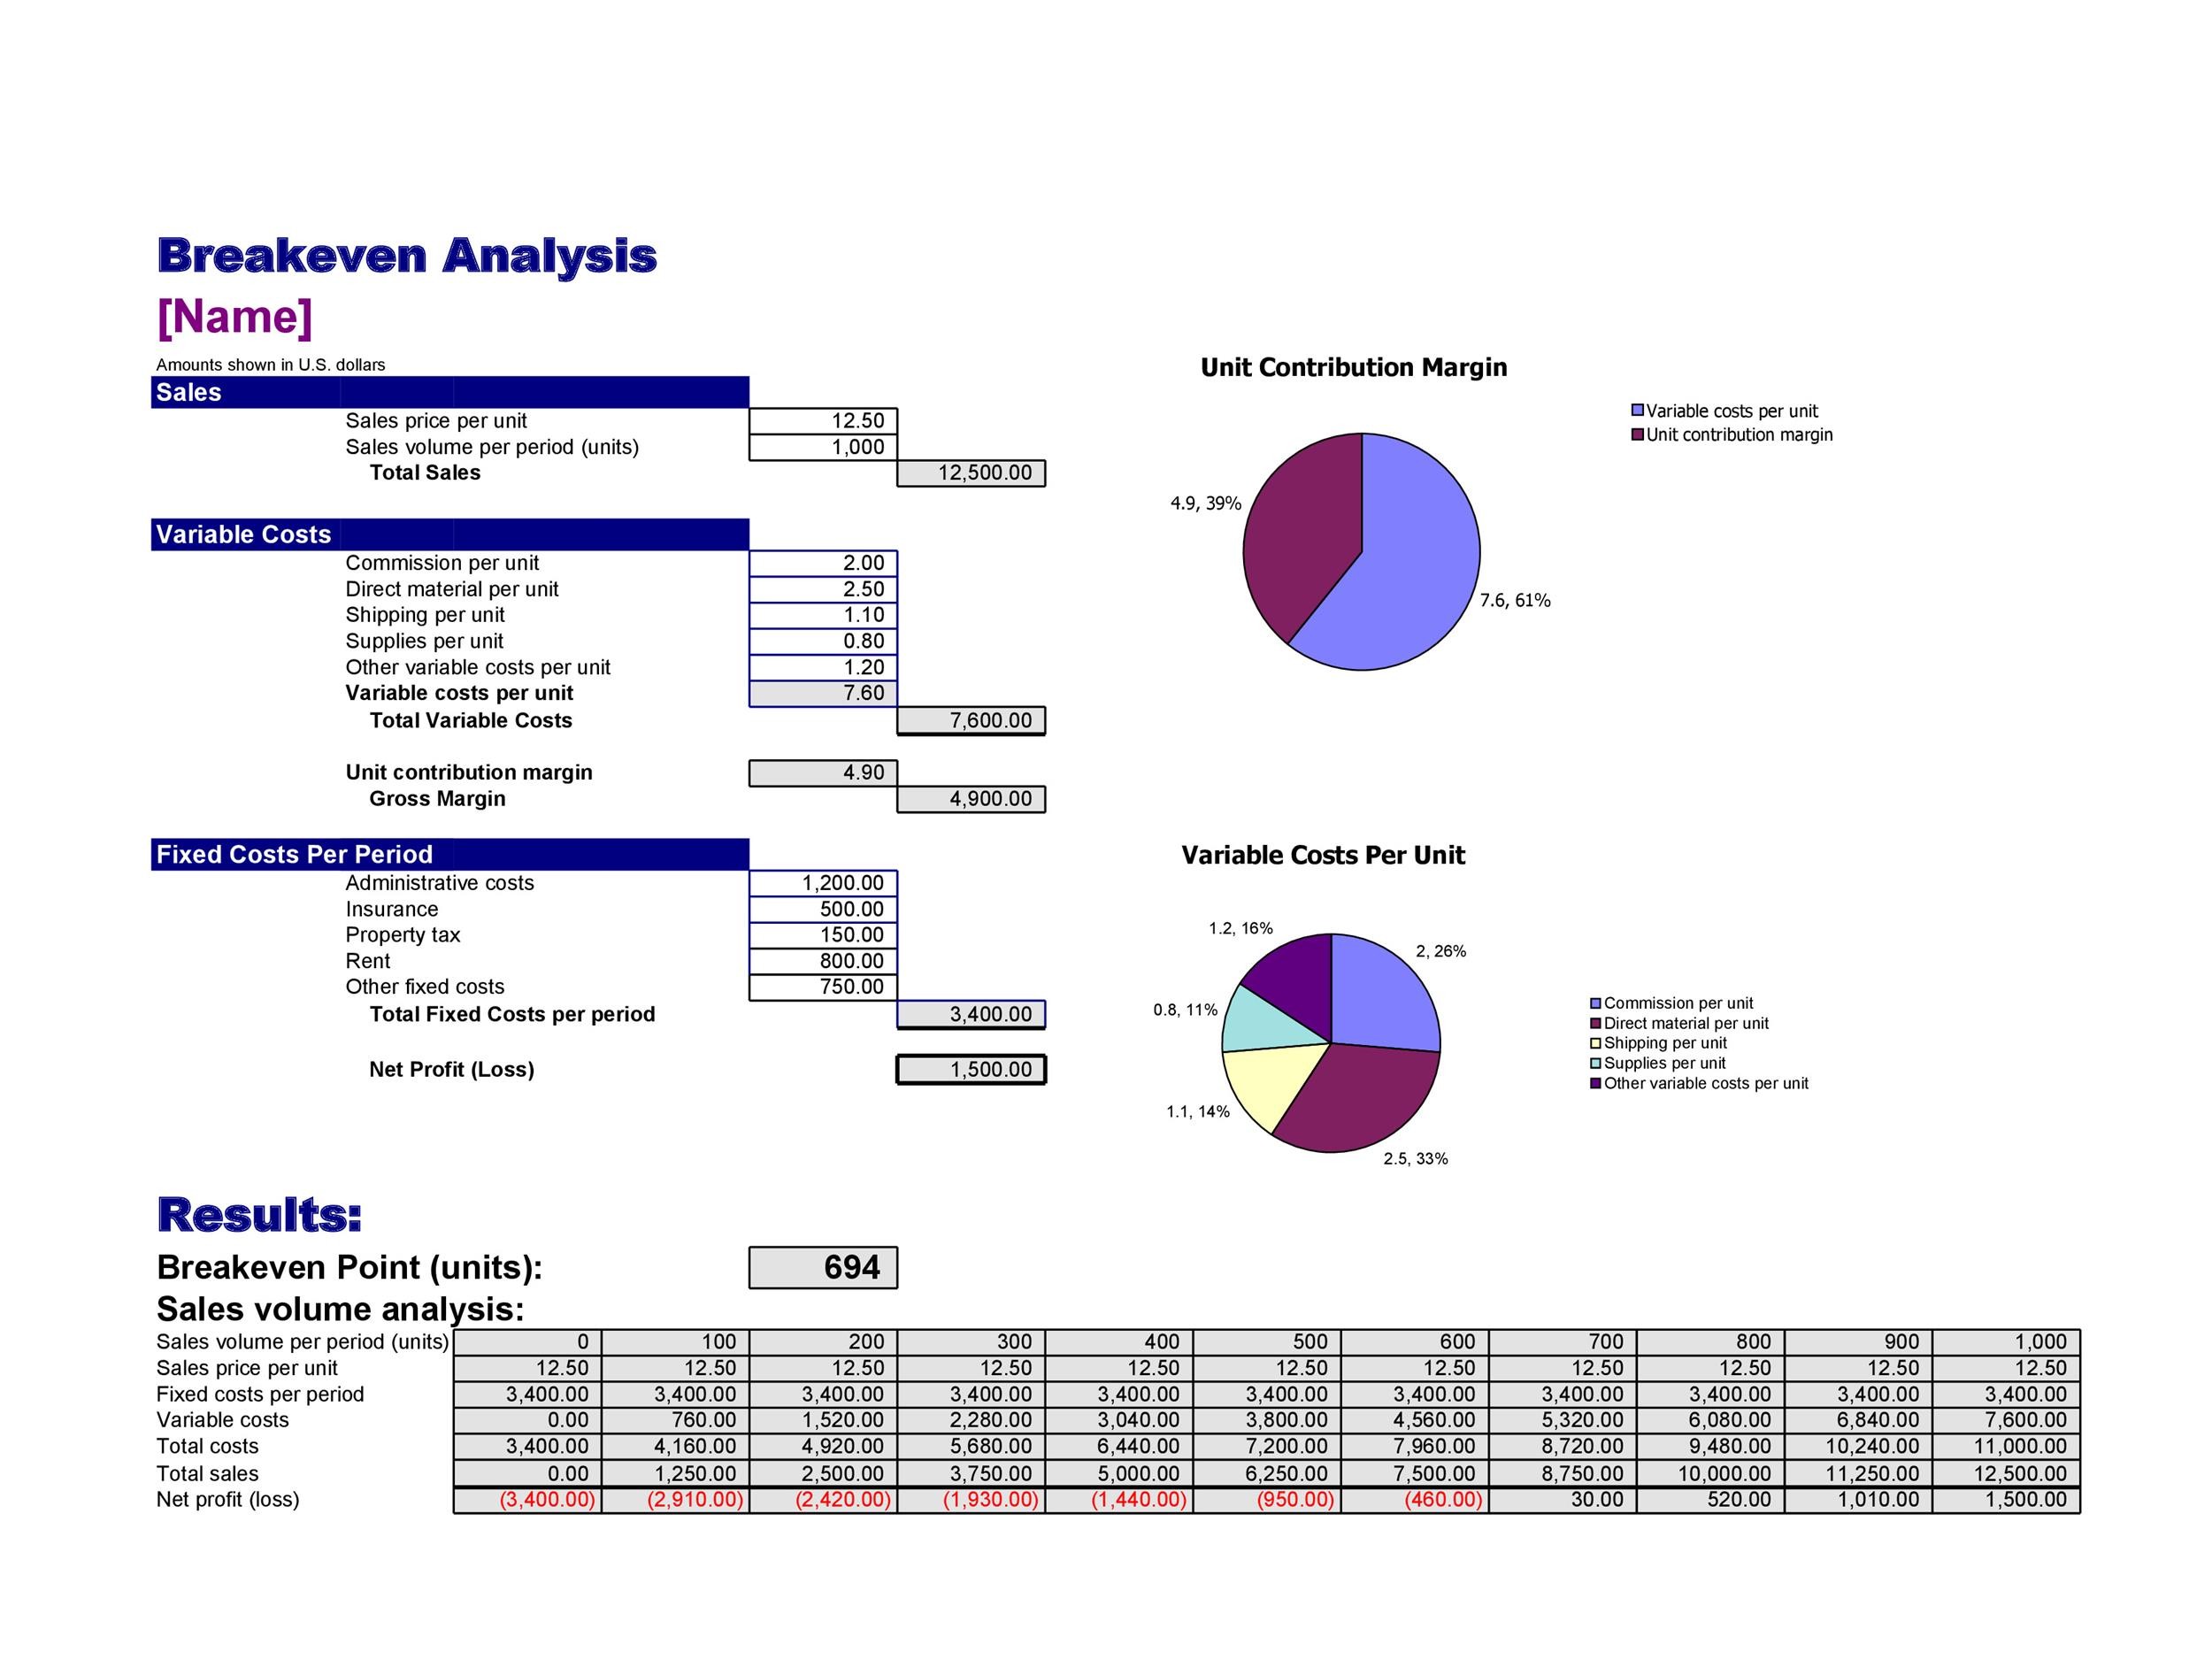
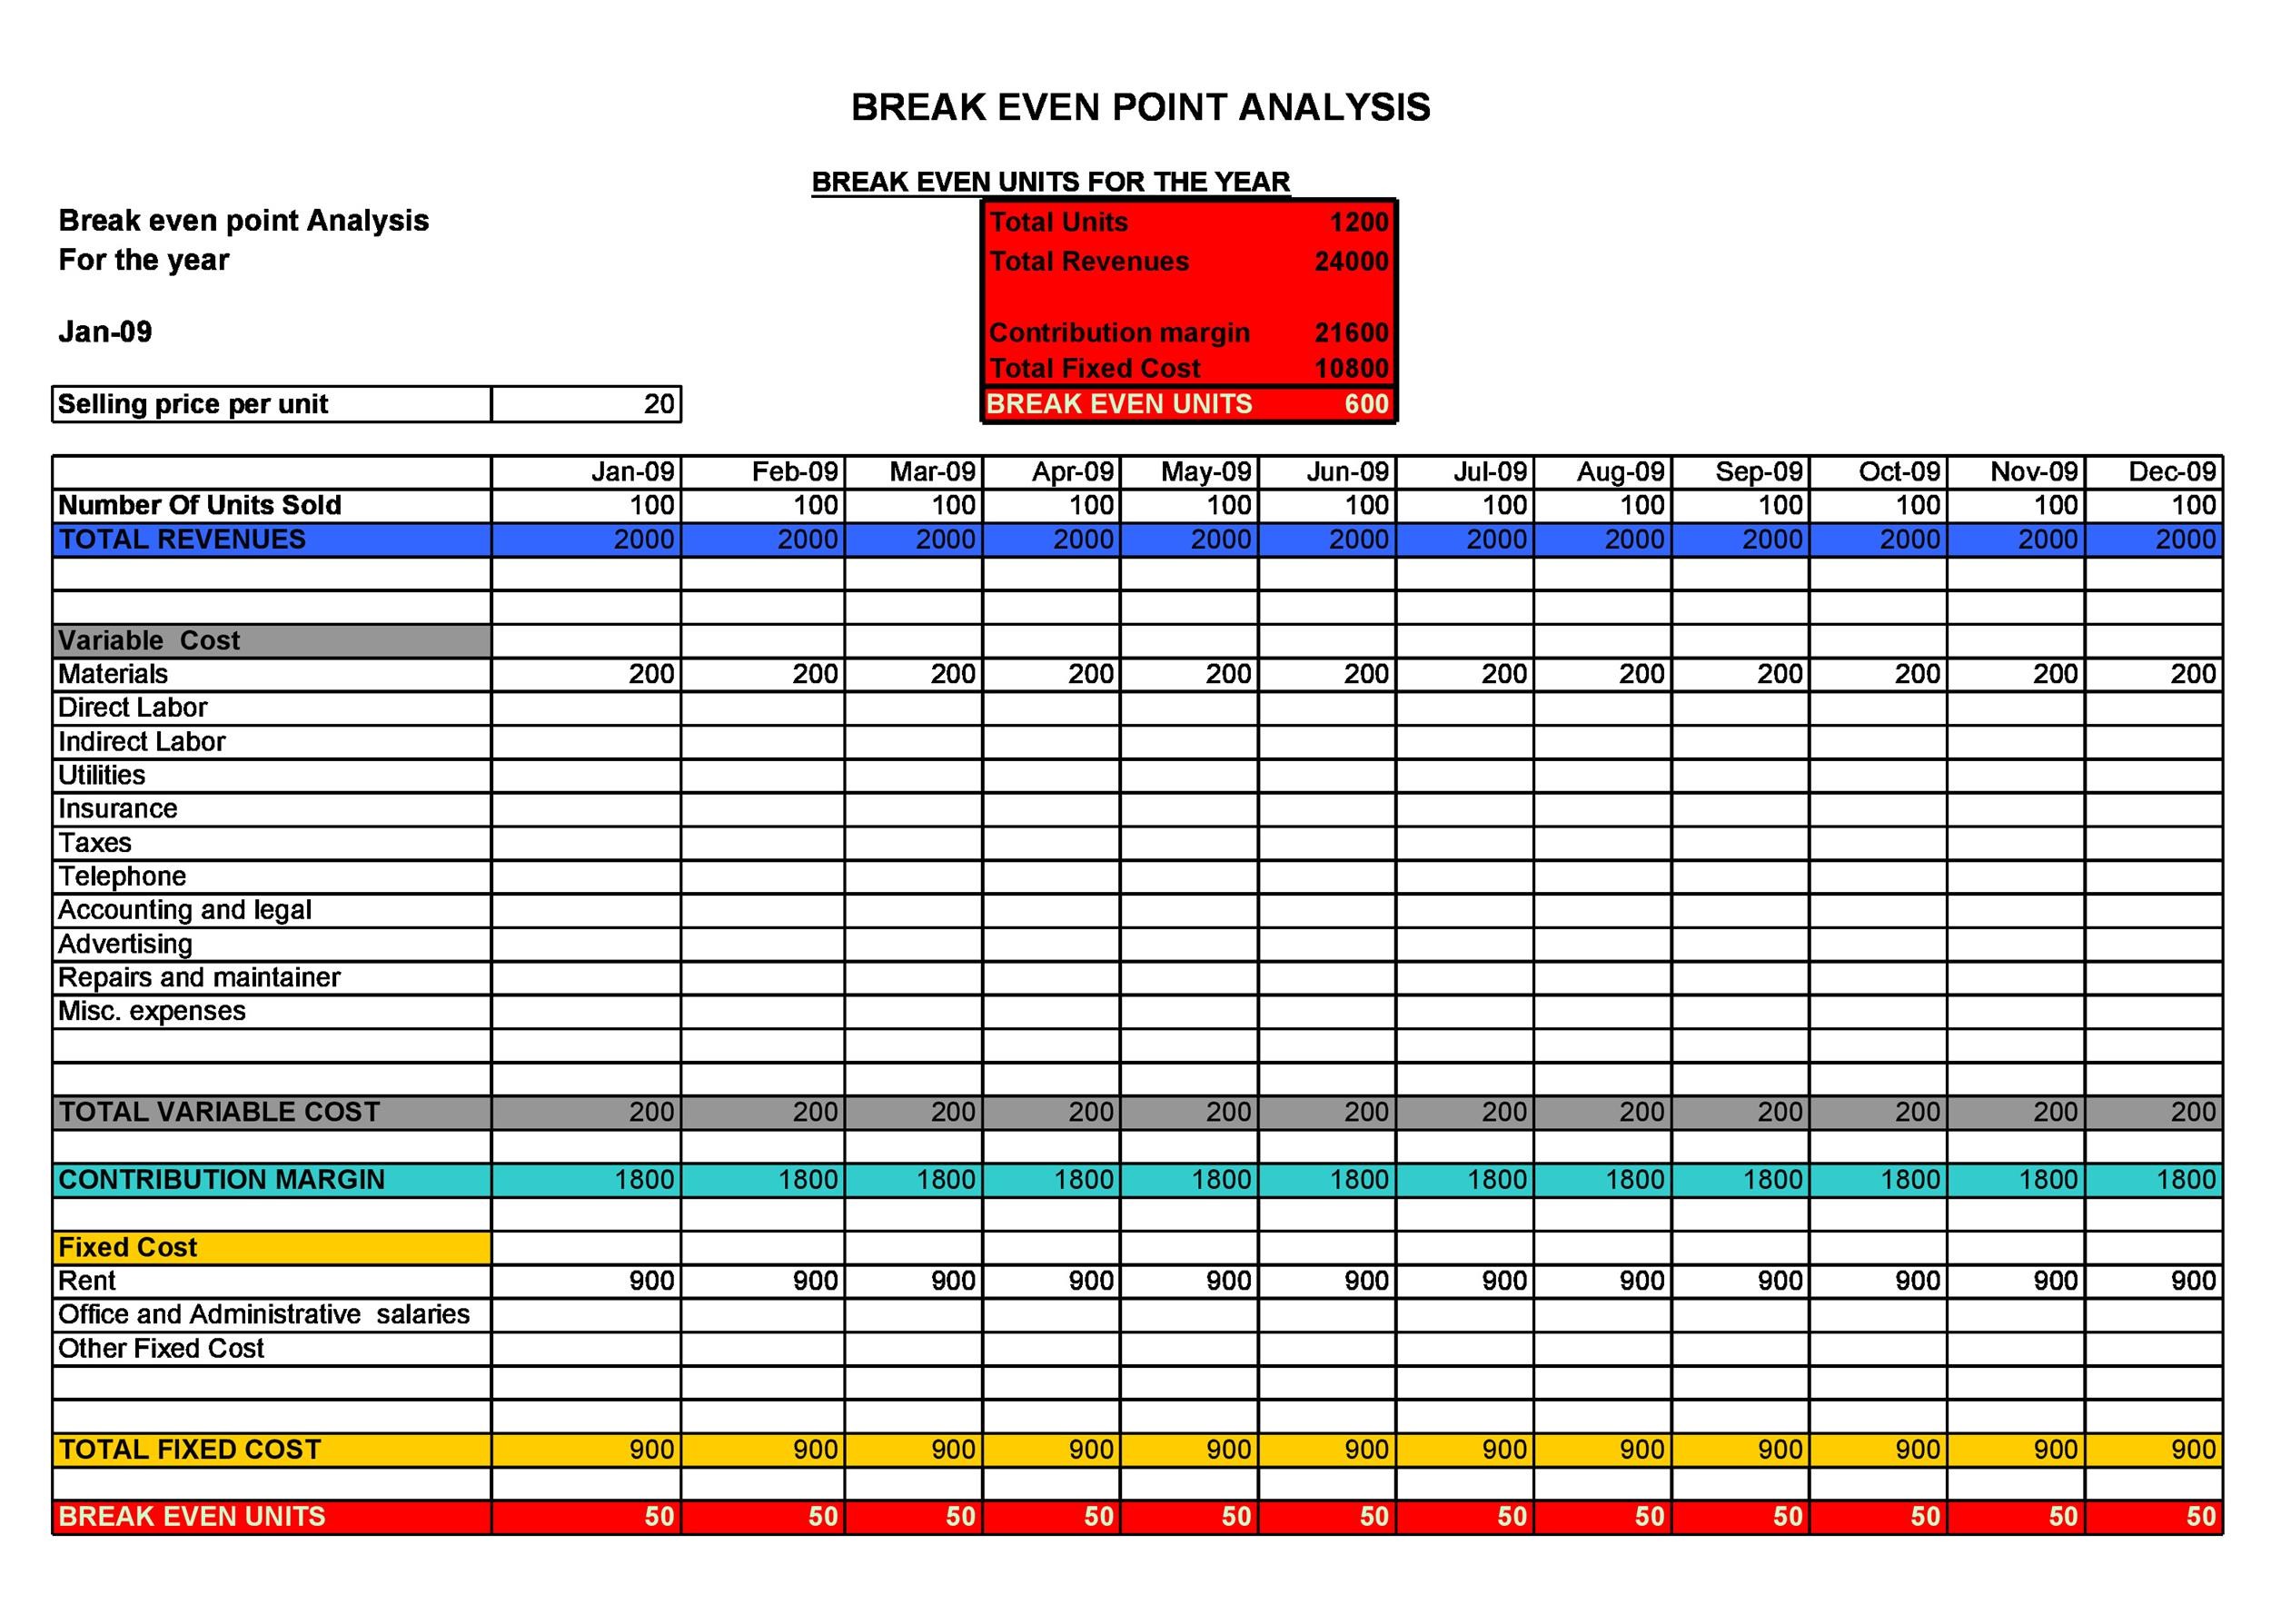
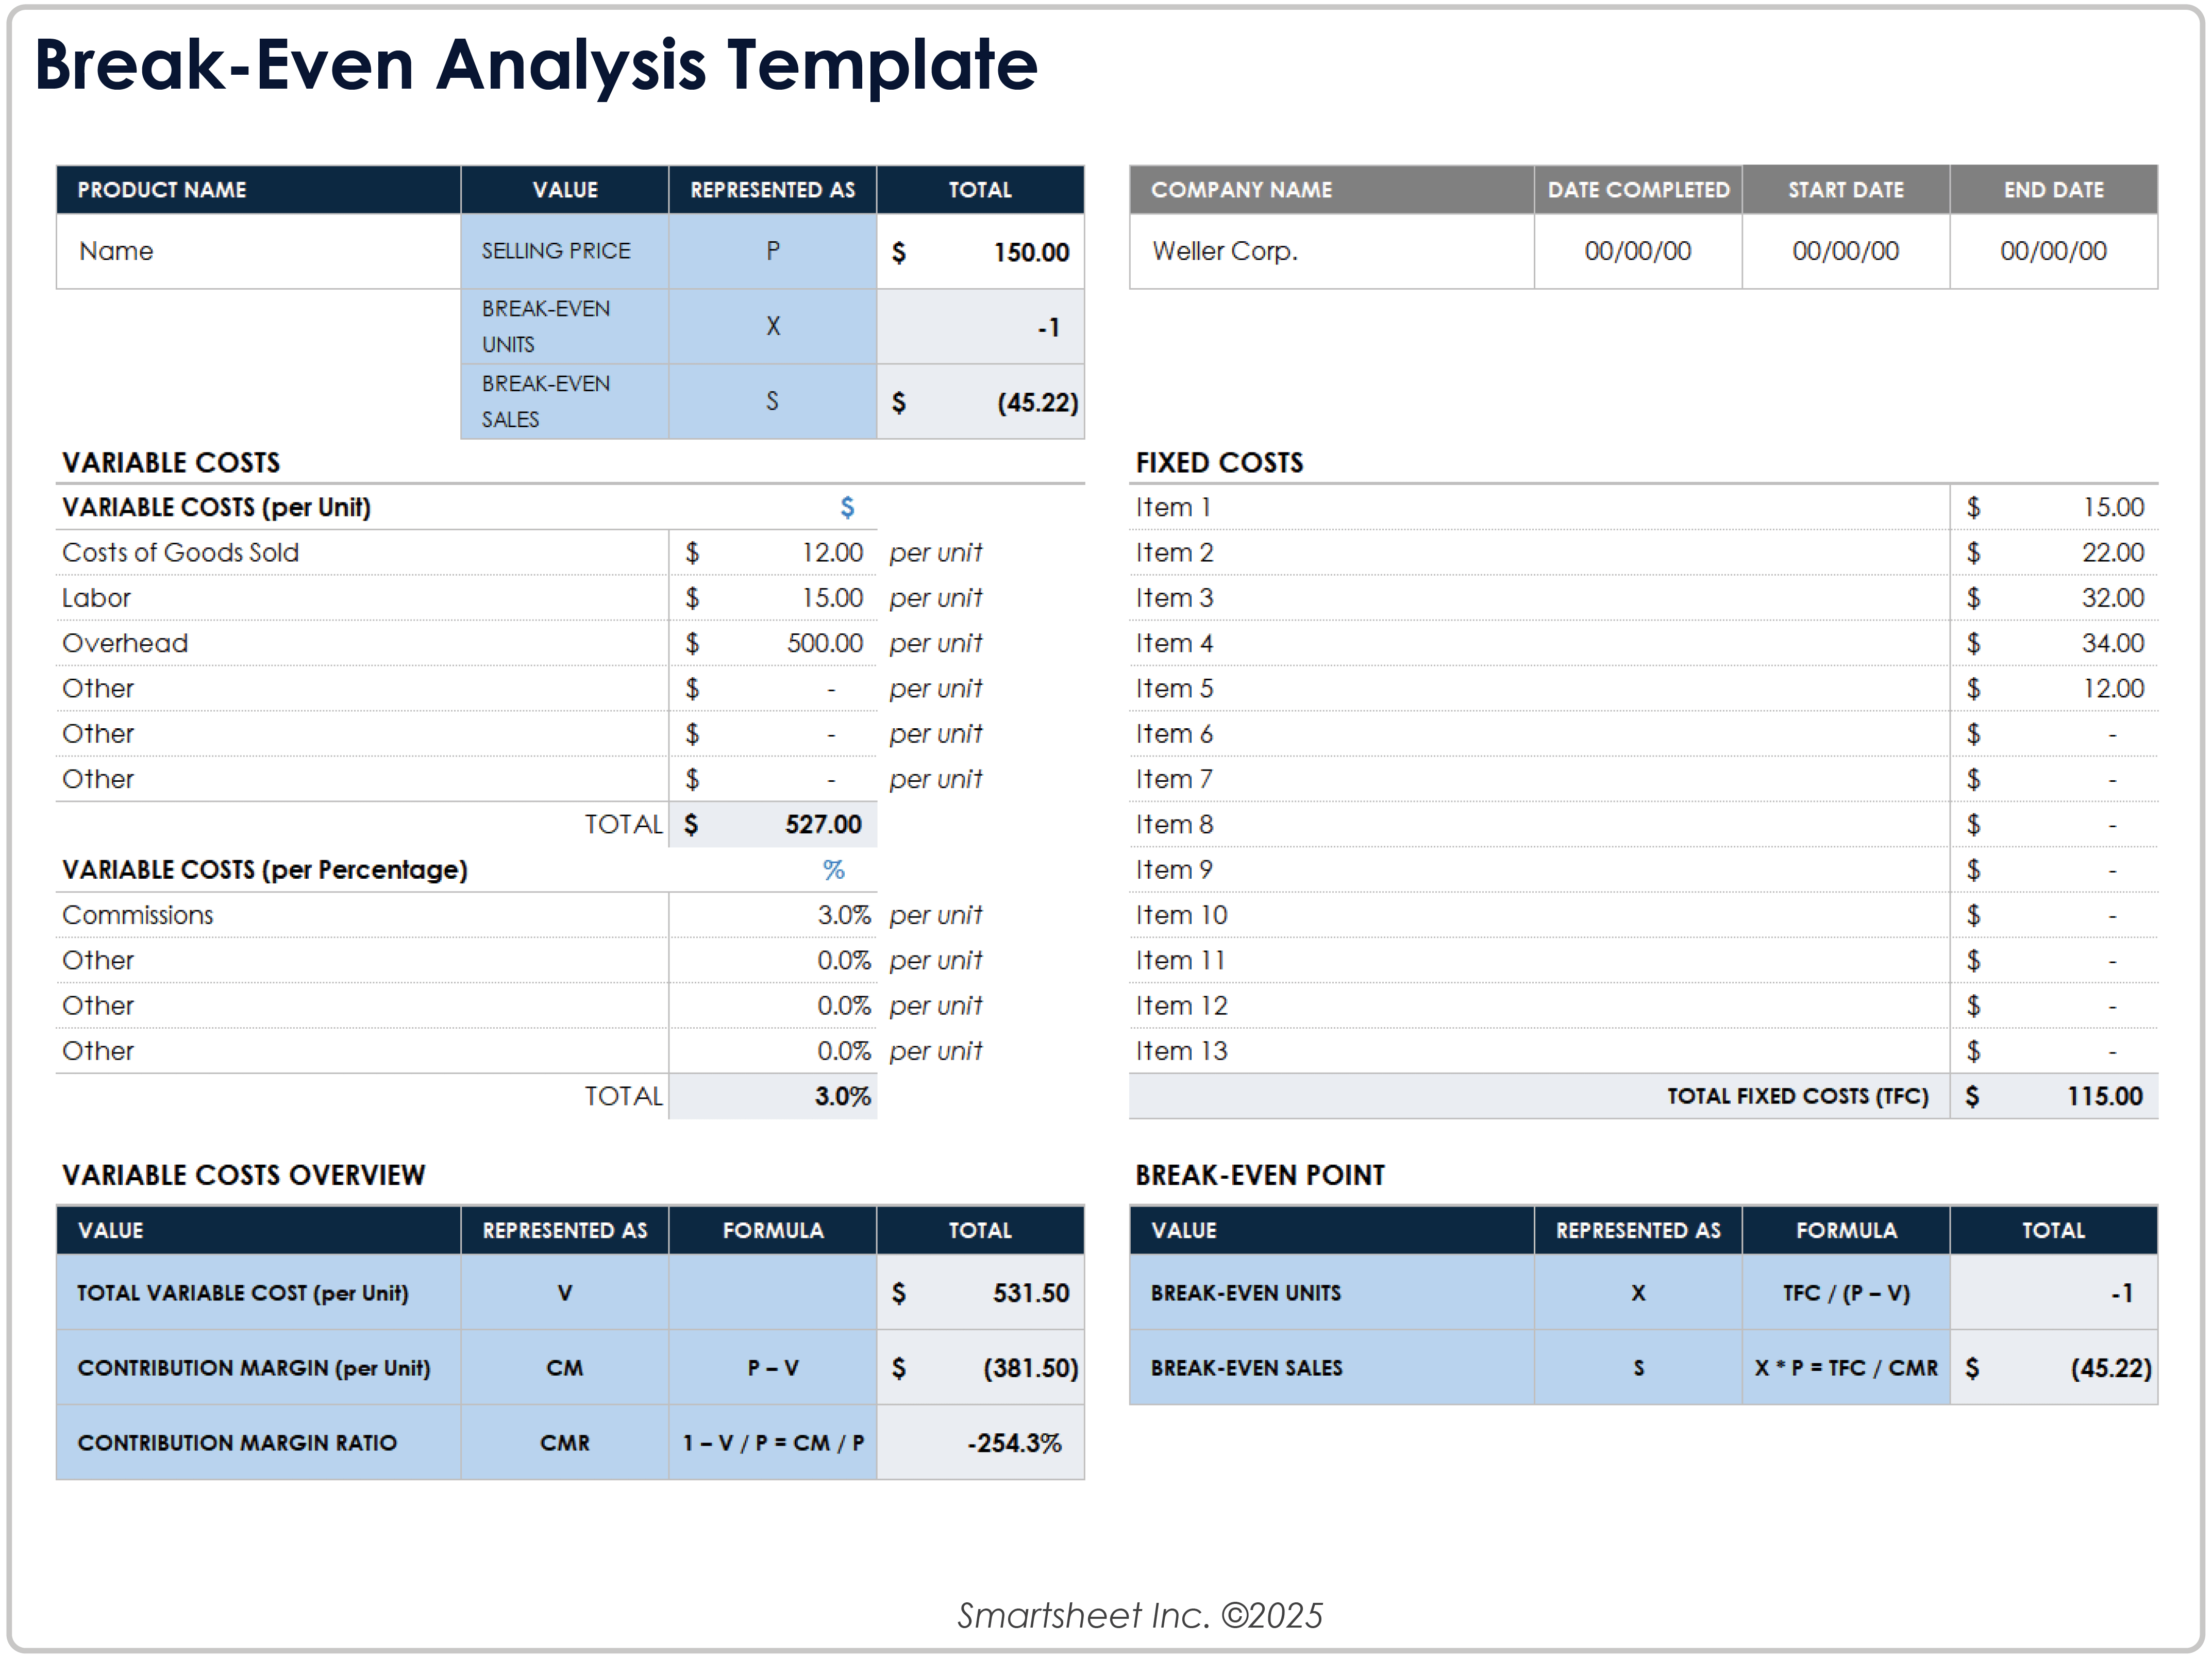
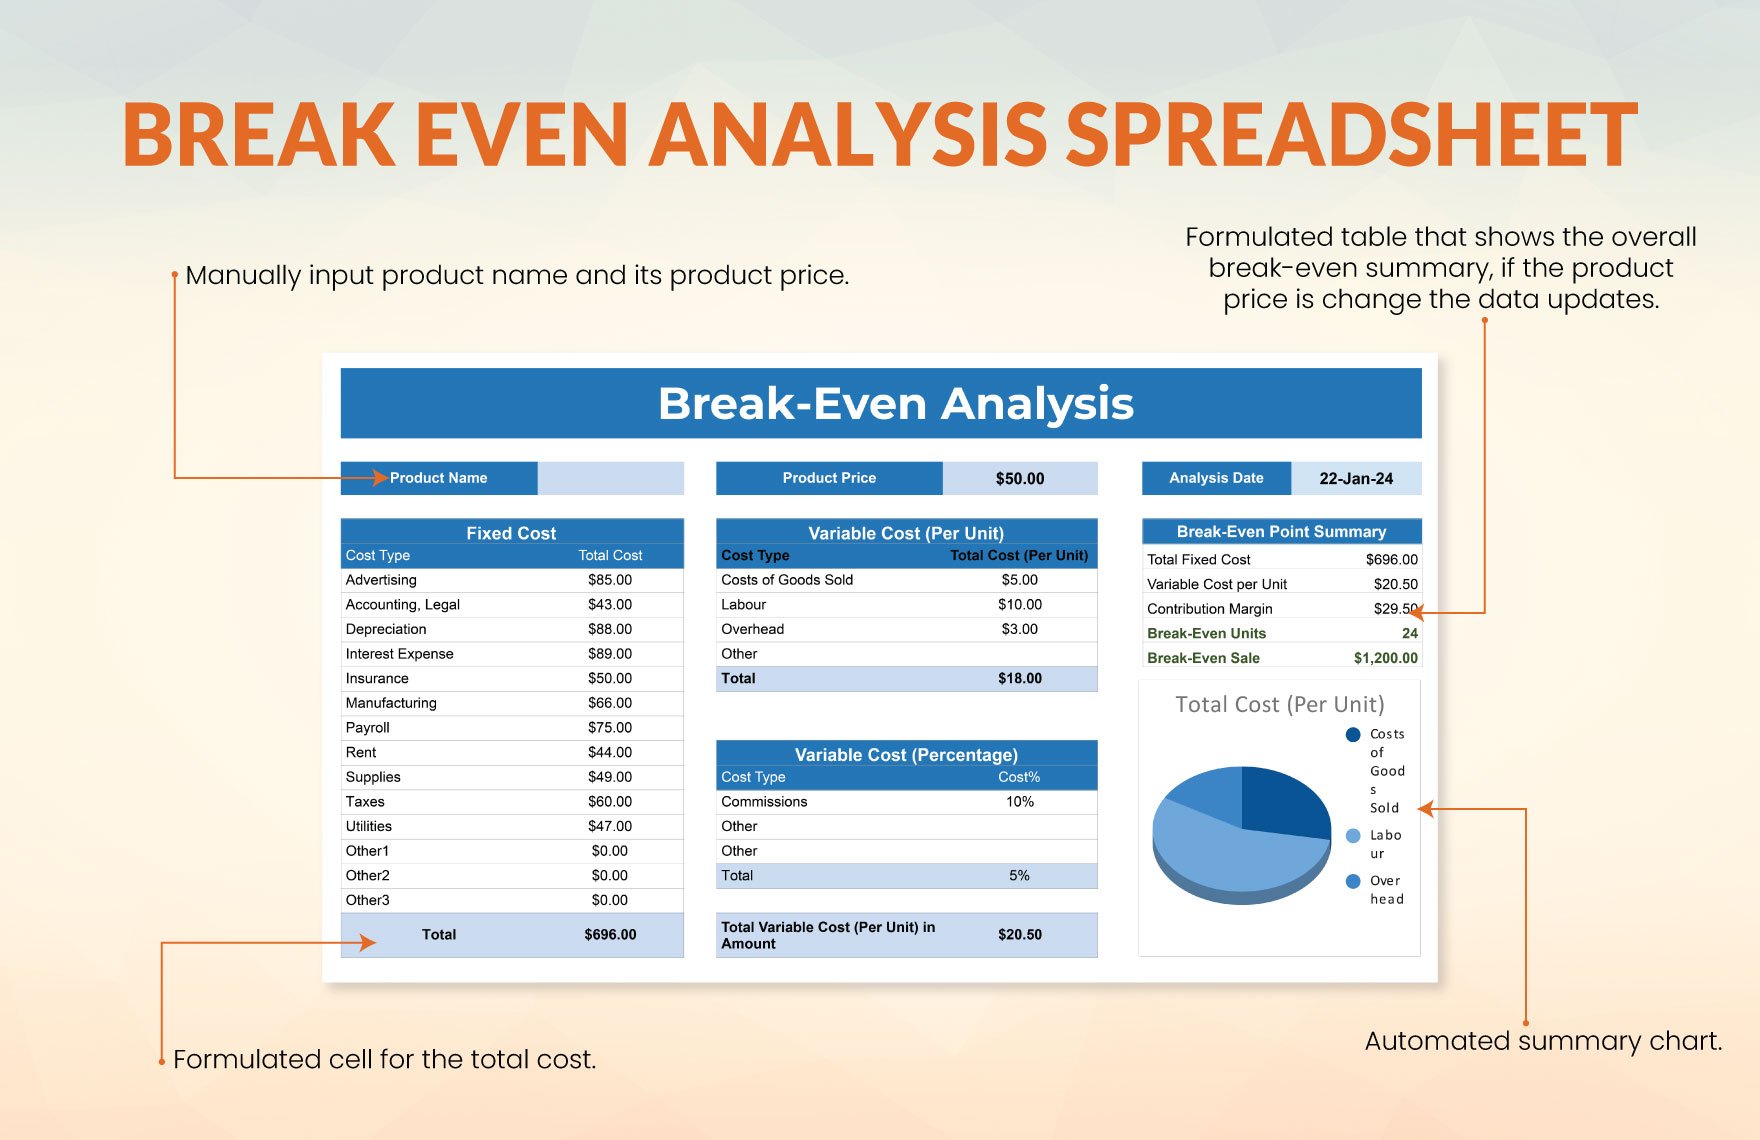
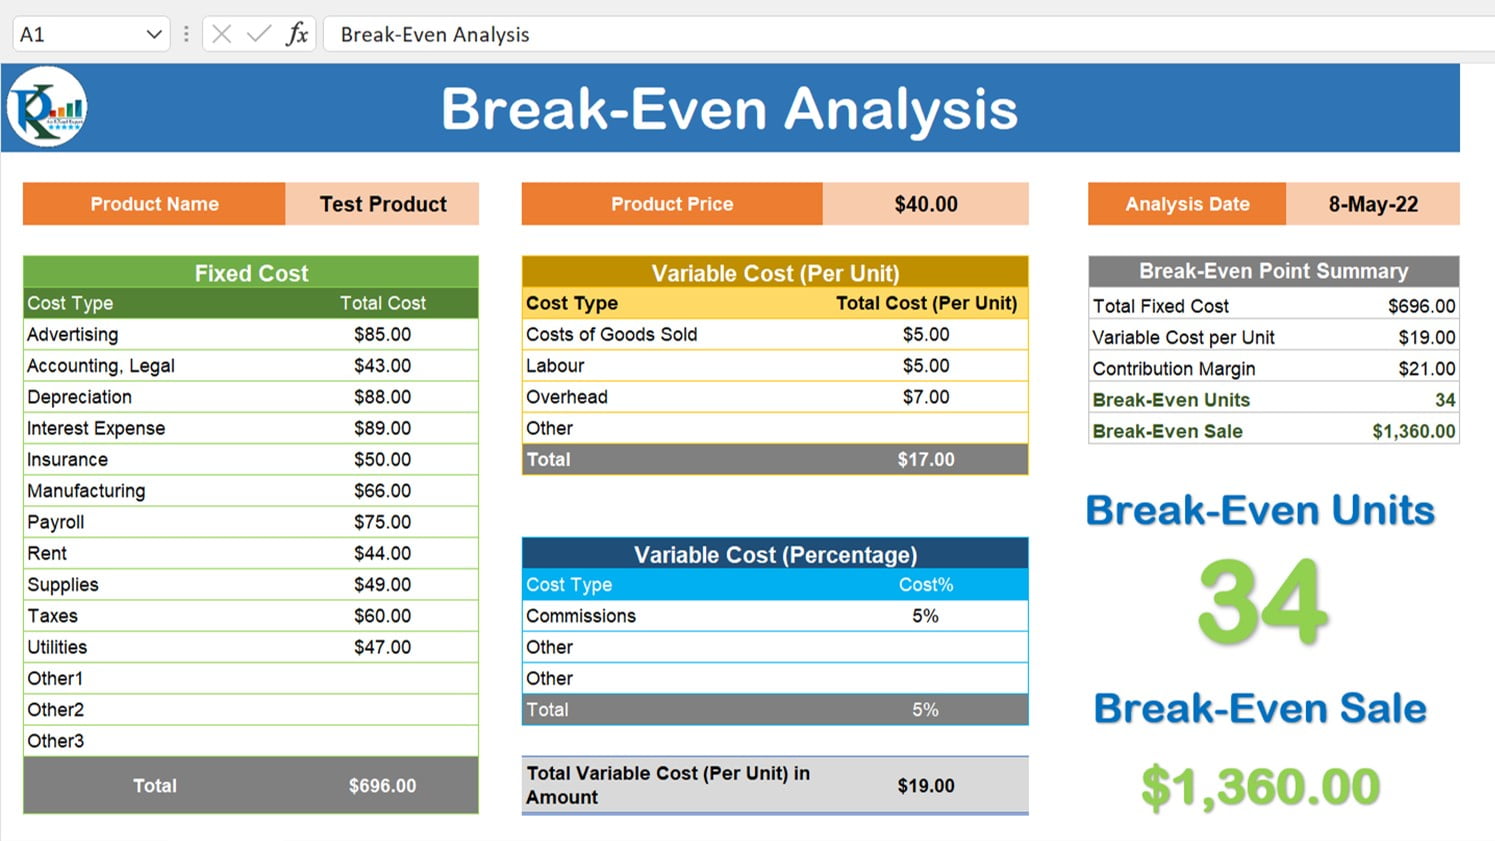
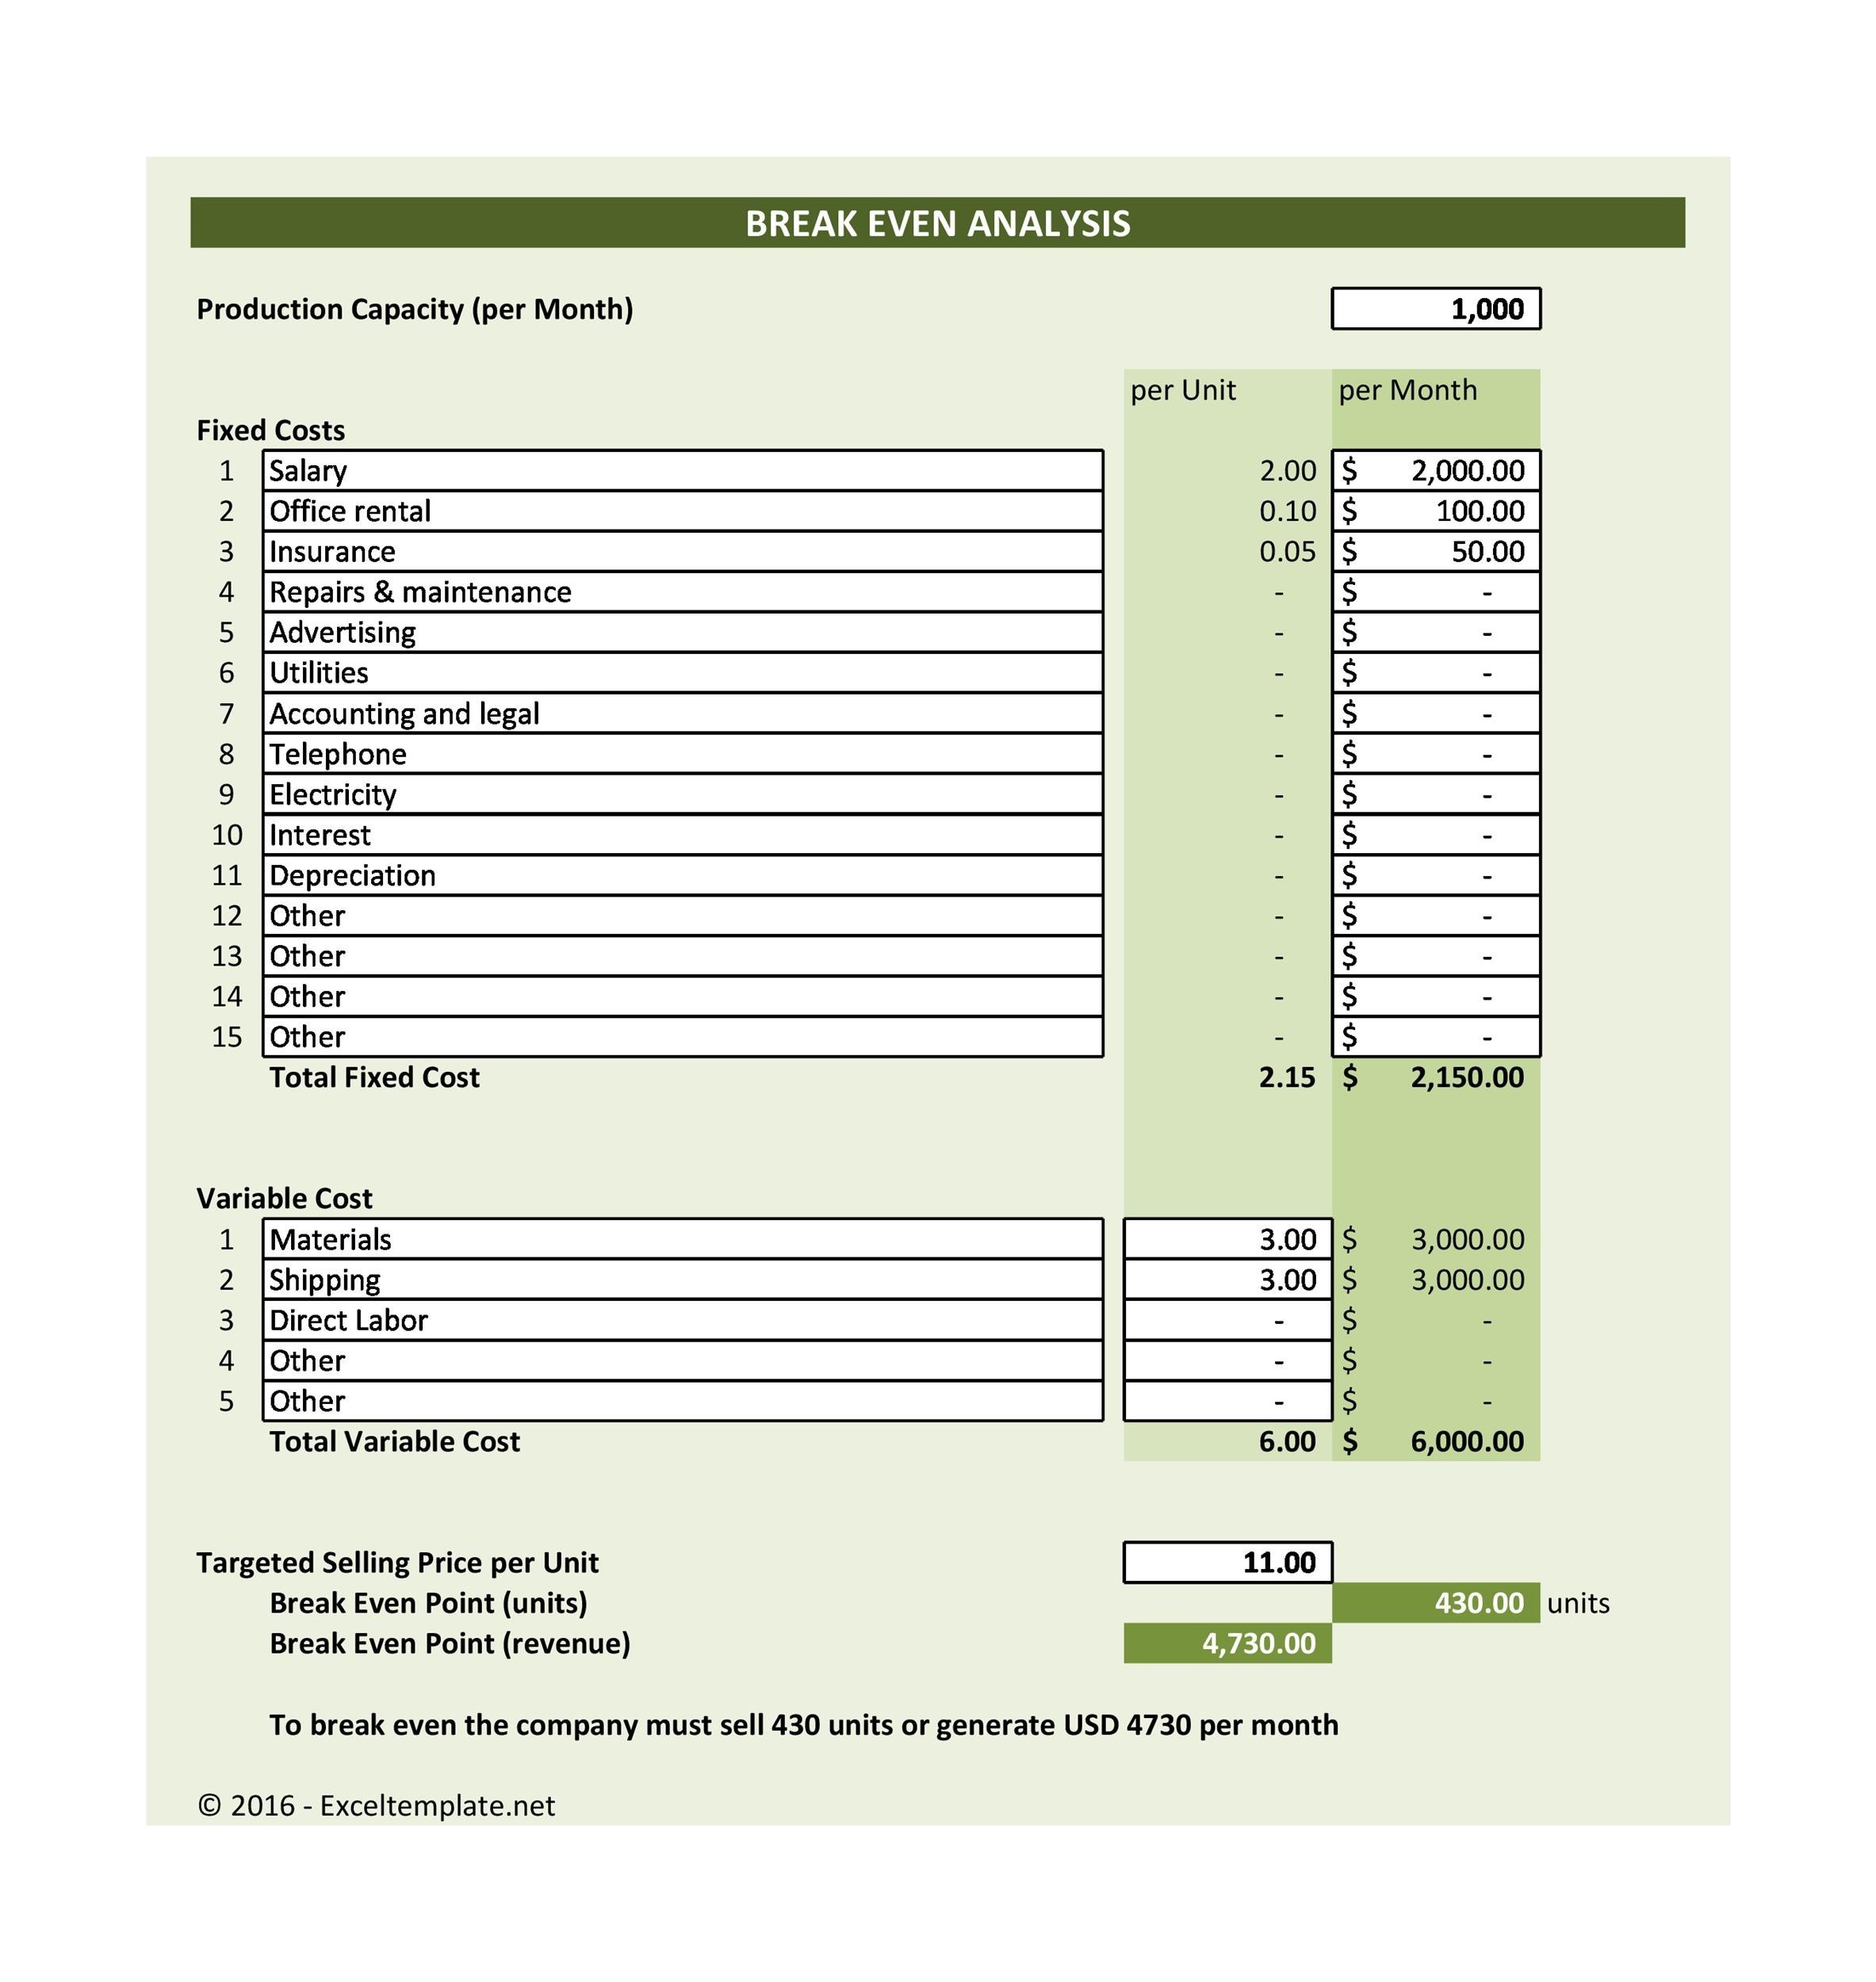
Fixed costs remain constant regardless of production volume. In a typical Asian startup, these may include factory lease in Shenzhen, salaries for full‑time staff, insurance premiums, and depreciation of machinery. The template should allocate a dedicated cell range for each fixed cost, sum them with the SUM function, and label the total clearly. Using named ranges (e.g., FixedCostTotal) simplifies downstream formulas and makes the sheet more readable for colleagues who might not be Excel power users.
Variable Costs per Unit
Variable costs fluctuate directly with the number of units produced or sold. Common examples are raw material costs for a Japanese sushi roll kit, packaging for a Korean beauty product, or bandwidth for a Singaporean streaming service. The template needs a table where you list each variable cost component, its unit cost, and an input cell for the expected production volume. Multiplying unit cost by volume (e.g., =UnitCost*Quantity) yields the total variable cost, which is then summed to give the Variable Cost Total.
Sales Price
The sales price is the amount you charge customers per unit. In Asian markets, pricing strategies may involve tiered pricing for bulk orders, promotional discounts for festival seasons, or dynamic pricing based on demand spikes (think of Diwali sales in India). The template should allow you to enter a base price and, if needed, a discount rate that automatically adjusts the effective price. A separate cell for RevenuePerUnit makes it easy to test different pricing scenarios without altering the core formulas.
Contribution Margin
Contribution margin is the difference between the sales price and variable cost per unit, representing the amount each unit contributes toward covering fixed costs. In Excel, this is simply =RevenuePerUnit-VariableCostPerUnit. A well‑designed template highlights the contribution margin in a distinct color and provides a quick reference cell that can be used in break even calculations, making it obvious how changes in price or variable cost impact profitability.
Break Even Point Calculations
With fixed costs, variable costs, and contribution margin defined, the break even point in units is calculated by dividing total fixed costs by the contribution margin: =FixedCostTotal/ContributionMargin. The template should also calculate the break even point in dollars by multiplying the unit break even quantity by the sales price. For added insight, include a Margin of Safety metric that shows how far current sales are from the break even point, expressed as a percentage.
Step‑By‑Step Guide to Building Your Own Template
Step 1: Set Up the Worksheet Layout
Start with a clean workbook and label the first sheet “Break Even Model.” Reserve the top rows for a title, date, and version number. Use column A for descriptive labels (e.g., “Fixed Costs,” “Variable Cost per Unit”) and column B for input cells. Separate sections with a light gray fill to improve readability. Remember to protect the calculation cells (using Excel’s Protect Sheet feature) so that only designated input cells are editable.
Step 2: Input Fixed Costs
List each fixed cost item in column A (e.g., “Factory Rent,” “Management Salaries”) and enter the corresponding dollar amount in column B. Below the list, add a SUM formula (e.g., =SUM(B3:B8)) and label the result “Total Fixed Costs.” Use a named range like FixedCostTotal for this cell. To accommodate multiple currencies across Asian subsidiaries, add a dropdown in cell B2 that selects the currency symbol, and link it to a conversion rate table if needed.
Step 3: Define Variable Costs and Sales Price
Create a small table with headings “Variable Cost Item,” “Unit Cost,” and “Quantity.” Populate the rows with items such as “Raw Materials,” “Packaging,” and “Labor Hours.” In a separate column, calculate each line’s total variable cost by multiplying unit cost by quantity (=C5*D5). Sum the totals to get “Total Variable Cost per Unit.” Then, in a dedicated cell, input the “Sales Price per Unit.” If you want to test discount scenarios, add a cell for “Discount %” and compute an effective price with =SalesPrice*(1-Discount%).
Step 4: Create Formulas for Contribution Margin and Break Even Units
Directly beneath the variable cost section, insert a formula for Contribution Margin (=EffectivePrice-VariableCostPerUnit). Highlight this cell with a bold border to draw attention. Next, calculate the break even quantity with =FixedCostTotal/ContributionMargin. Format the result as a whole number using the ROUNDUP function to reflect the fact that you cannot sell a fraction of a unit. Finally, compute the break even revenue by multiplying the break even units by the effective price.
Step 5: Add Sensitivity Analysis with Data Tables
Asian markets are known for rapid shifts—think of a sudden surge in demand for face masks during a health crisis. To prepare, embed a two‑variable data table that varies both sales price and variable cost per unit. Place a row of possible sales prices across the top of the table and a column of variable costs down the side. In the intersecting cell, reference the break even unit formula. Use Excel’s Data → What‑If Analysis → Data Table feature to automatically populate the table. Conditional formatting can then highlight scenarios where the break even point falls below a target sales volume, guiding strategic decisions.
Step 6: Visualize Results with a Break Even Chart
Charts turn numbers into stories. Insert a line chart that plots “Total Cost” and “Total Revenue” against a range of sales volumes (e.g., 0 to 2× the break even quantity). Use the Series option to calculate total cost as =FixedCostTotal + VariableCostPerUnit*UnitsSold and total revenue as =EffectivePrice*UnitsSold. Highlight the intersection point with a data label that reads “Break Even.” Add a secondary axis if you want to overlay profit margin as a bar chart. This visual cue is especially powerful for presentations to investors in Jakarta, Shanghai, or Manila.
Real‑World Asian Business Scenarios

Manufacturing a Bubble Tea Kit
A Taiwanese startup wants to launch a DIY bubble tea kit for export to Southeast Asia. Fixed costs include a lease on a 2,000‑sq‑ft facility, salaries for five technicians, and machinery depreciation. Variable costs per kit consist of tea leaves, tapioca pearls, sweetener packets, and packaging. By feeding these numbers into the Excel template, the team discovers that they must sell at least 12,000 kits per month to break even at a price of $8 per kit. The sensitivity table reveals that a 5% reduction in packaging cost drops the break even volume to 10,500 kits, prompting negotiations with a new supplier.
Launching a Mobile App for Karaoke
A Korean tech firm plans a subscription‑based karaoke app targeting the booming home‑entertainment market. Fixed costs are high due to server infrastructure, licensing fees for song catalogs, and a development team. Variable costs are minimal—primarily payment‑gateway fees per transaction. The template shows that with a monthly subscription of $4.99, they need 50,000 active subscribers to cover fixed costs. However, the chart also highlights that a modest price increase to $5.49 reduces the required subscriber base to 45,000, a figure well within their projected growth based on recent market surveys.
Exporting Hand‑crafted Silk Scarves
An Indian artisan collective exports silk scarves to Japan and the United States. Fixed costs comprise a rented workshop, a small team of weavers, and marketing expenses for online platforms. Variable costs include silk yarn, dye, and packaging. By applying the Excel template, the collective sees that at a wholesale price of $30 per scarf, they must produce 8,000 scarves annually to break even. The sensitivity analysis demonstrates that a 10% increase in yarn cost would push the break even point to 9,200 scarves, prompting the collective to explore bulk purchasing agreements with local silk farms.
Tips to Keep Your Template Clean and Future‑Proof
1. Use Named Ranges for all key inputs—this makes formulas easier to read and reduces the chance of reference errors.
2. Apply Data Validation (drop‑downs, numeric limits) to prevent accidental entry of unrealistic numbers.
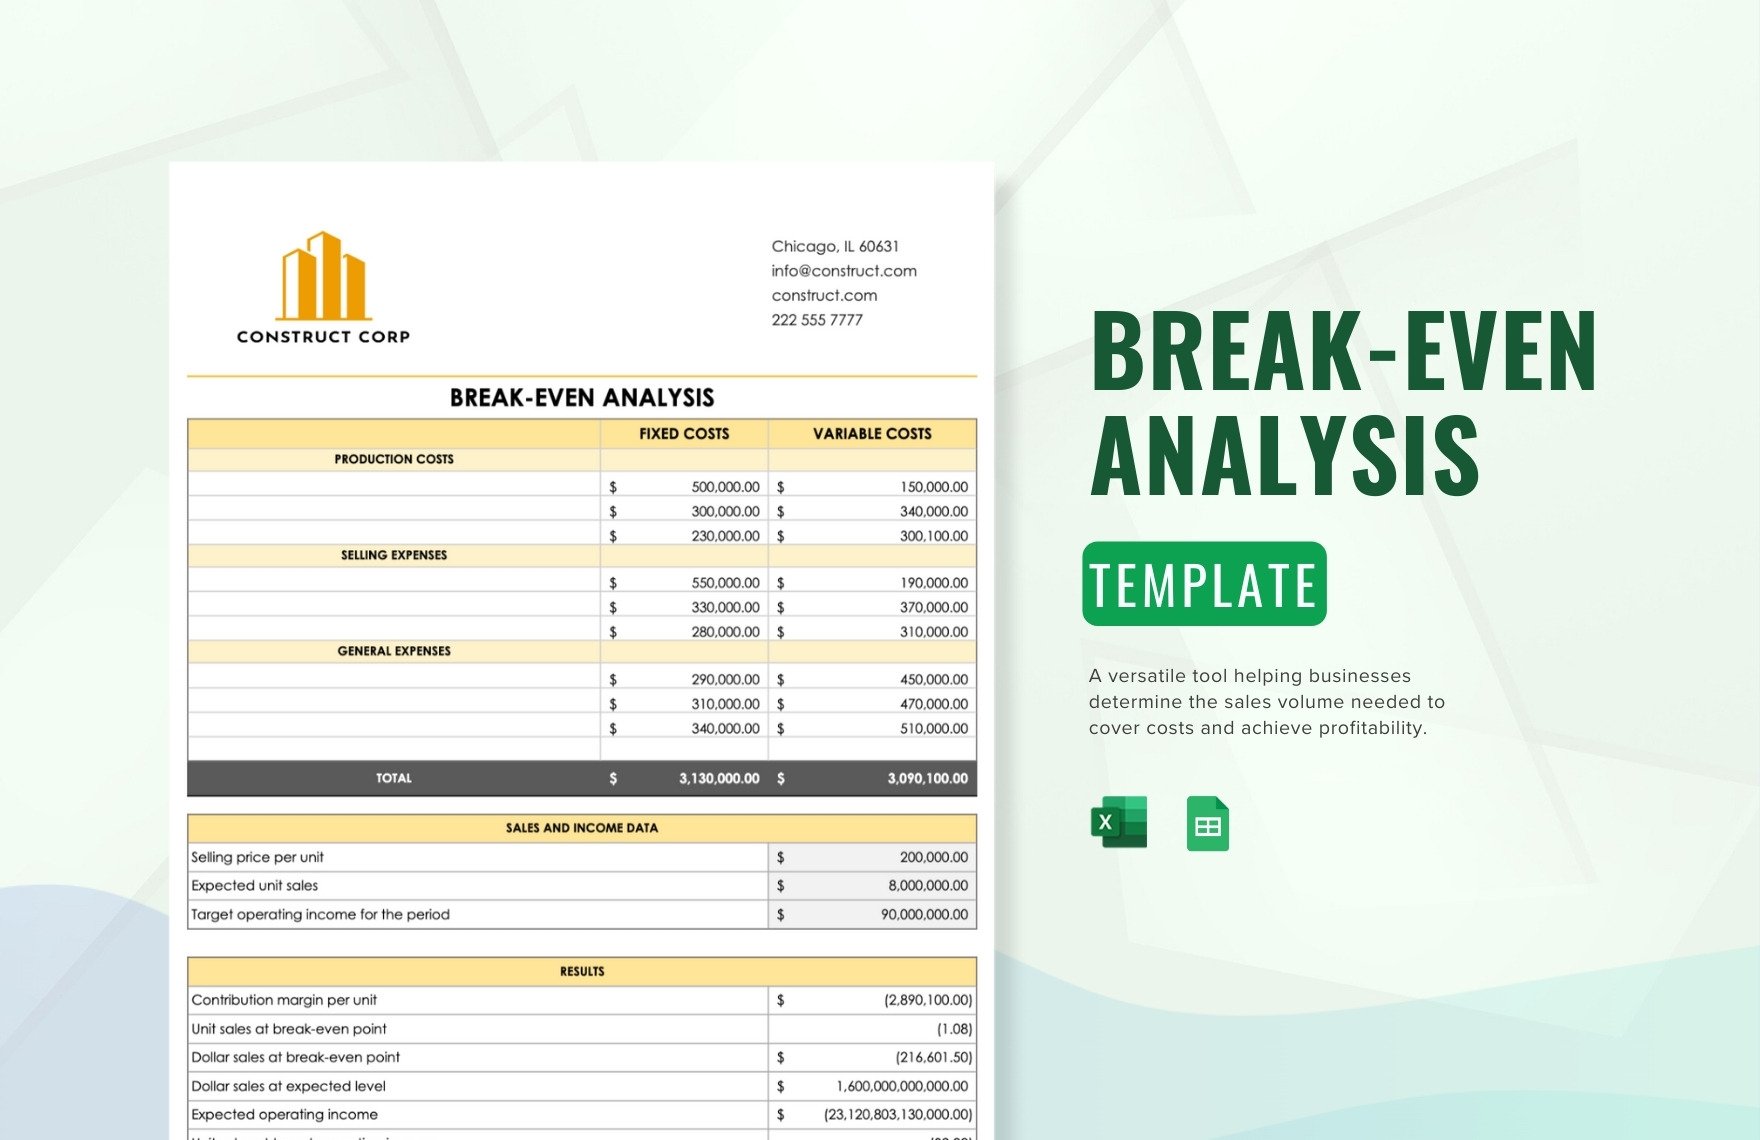
3. Separate Input, Calculation, and Output sections with distinct shading or borders; this visual hierarchy guides users through the model.
4. Document Assumptions in a hidden “Notes” sheet—record currency rates, inflation assumptions, and market growth estimates.
5. Lock Formula Cells while leaving input cells unlocked to protect the integrity of calculations when multiple users edit the file.
6. Version Control is essential; add a version number and date at the top of the sheet, and keep archived copies in a shared drive to track changes over time.
Common Mistakes and How to Avoid Them
Overlooking Variable Cost Fluctuations – Many Asian manufacturers assume a static variable cost per unit, but raw material prices can swing dramatically due to seasonal harvests or import tariffs. Counter this by regularly updating the variable cost inputs and using the sensitivity table to test worst‑case scenarios.
Mixing Units and Currencies – When dealing with cross‑border operations, it’s easy to input costs in rupees and revenue in dollars. Create a conversion table and link all monetary inputs to a single “Exchange Rate” cell to keep calculations consistent.
Ignoring Break Even Volume in Production Planning – Some teams focus solely on profit margins and forget that production capacity must meet the break even volume. Add a capacity check formula (=IF(RequiredUnits>MaxCapacity,"Capacity Issue","OK")) to flag potential bottlenecks.
Hard‑Coding Numbers into Formulas – Embedding constants directly into formulas (e.g., =10000/($B$2-$C$2)) makes future updates painful. Replace constants with named cells or references to keep the model flexible.
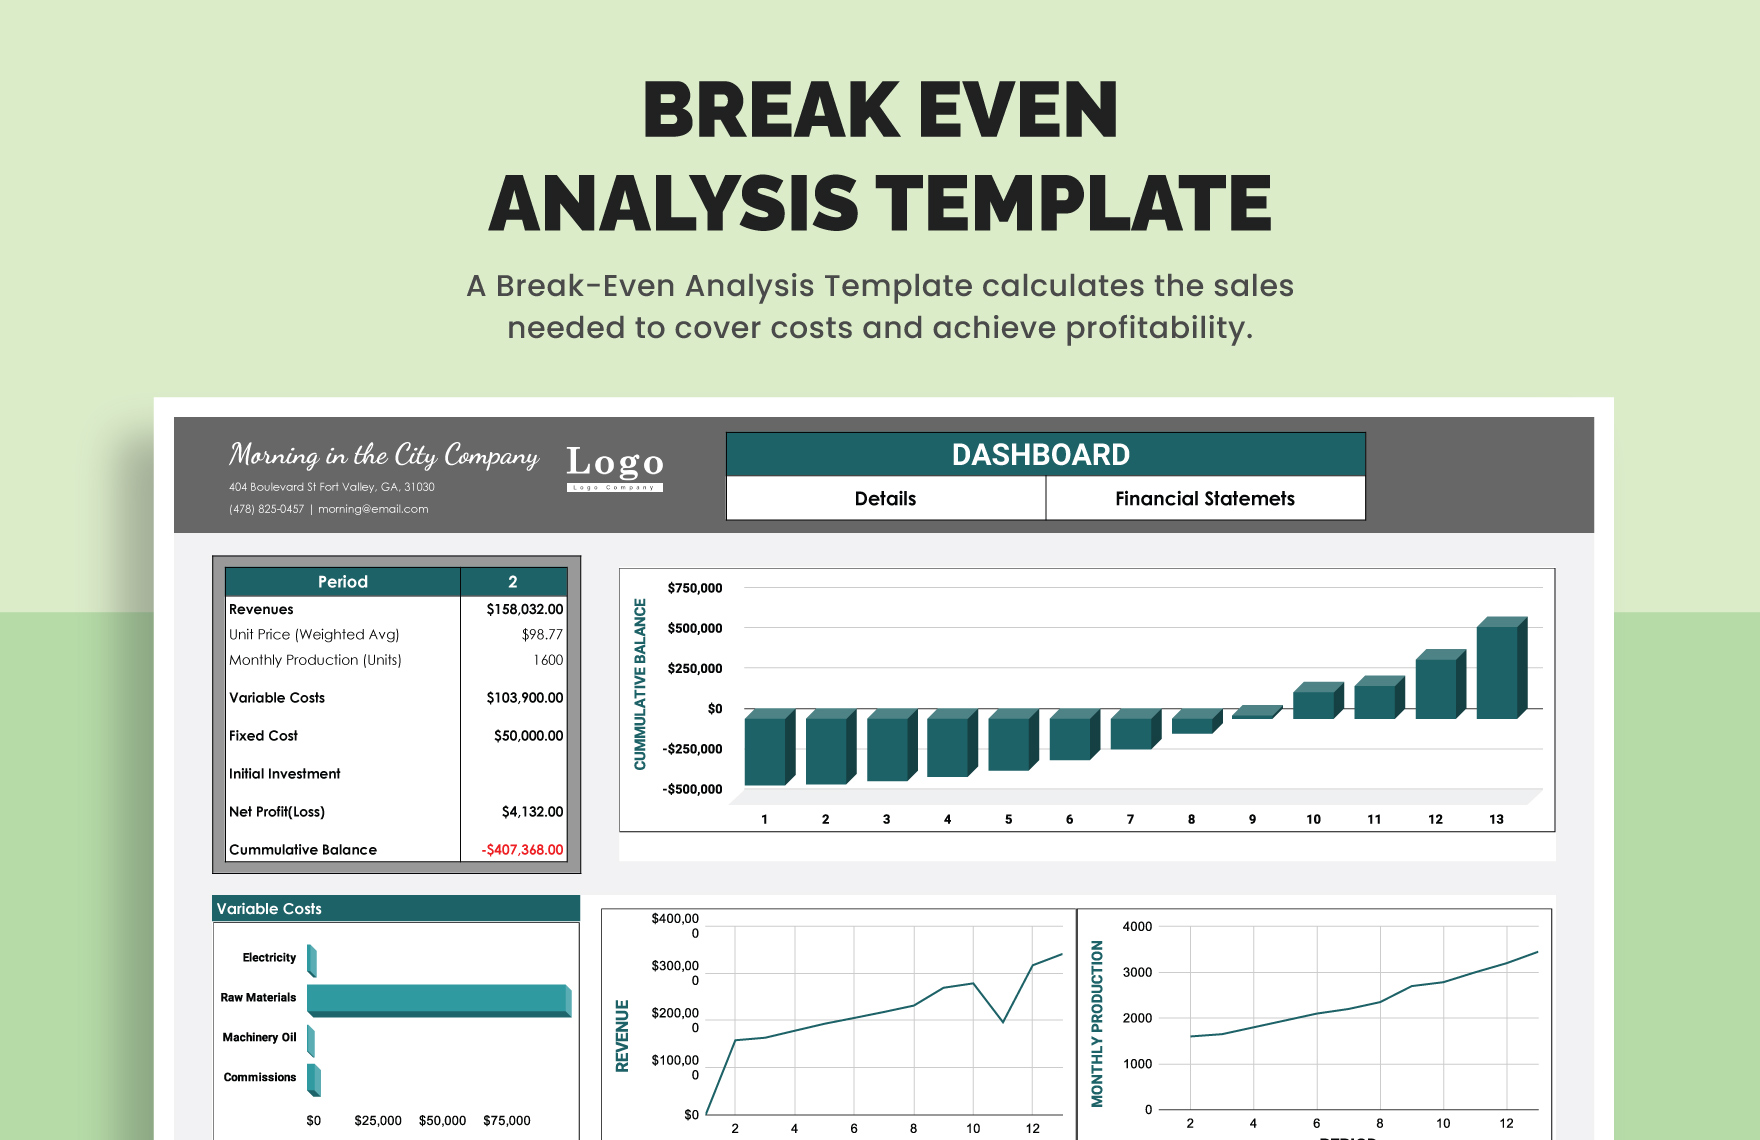
Neglecting Visual Communication – Stakeholders often respond better to charts than tables. Always accompany the numerical output with a clean break even chart and conditional formatting that highlights key thresholds.
Conclusion
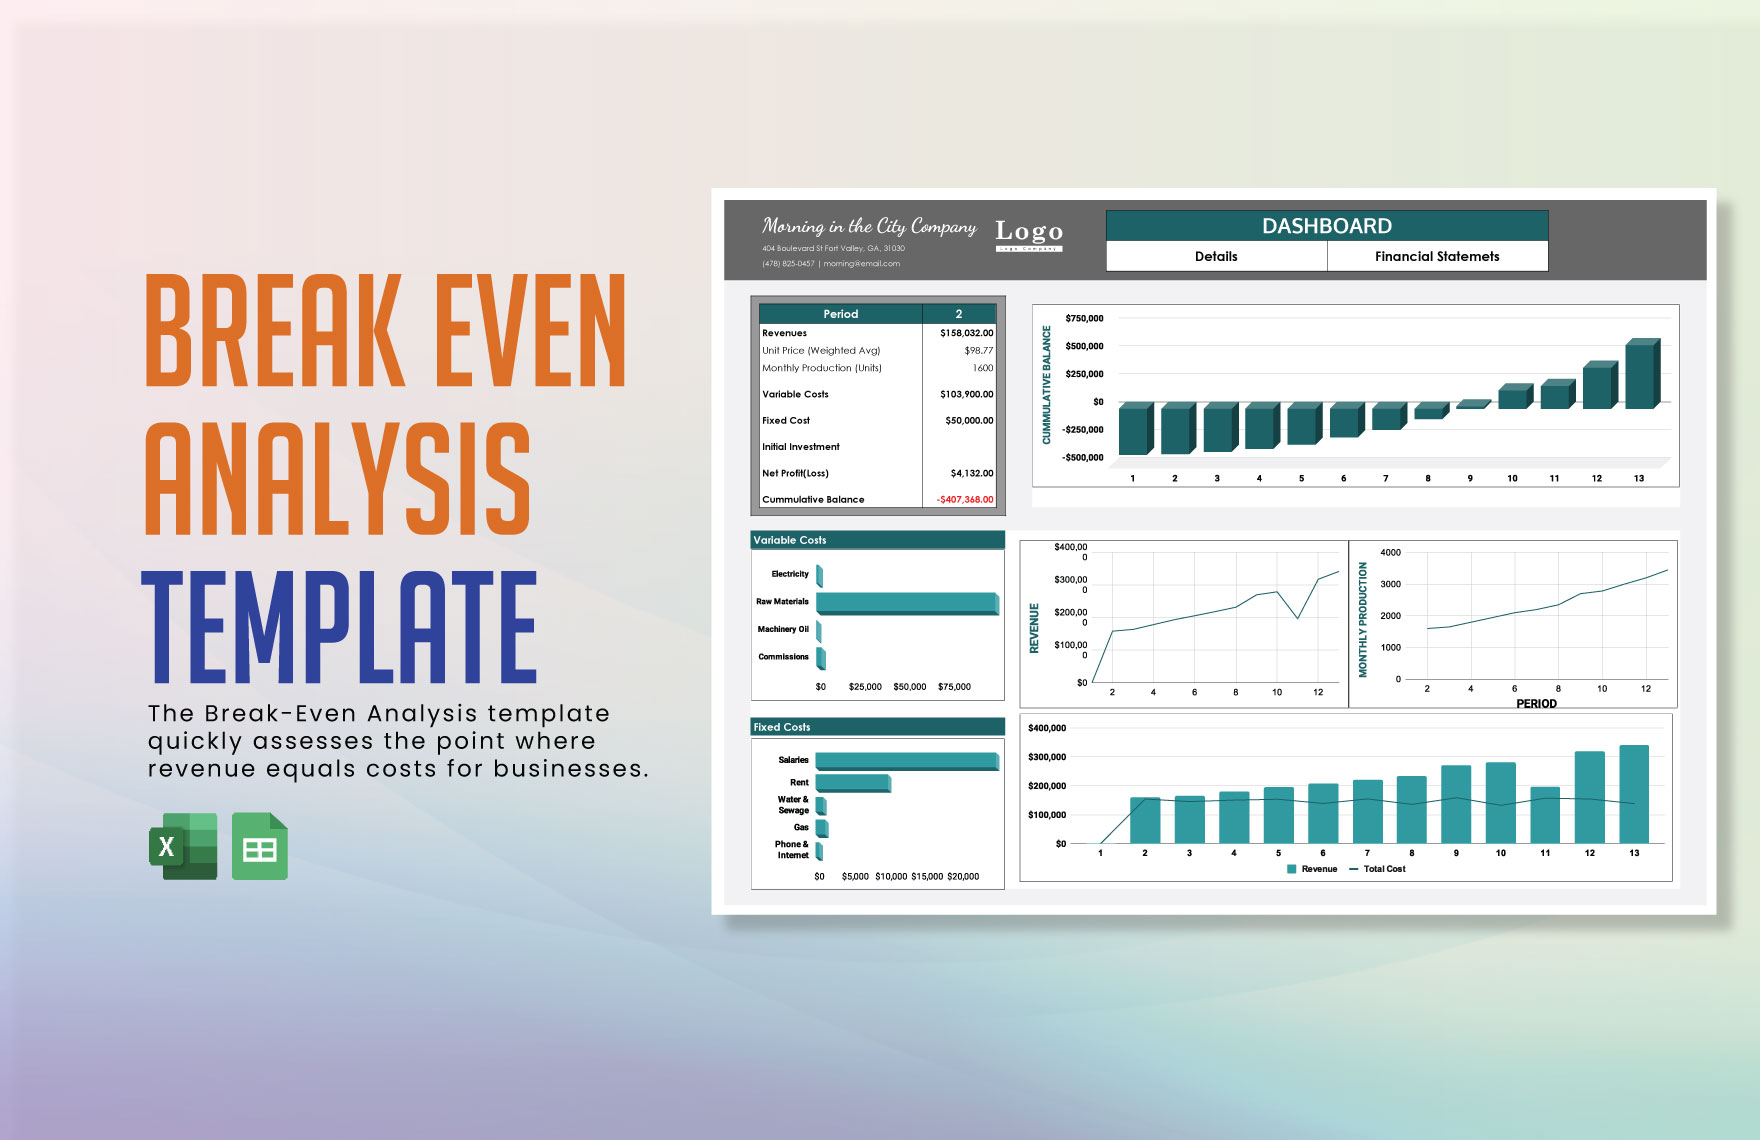
Mastering the Excel Break Even Analysis Template equips Asian businesses—from bustling factories in Vietnam to sleek app developers in Singapore—with the clarity to price products wisely, allocate resources efficiently, and communicate financial insights confidently. By embedding fixed costs, variable costs, contribution margin, and break even calculations into a single, well‑structured workbook, you eliminate guesswork and empower decision‑makers to act quickly in dynamic markets. The step‑by‑step guide, real‑world examples, and practical tips in this article provide a roadmap to build, customize, and maintain a template that grows with your enterprise, ensuring that every new venture starts on a solid financial foundation and every strategic move is backed by reliable data.