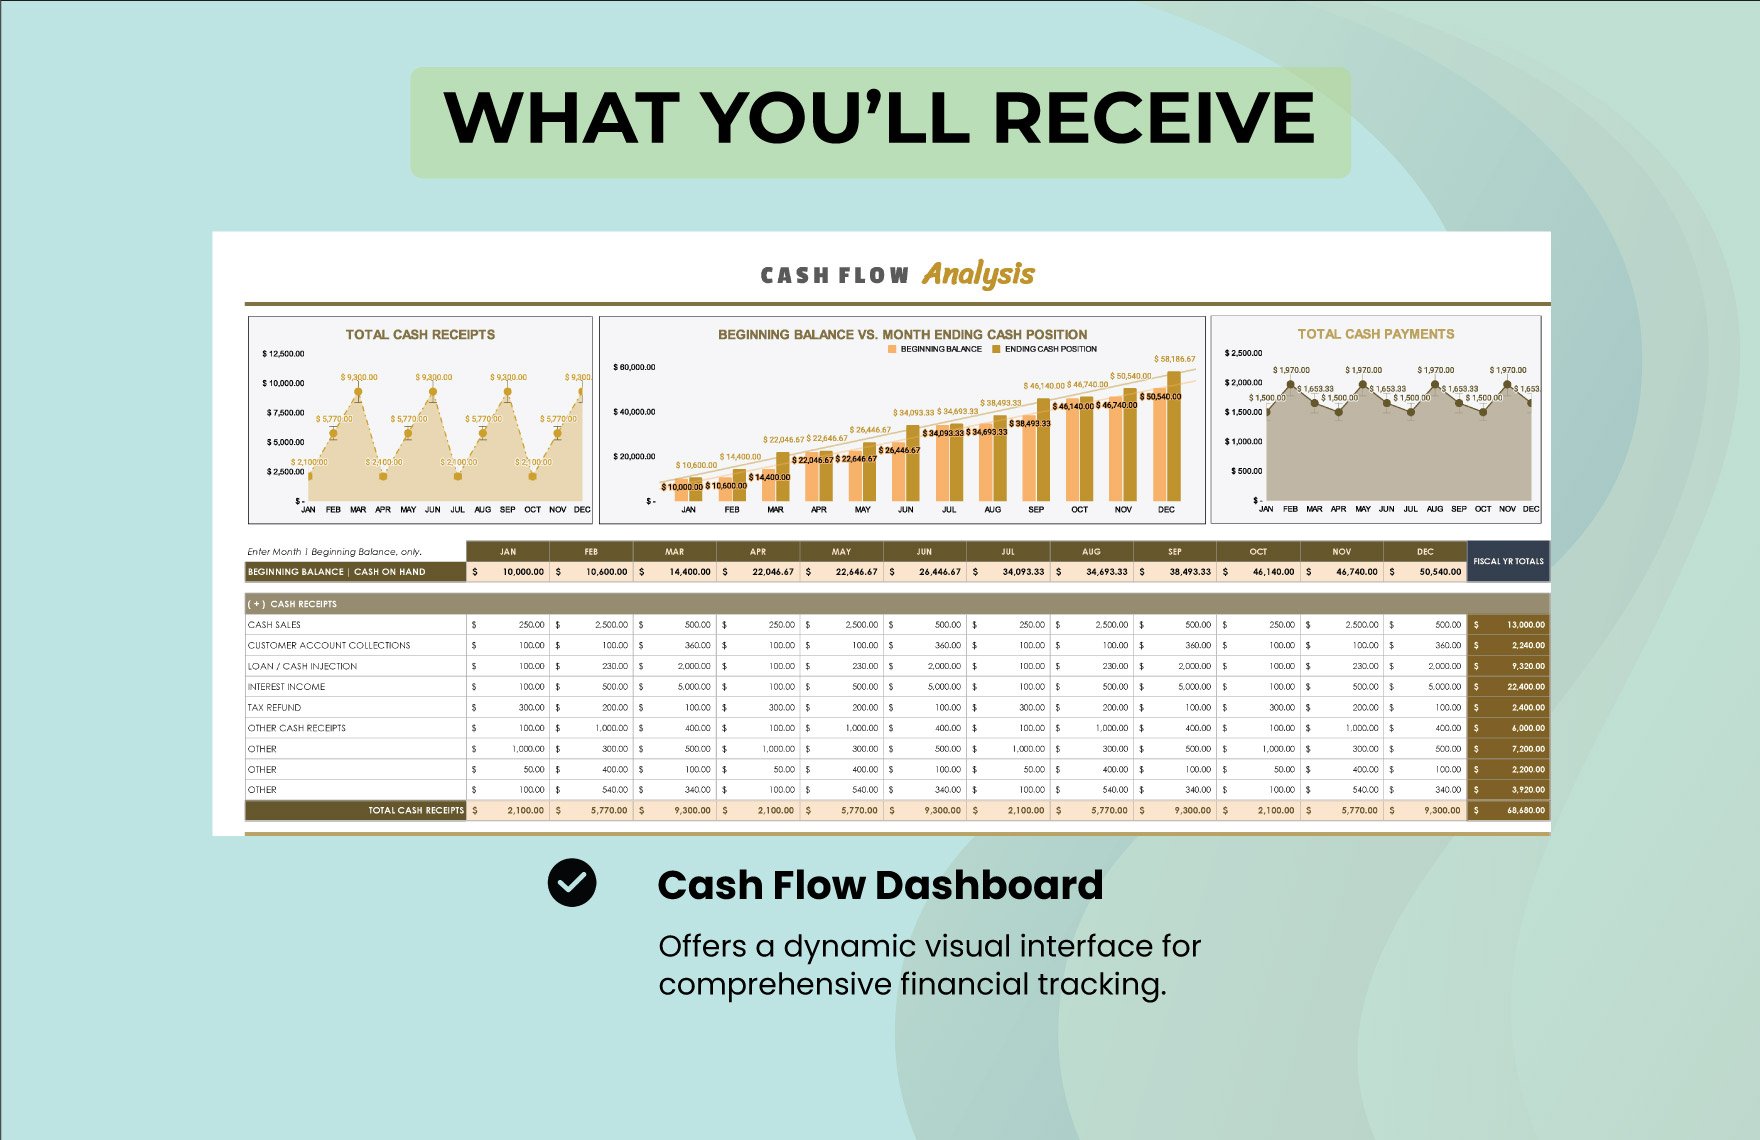
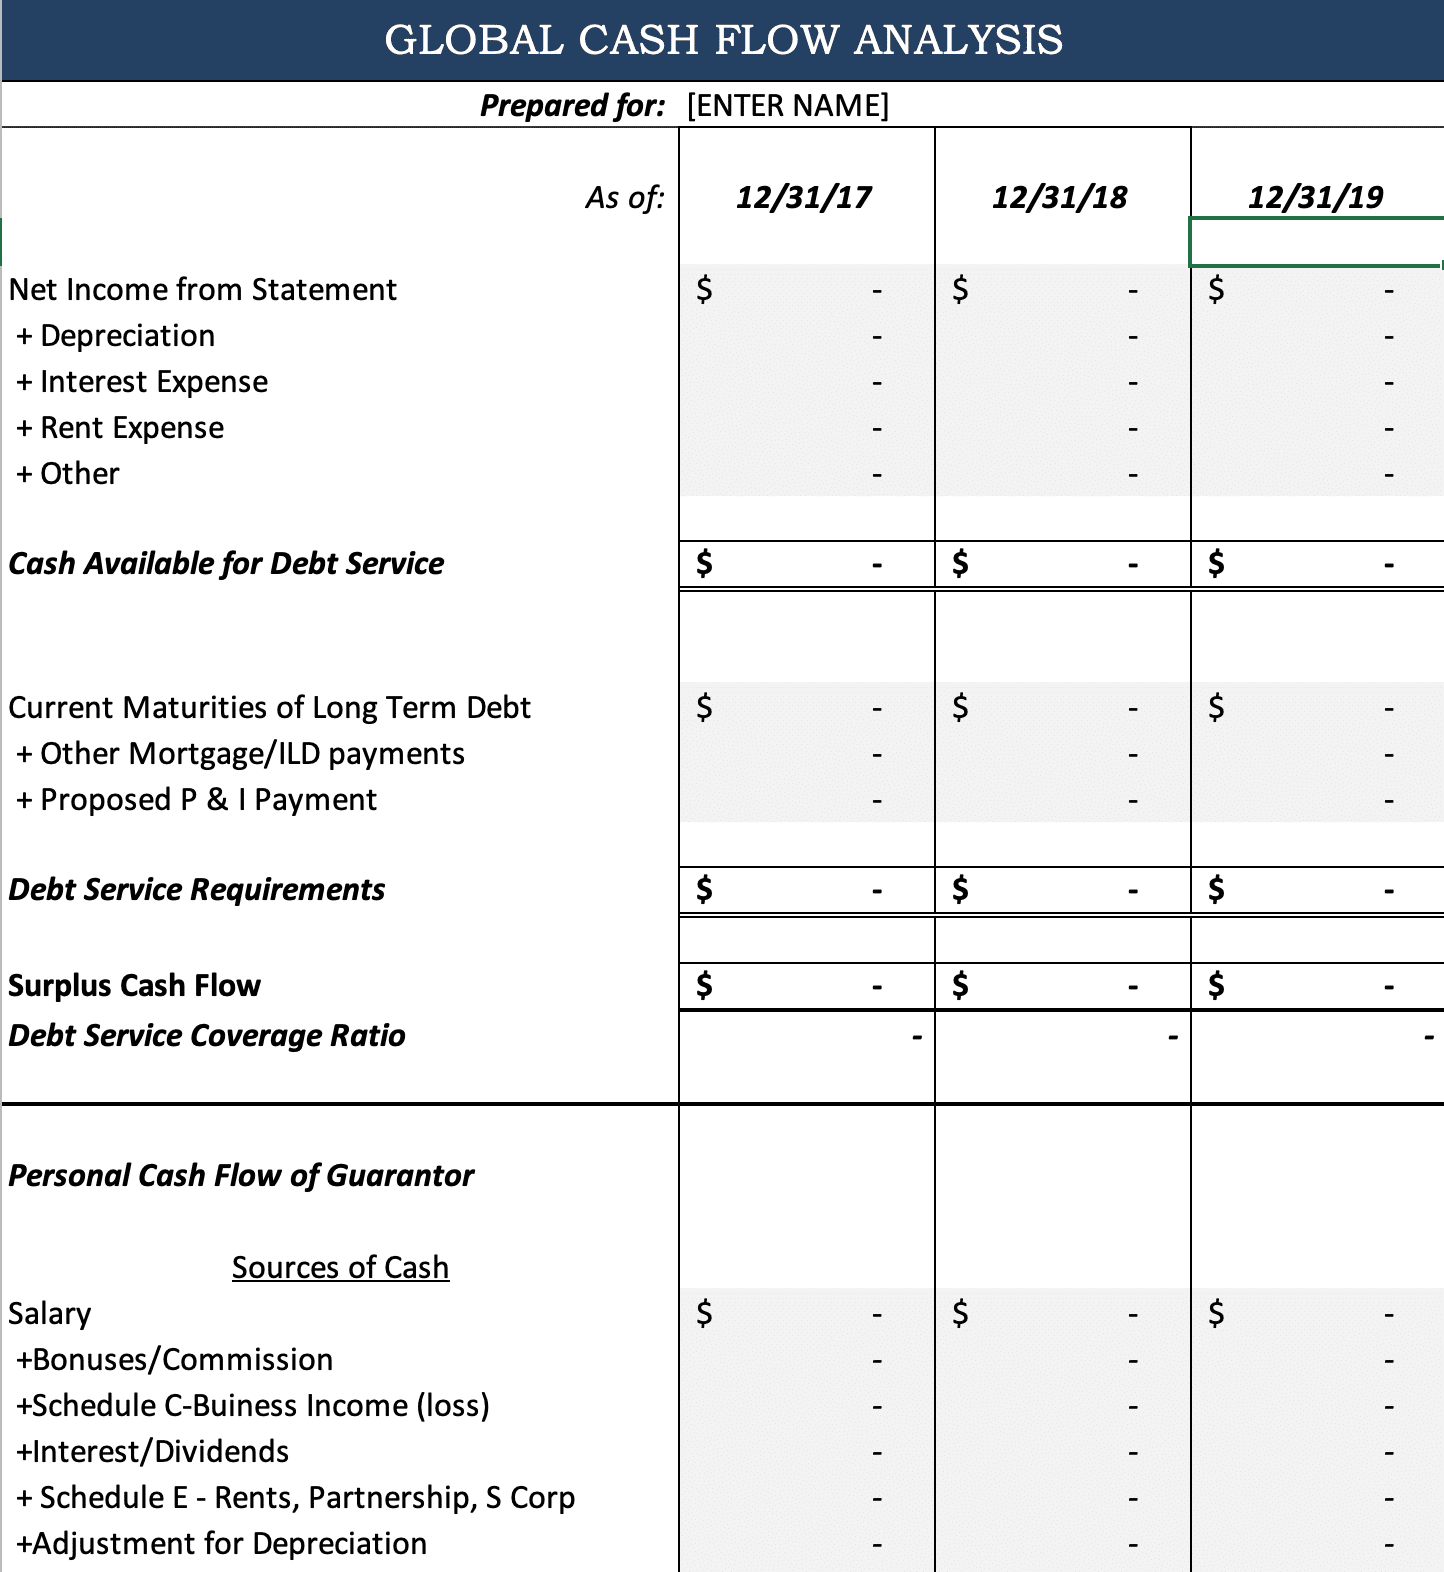
Global Cash Flow Analysis Excel Template is about to become the most beloved companion in your financial toolkit—like a caffeinated superhero that keeps your numbers flying, while you keep the coffee flowing. If you’ve ever stared at a spreadsheet and imagined it was a living, breathing organism that could outwit your Excel skills, you’re in the right place. Let’s dive into this template’s wizardry, sprinkled with a dash of humor and a lot of practical insights.
Why Cash Flow Analysis Matters (Even if You Think Money Is a Myth)
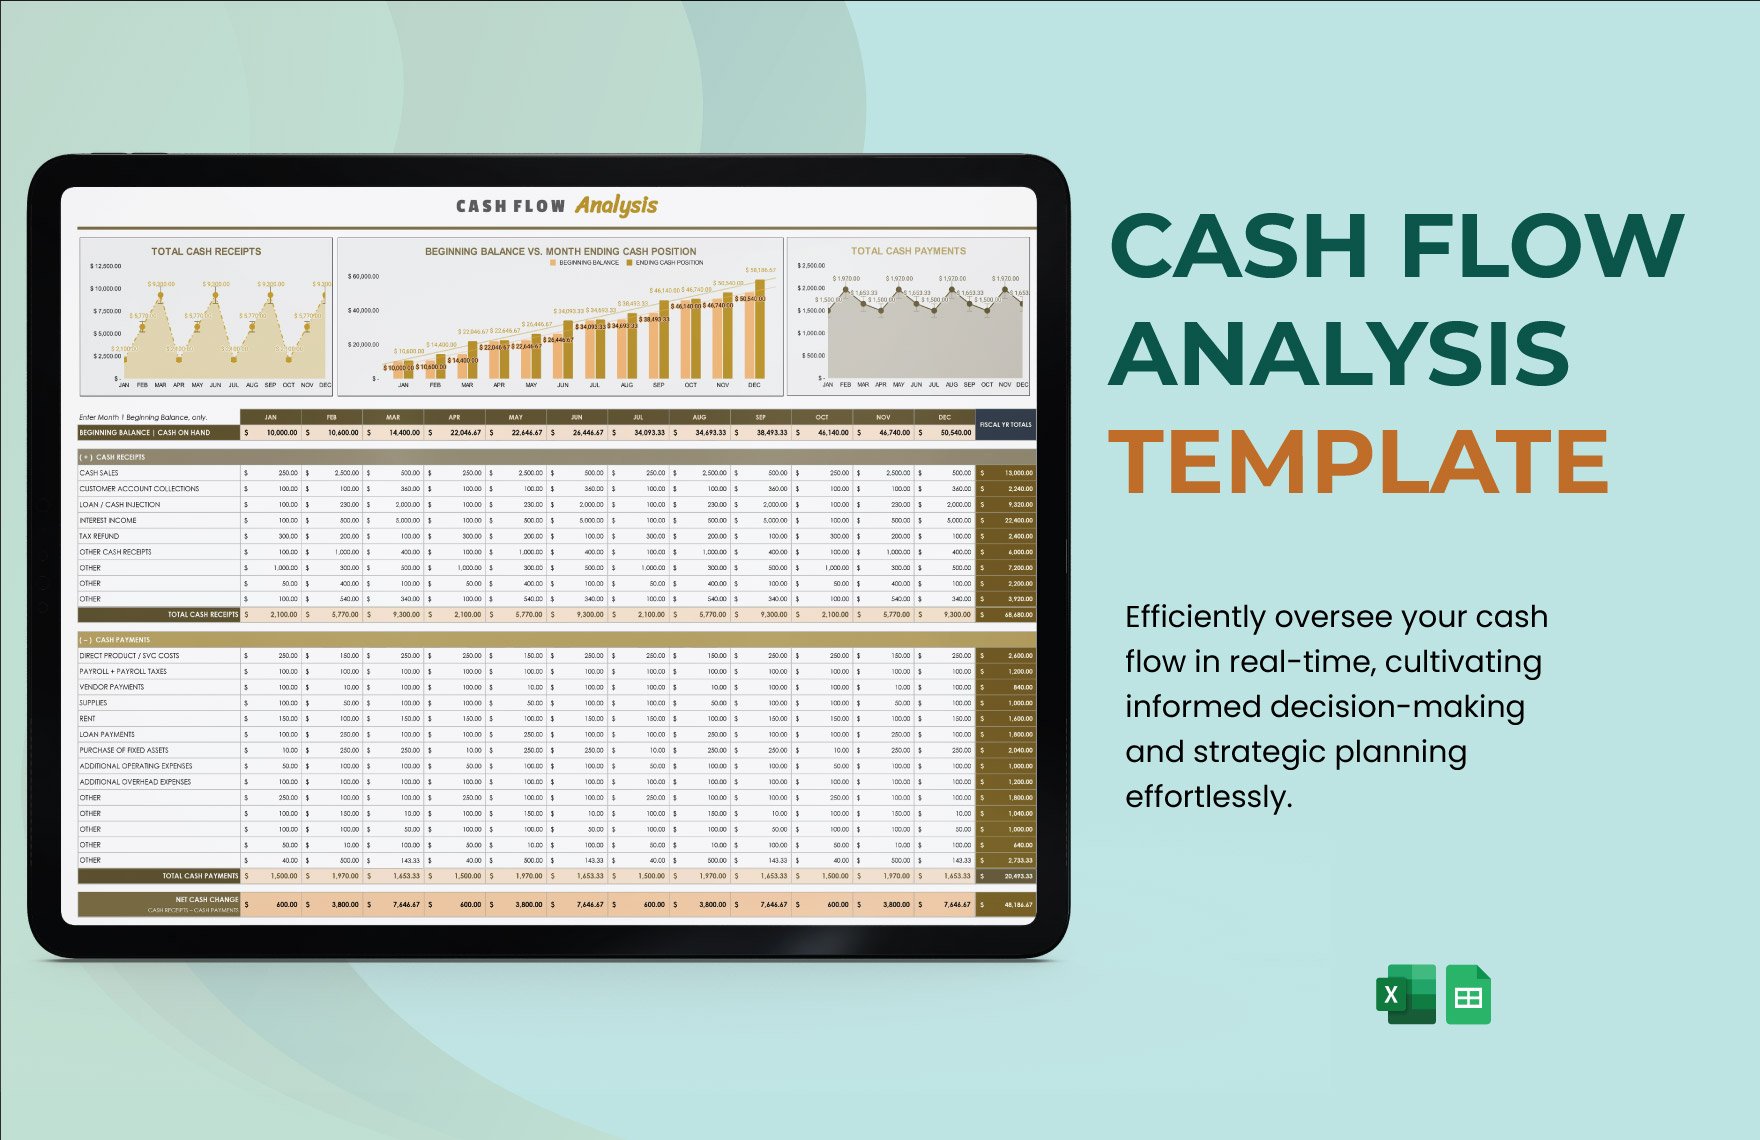
First, let’s clear the air: cash flow is the lifeblood of any business, from your grandma’s bake sale to a multinational conglomerate. Without it, you might as well be trying to navigate the stock market with a paper compass. This is where a Global Cash Flow Analysis Excel Template steps in, turning chaos into a neatly formatted spreadsheet that speaks fluent money.
Key Benefits at a Glance
- Visibility Across Borders: Track inflows and outflows from every country, making the template a passport for your cash.
- Scenario Testing: Simulate “what if” cases without pulling out your hair.
- Time Savings: Say goodbye to manual calculations—Excel does the math while you sip your coffee.
- Decision-Making Power: Spot trends faster than a squirrel spots a nut.
- Data Integrity: Reduce human error with pre-built formulas.
Getting Started: From Download to Dashboard
Before you begin, imagine a template as a Swiss Army knife—simple, but powerful. Follow these steps to bring it to life, and remember: every spreadsheet starts with a splash of optimism.
1. Download and Unpack the Template
Download the Excel file, then open it. The first sheet usually contains a Welcome tab—read it. It’s the template’s version of “Hello, future spreadsheet superstar!”.
2. Familiarize Yourself with the Layout
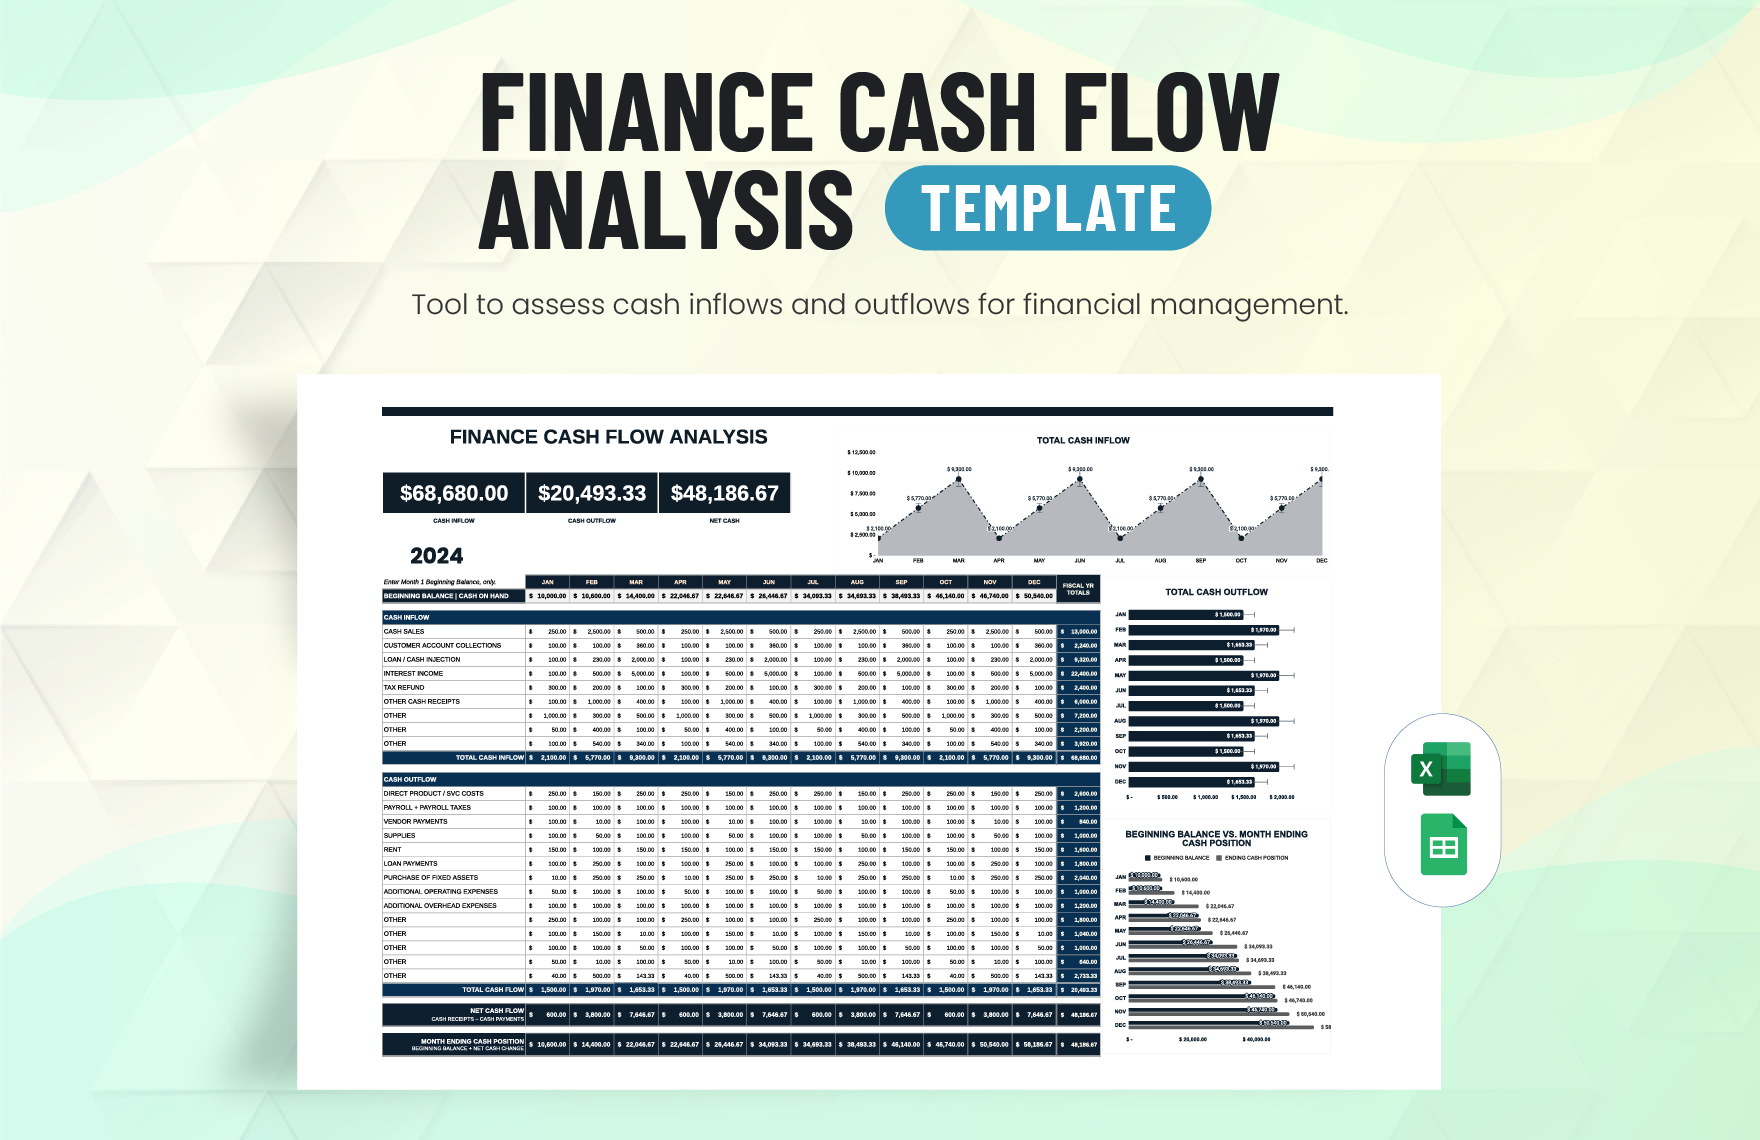
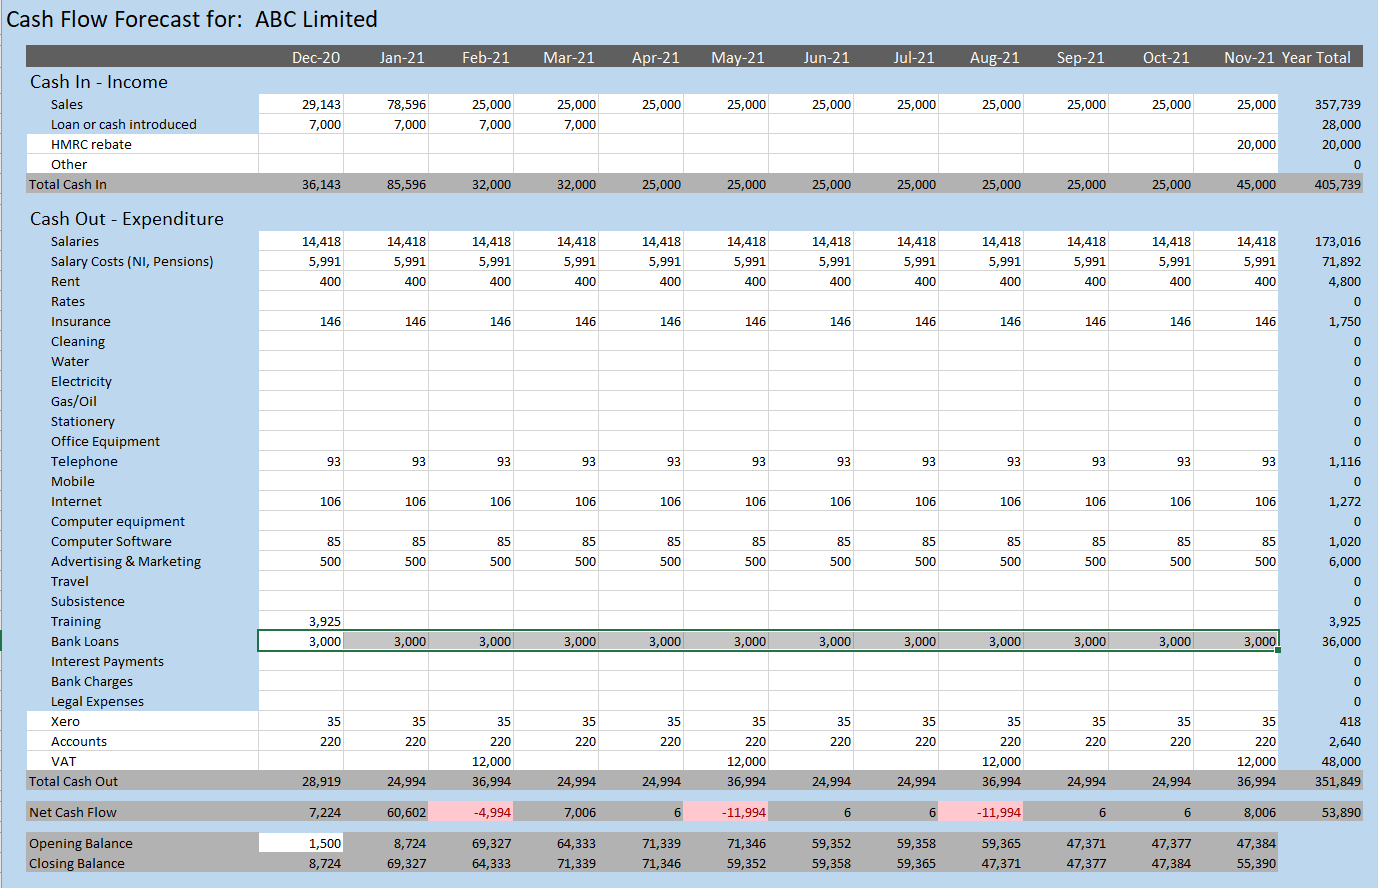
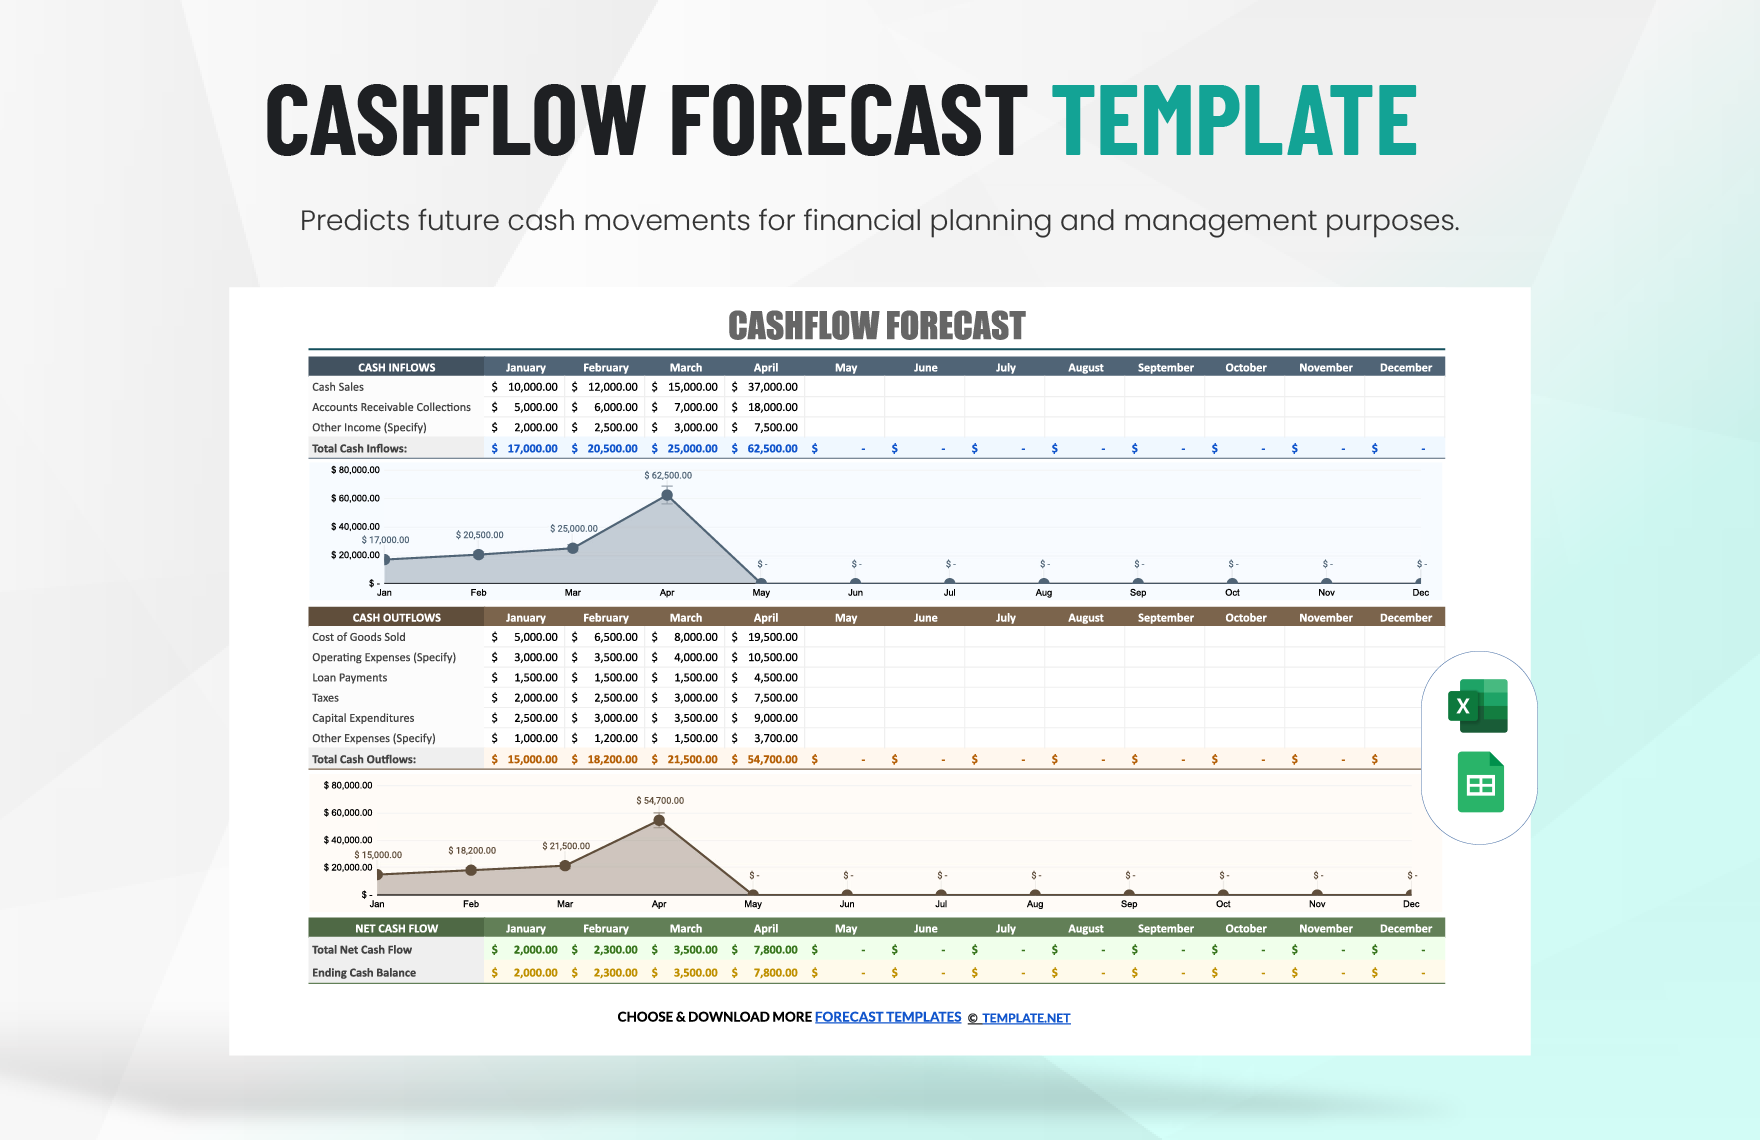
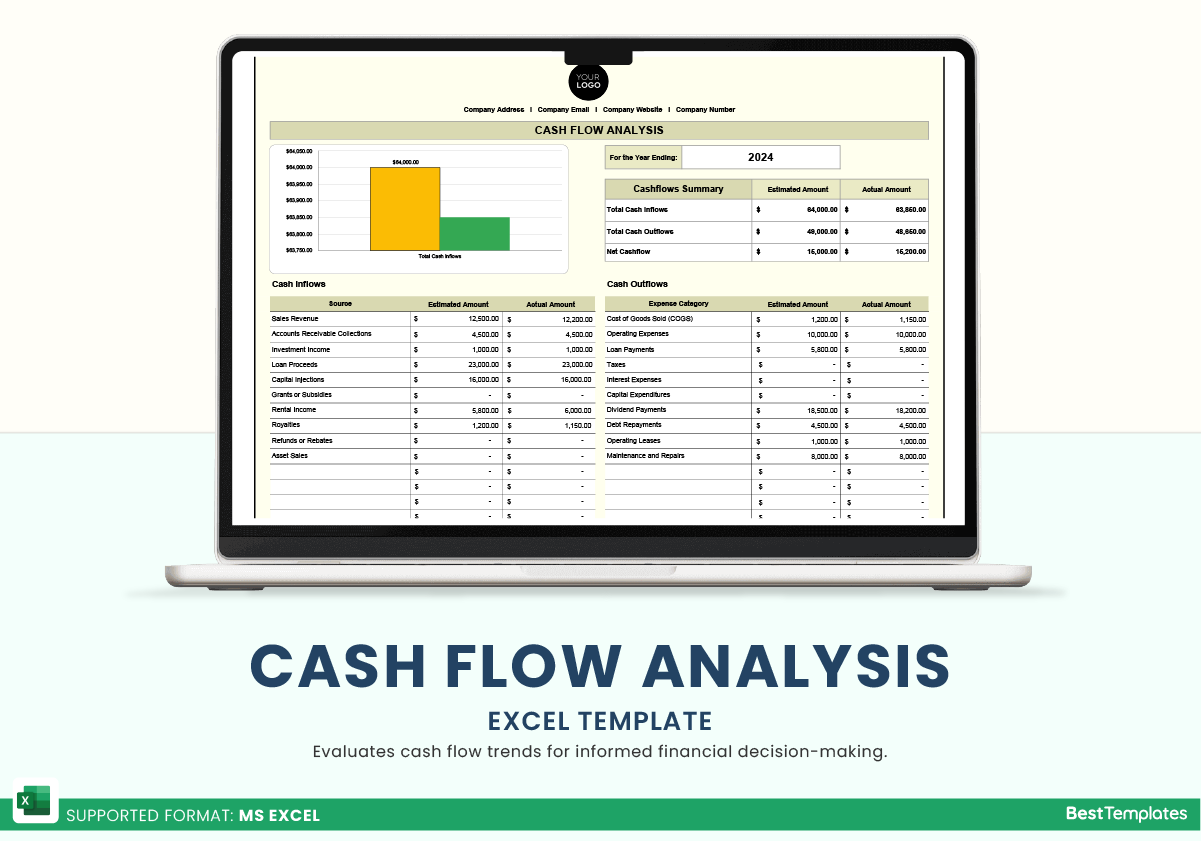
The template typically divides into three main sections: Assumptions, Cash Flow Statements, and Charts & Analysis. Each section serves a distinct purpose—think of them as the appetizer, main course, and dessert of your financial meal.
3. Populate the Assumptions
- Enter your currency symbols for each region (USD, EUR, JPY, etc.).
- Set up exchange rates—yes, those pesky numbers that can turn your profit into a circus act if left unchecked.
- Define fiscal years or quarters to keep your time frames aligned.
4. Input Historical Data
Feed the template your past cash inflows and outflows. If you’re a startup with only three months of data, that’s fine—just remember to label everything clearly. For large enterprises, the data can span years; treat it like a time machine—look back, learn, and plan ahead.
5. Validate Formulas
Excel magic is all about formulas. Scan the cells for any that look suspiciously like they might be using a VLOOKUP instead of a INDEX/MATCH combo. Double-check sums—if a total looks too good to be true, it probably is.
6. Review the Dashboard
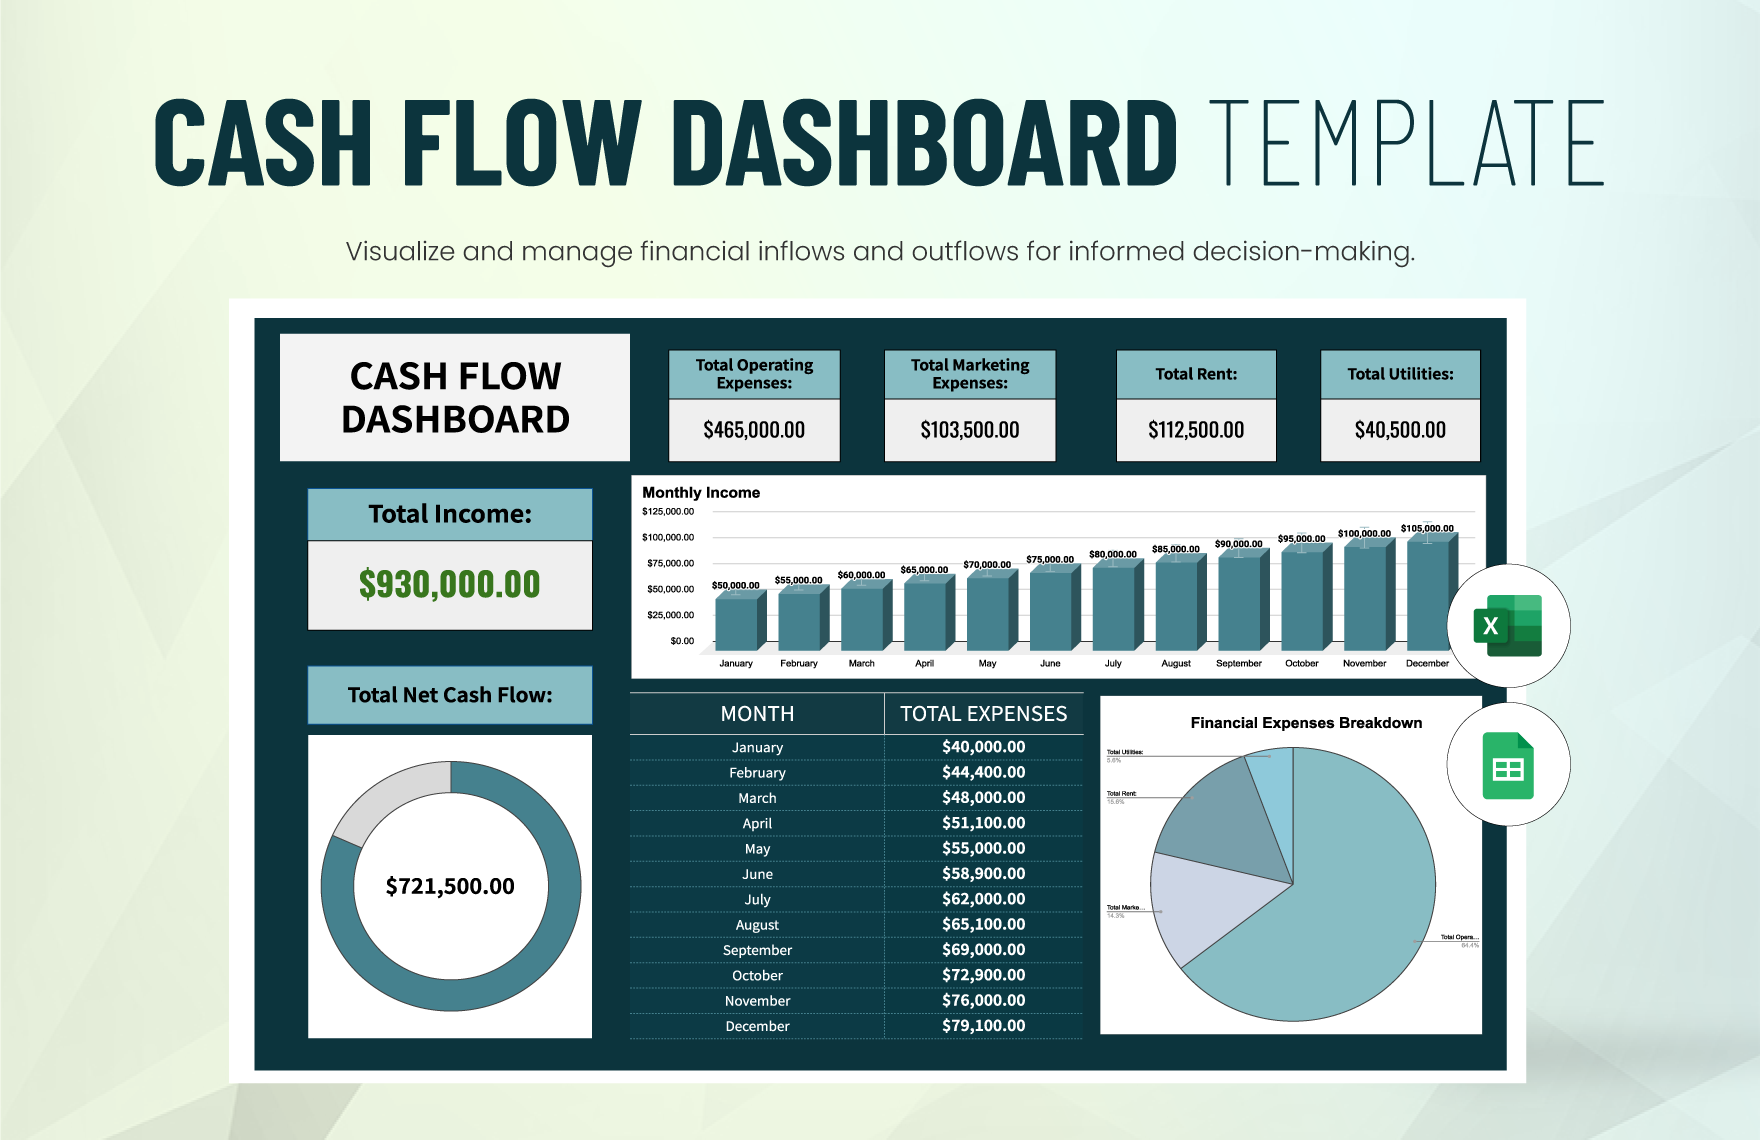
Most templates come with a visual dashboard. This is the part where Excel paints your cash flow story with charts and graphs. If the dashboard feels more like abstract art than a clear narrative, tweak the parameters and watch the magic unfold.
Customizing for Your Global Operations
Every business has its quirks. Let’s tailor the template to fit your global flavor—like adding a little extra spice to a dish you’re already craving.
Adapting Currency Conversion
Cash flow analysis across countries means converting amounts to a common currency for comparison. Use a dedicated sheet to store real-time exchange rates fetched via APIs or manually updated from your finance team.
Incorporating Local Taxes
- Add tax rows per country.
- Use dynamic tax rate cells that can be updated without altering core formulas.
- Test the impact of tax changes on net cash flow—this is essential during tax reform seasons.
Handling Multiple Fiscal Years
Many global enterprises operate on different fiscal calendars. Create a year-over-year comparison sheet that normalizes dates, ensuring you’re comparing apples to apples.
Advanced Features to Master
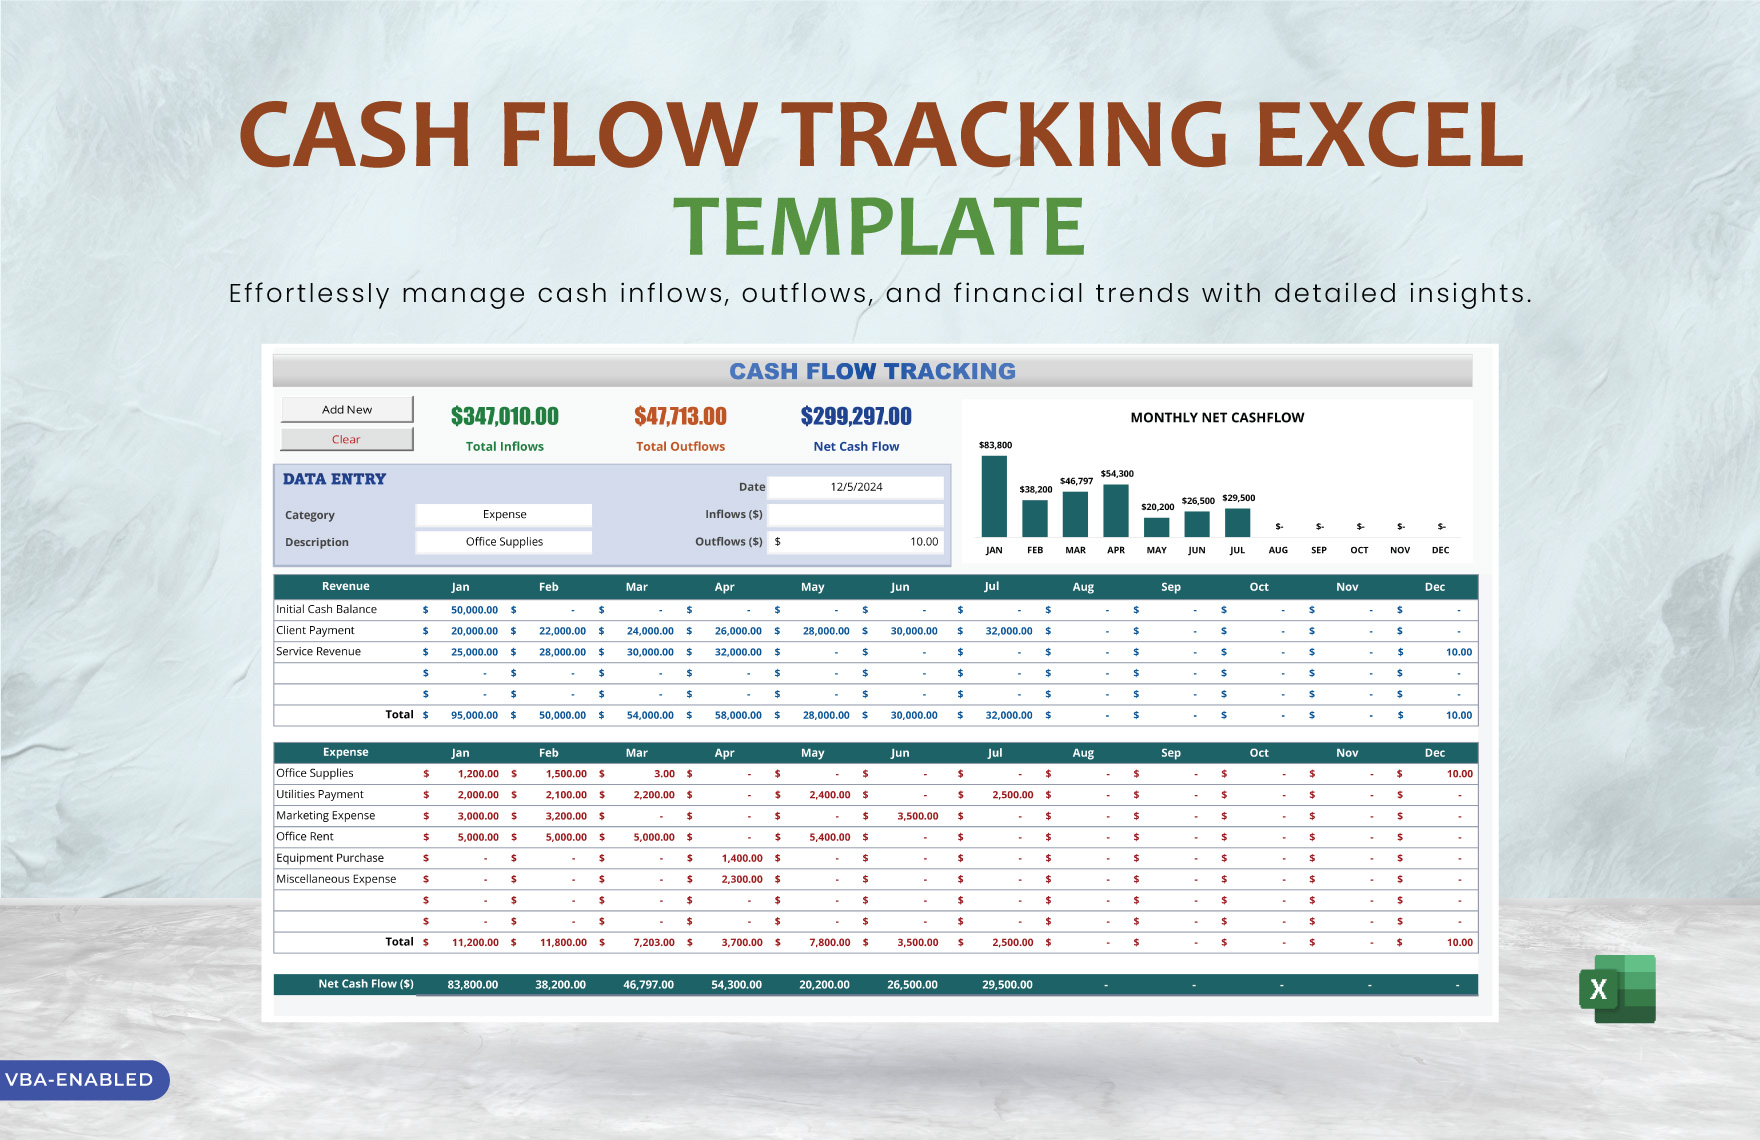
Once you’ve got the basics down, it’s time to elevate your spreadsheet game. Think of this section as the “pro mode” where you unlock hidden powers.
Scenario Analysis
Set up multiple scenarios—best case, worst case, and most likely case. Use data tables to see how changes in revenue or costs ripple across your cash flow.
Sensitivity Analysis
Identify which variables have the greatest impact on cash flow by changing one factor at a time and observing the outcome. This is particularly useful when negotiating with vendors or investors.
Conditional Formatting for Quick Glance Alerts
- Color-code negative cash balances in red.
- Highlight months where cash inflow is less than outflow—think of it as a red flag on a traffic light.
- Use data bars to visualize cash flow trends at a glance.
Real-World Example: A Startup’s Journey

Meet Alex, founder of “GadgetGurus,” a company that sells smart home devices in North America, Europe, and Asia. Alex uses the Global Cash Flow Analysis Excel Template to keep his cash flowing like a river (or a mildly caffeinated stream, depending on the day).
Step 1: Set Up Assumptions
Alex inputs the exchange rates: 1 USD = 0.85 EUR, 1 USD = 110 JPY. He also sets the fiscal year as 2024-2025 and defines revenue growth rates per region.
Step 2: Enter Historical Data
He logs sales, shipping costs, and marketing expenses for the first quarter. The template’s built-in formulas automatically calculate net cash flow for each region.
Step 3: Scenario Planning
Alex creates two scenarios: “Launch Delay” and “Supply Chain Disruption.” He tweaks the sales forecast and cost assumptions, and the dashboard instantly shows the impact on cash reserves.
Step 4: Decision-Making
By reviewing the cash flow charts, Alex notices that the Asia region’s cash flow dips in Q2 due to a currency fluctuation. He decides to hedge against this risk using a forward contract, thereby stabilizing future cash flow.
Common Pitfalls and How to Avoid Them
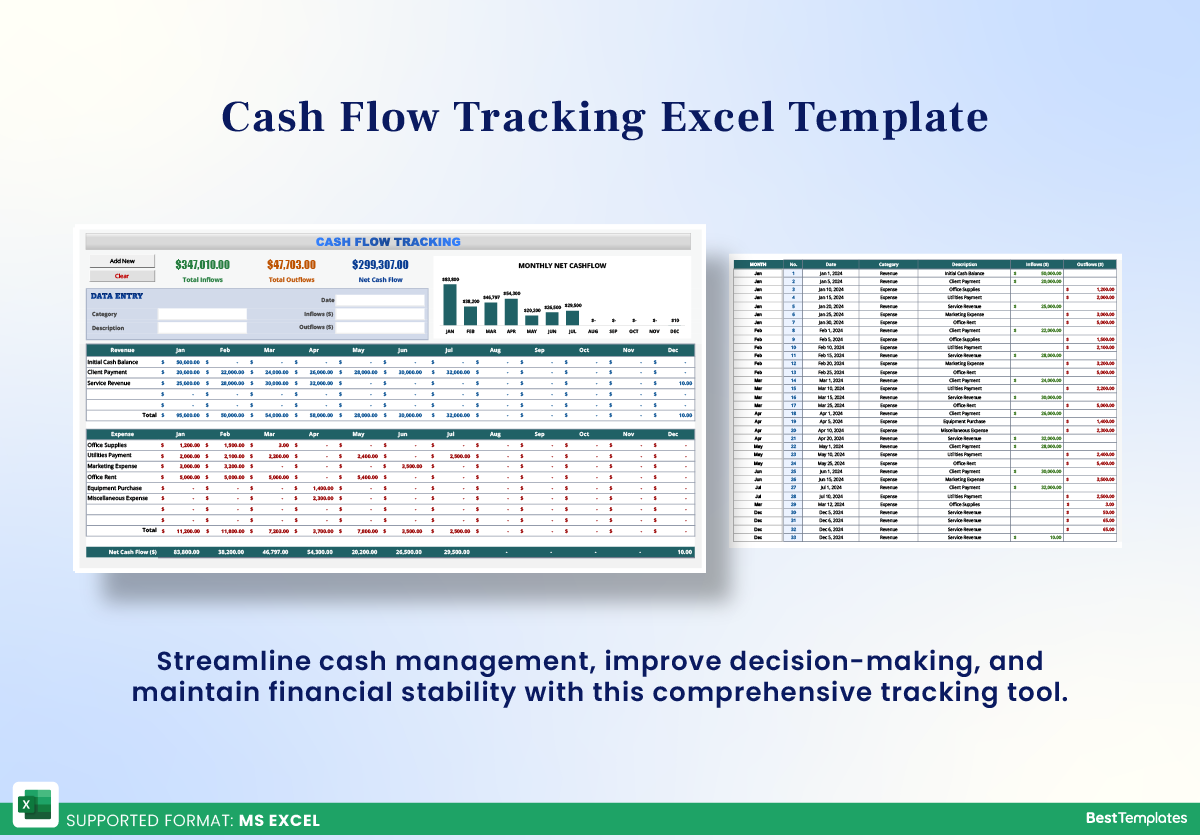
Even seasoned spreadsheet wizards can trip on these traps. Here’s a quick cheat sheet to keep your data pristine.
1. Overcomplicating Formulas
Too many nested functions can turn a clean sheet into a black box. Keep formulas as simple as possible and use named ranges for readability.
2. Ignoring Data Validation
Without proper validation, you risk typos leading to huge miscalculations. Use drop-down lists for currency codes and fiscal periods.
3. Forgetting to Backup
Save versions of your spreadsheet after major changes. Treat each version like a time capsule, so you can roll back if a calculation goes haywire.
4. Neglecting to Update Exchange Rates Regularly
Stale rates can skew your cash projections. Set a reminder or automate updates to keep the template accurate.
Integrating the Template with Other Tools
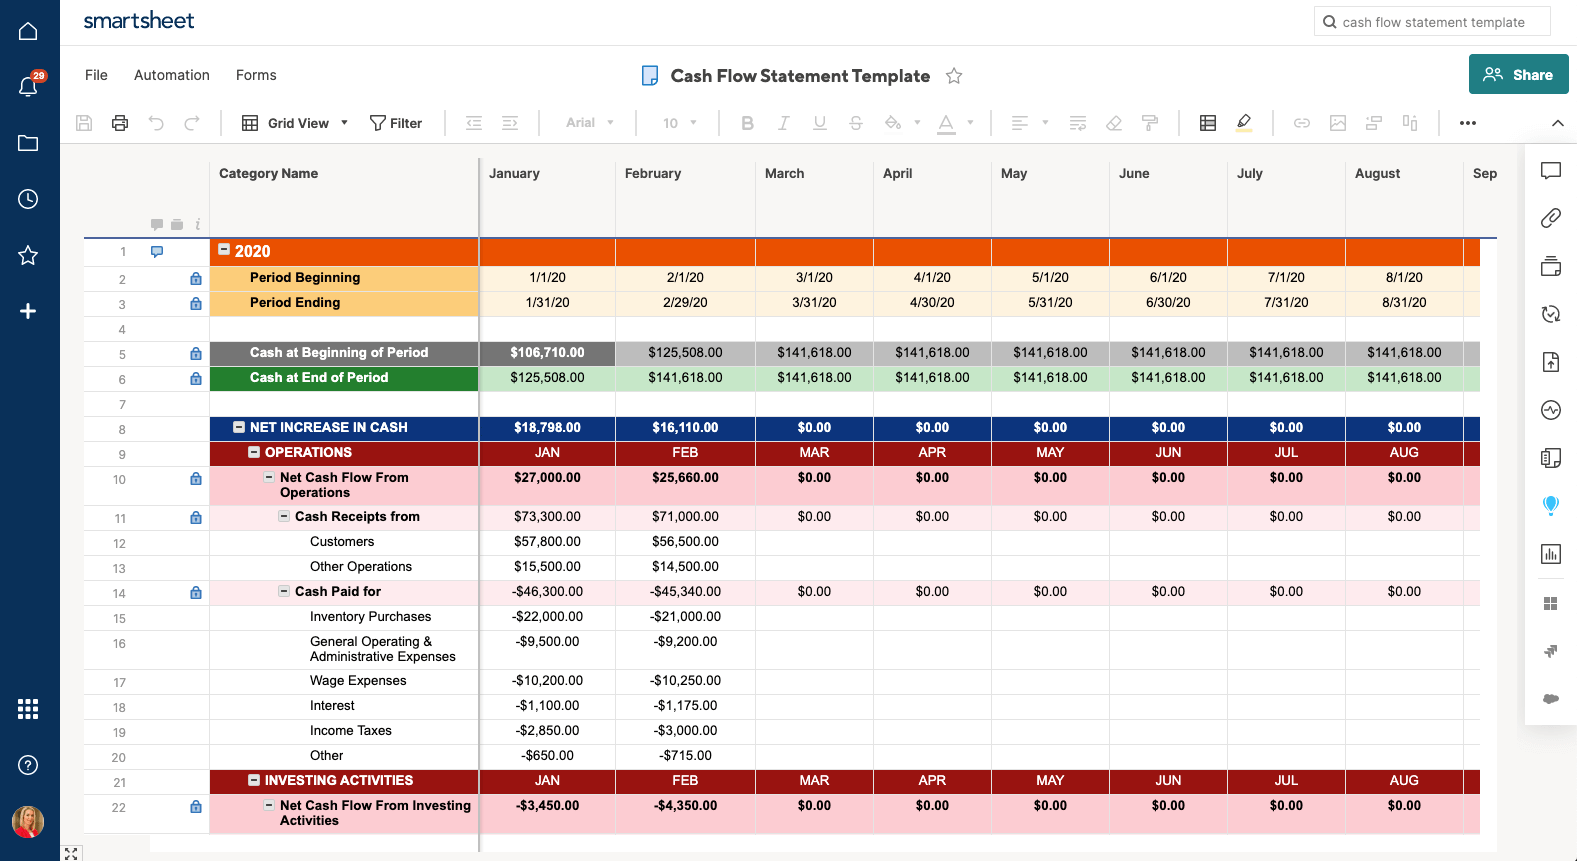
The world isn’t just Excel—integrate it with your ERP, CRM, or BI tools to automate data imports. Below are a few integration ideas.
Connecting with ERP Systems
Use Power Query to pull accounts payable and receivable data directly from your ERP. This ensures that the template always reflects real-time financials.
Linking with Google Sheets for Collaboration
Export your Excel template as a Google Sheet and share it with your finance team. Real-time collaboration can help catch errors before they become headaches.
Embedding in Power BI Dashboards
For executive-level presentations, embed the template’s key charts into Power BI for dynamic storytelling. This way, stakeholders can interact with data on the fly.
Tips to Make the Most of Your Template
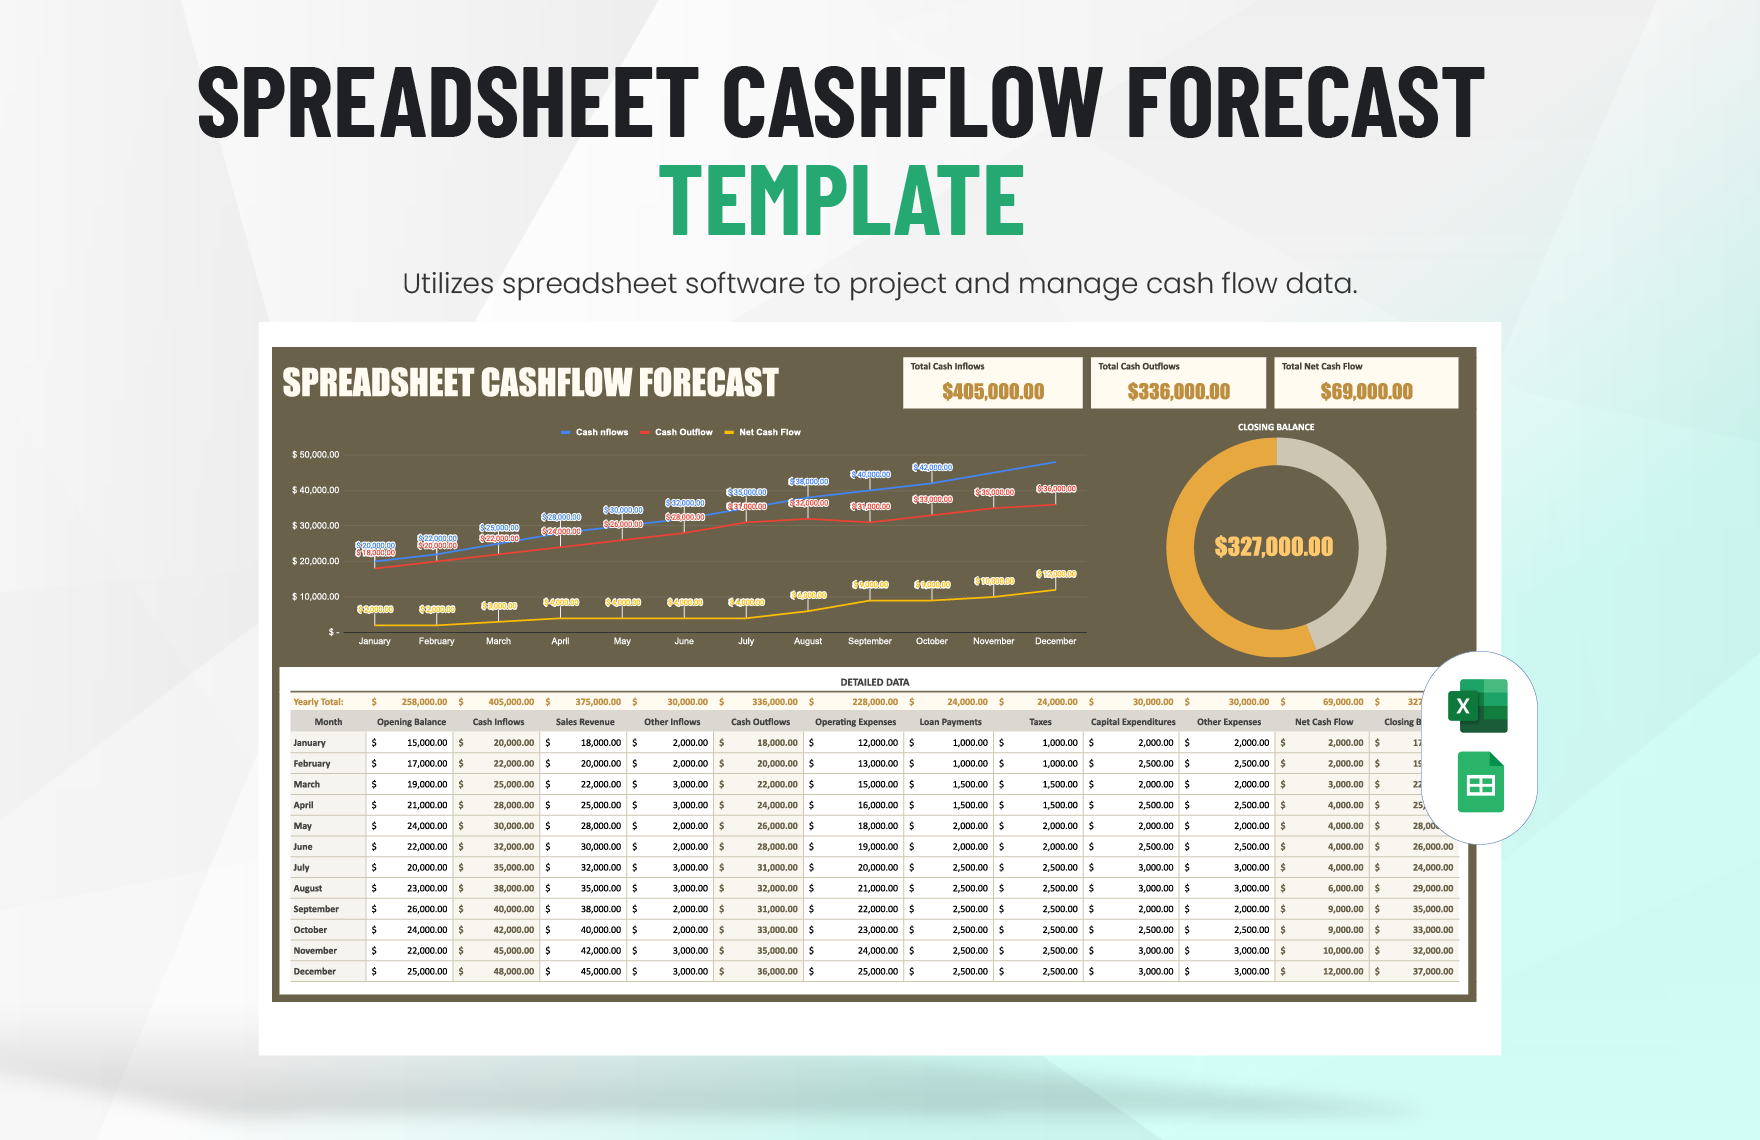
Beyond the standard steps, these hacks will make the template feel like a personal assistant.
1. Use Conditional Formatting Smartly
Color code high-value transactions in a distinct shade to catch your eye. This simple visual cue saves time during audit reviews.
2. Leverage Excel’s Table Feature
Convert data ranges into tables. This not only improves readability but also automatically expands formulas as you add new rows.
3. Build a ‘What-If’ Scenario Manager
Excel’s Scenario Manager can store multiple sets of inputs—ideal for comparing different financing options or market expansions.
4. Document Your Assumptions
Use comments or a dedicated notes column to explain the rationale behind key inputs. This documentation helps future users understand your logic.
Conclusion: Your New Best Friend
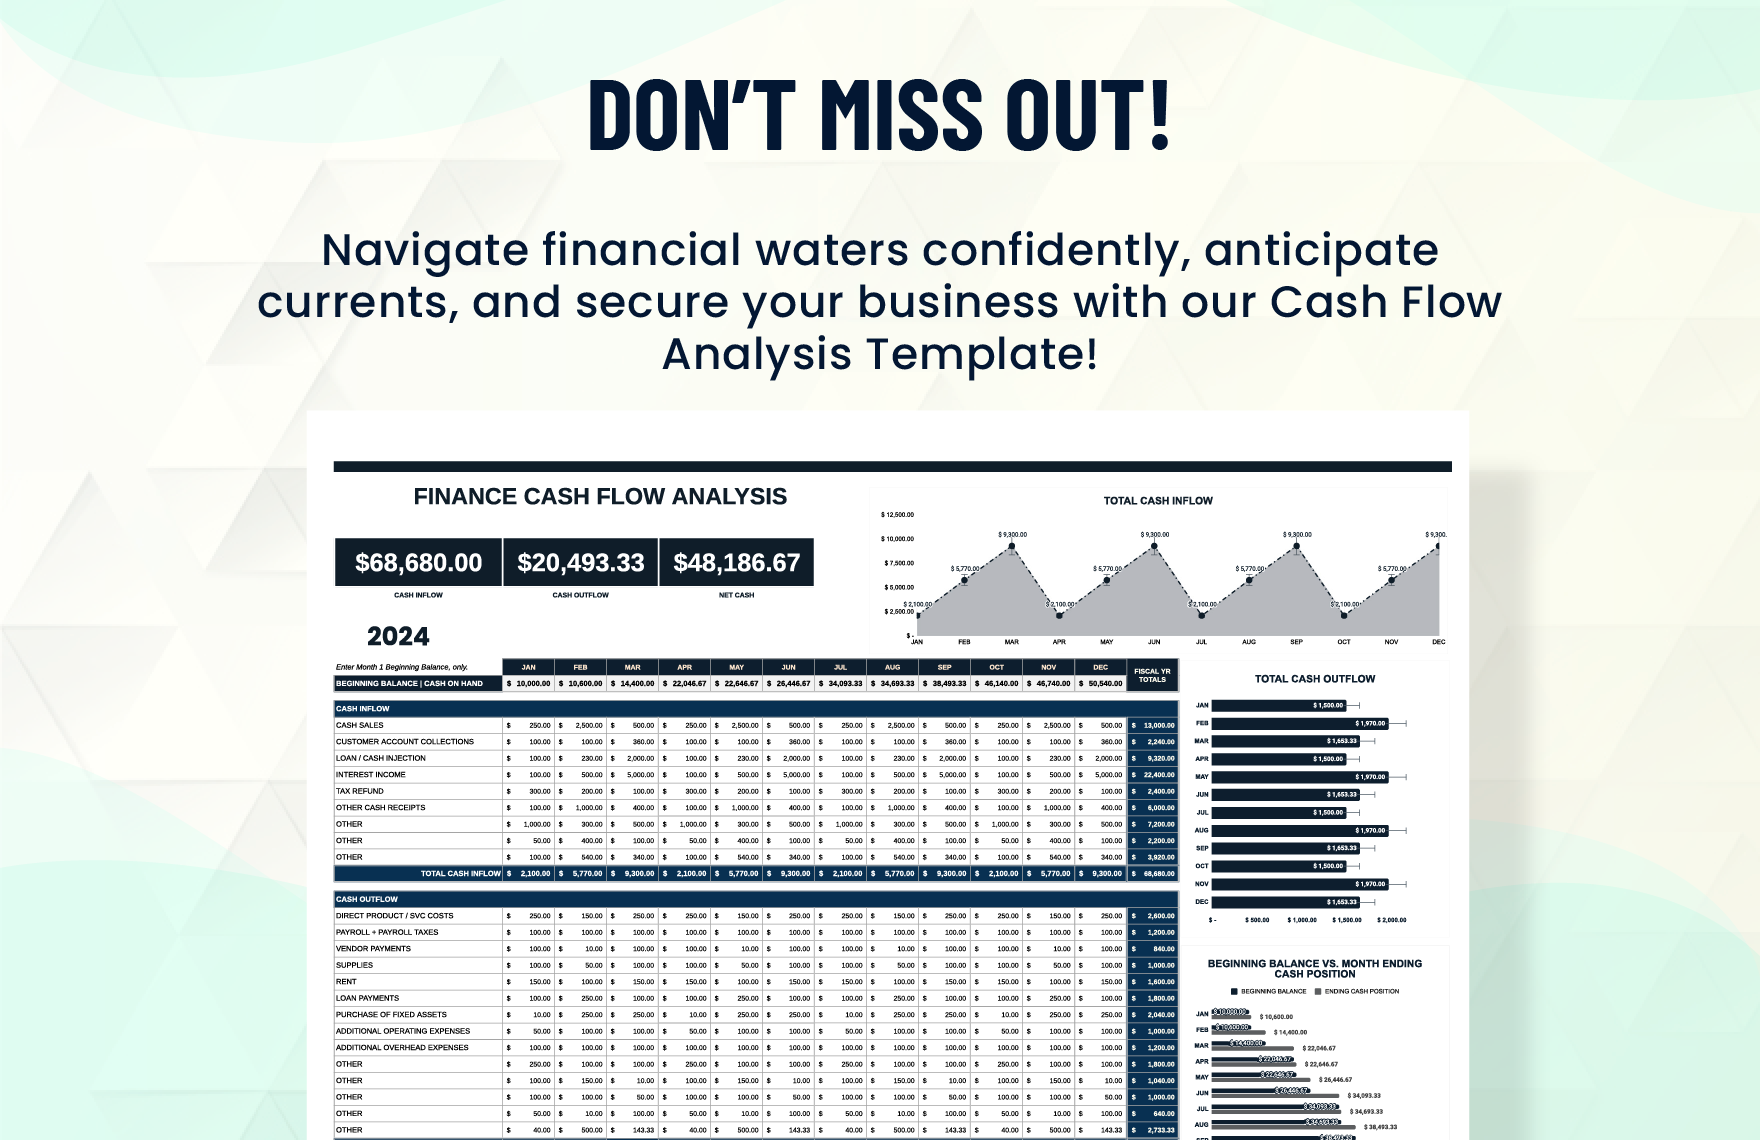
In the grand tapestry of business finance, a well-structured Global Cash Flow Analysis Excel Template is like a reliable compass—guiding you through the peaks and valleys of cash movement across continents. By following the steps above, customizing to your needs, and avoiding common pitfalls, you’ll transform the spreadsheet from a mundane task into a powerful, witty tool that sings your financial health loud and clear. Happy calculating, and may your cash flows always be positive and your coffee never run dry!

Related posts of "Global Cash Flow Analysis Excel Template"
