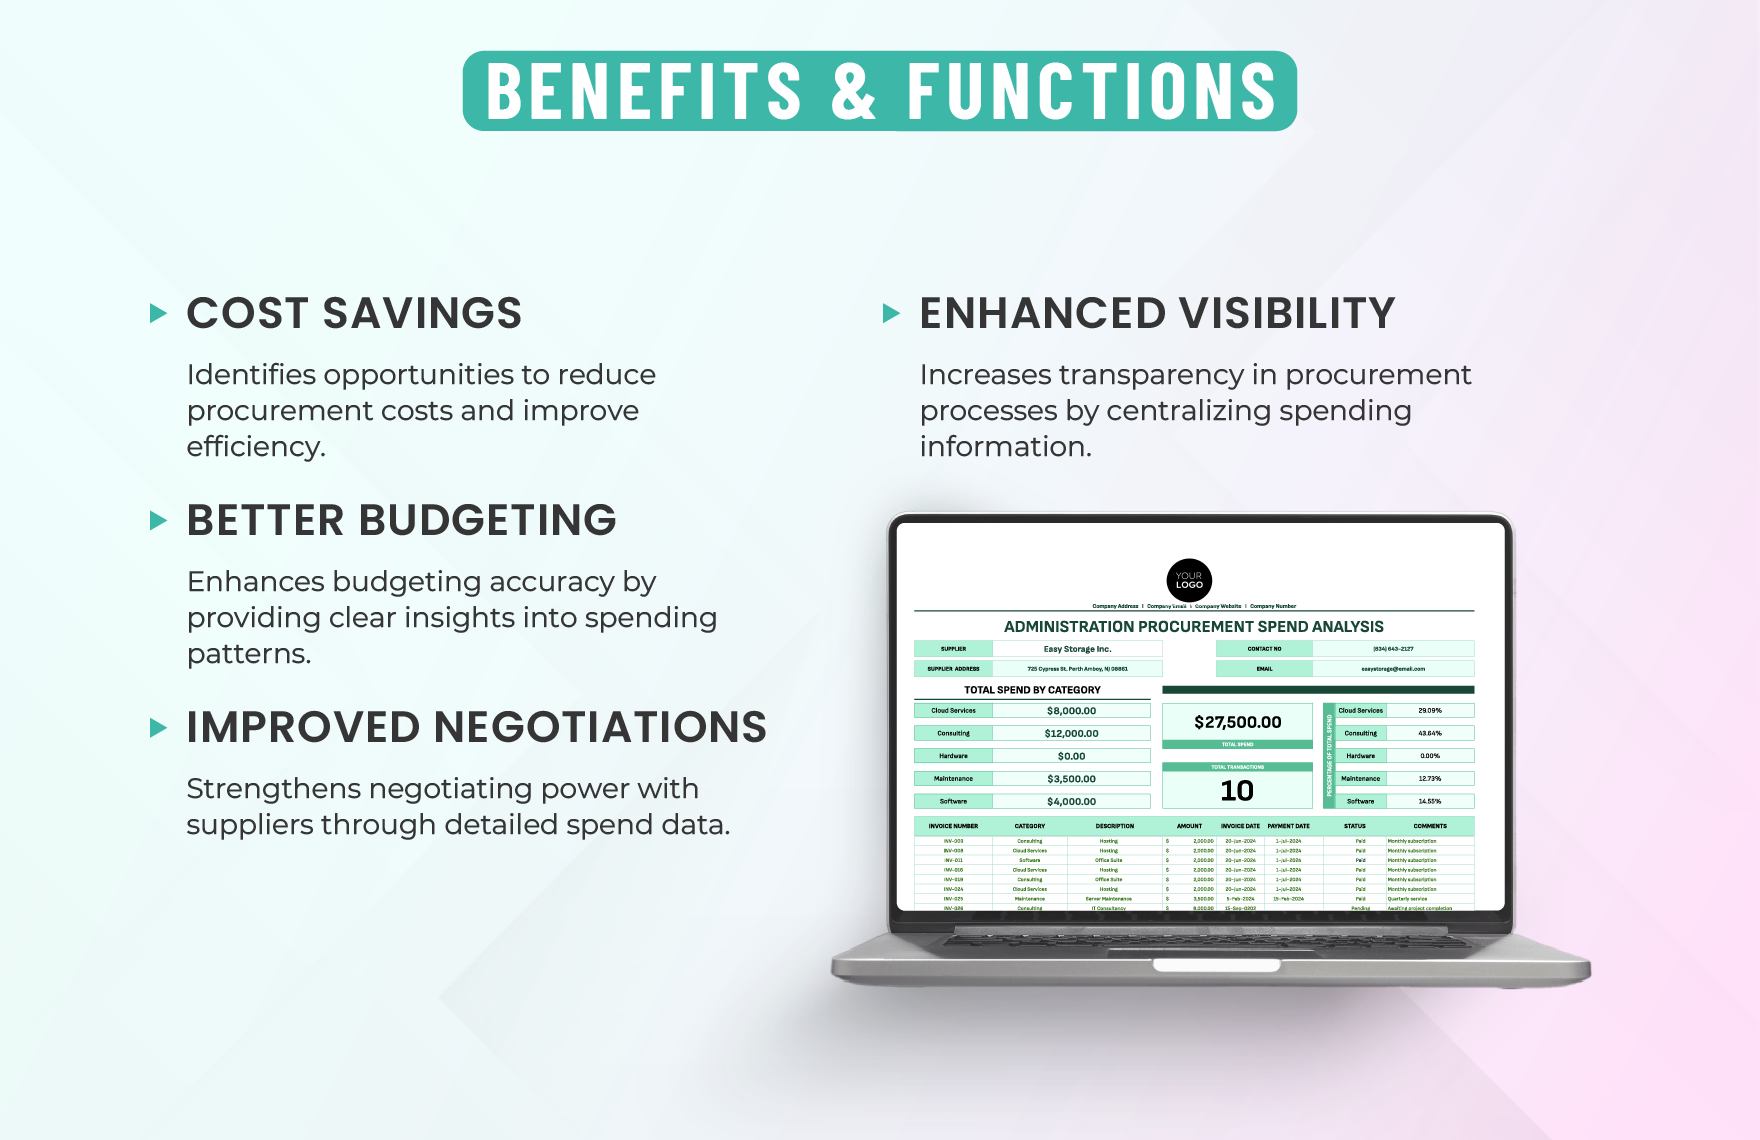
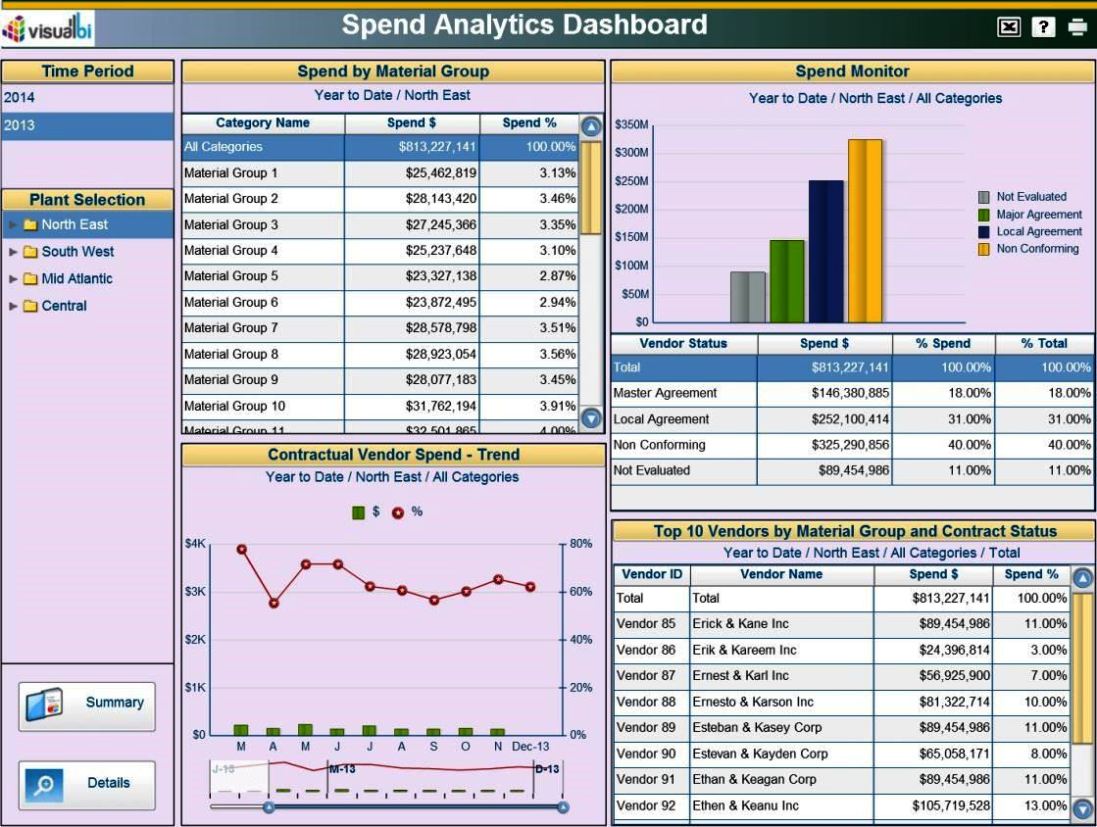
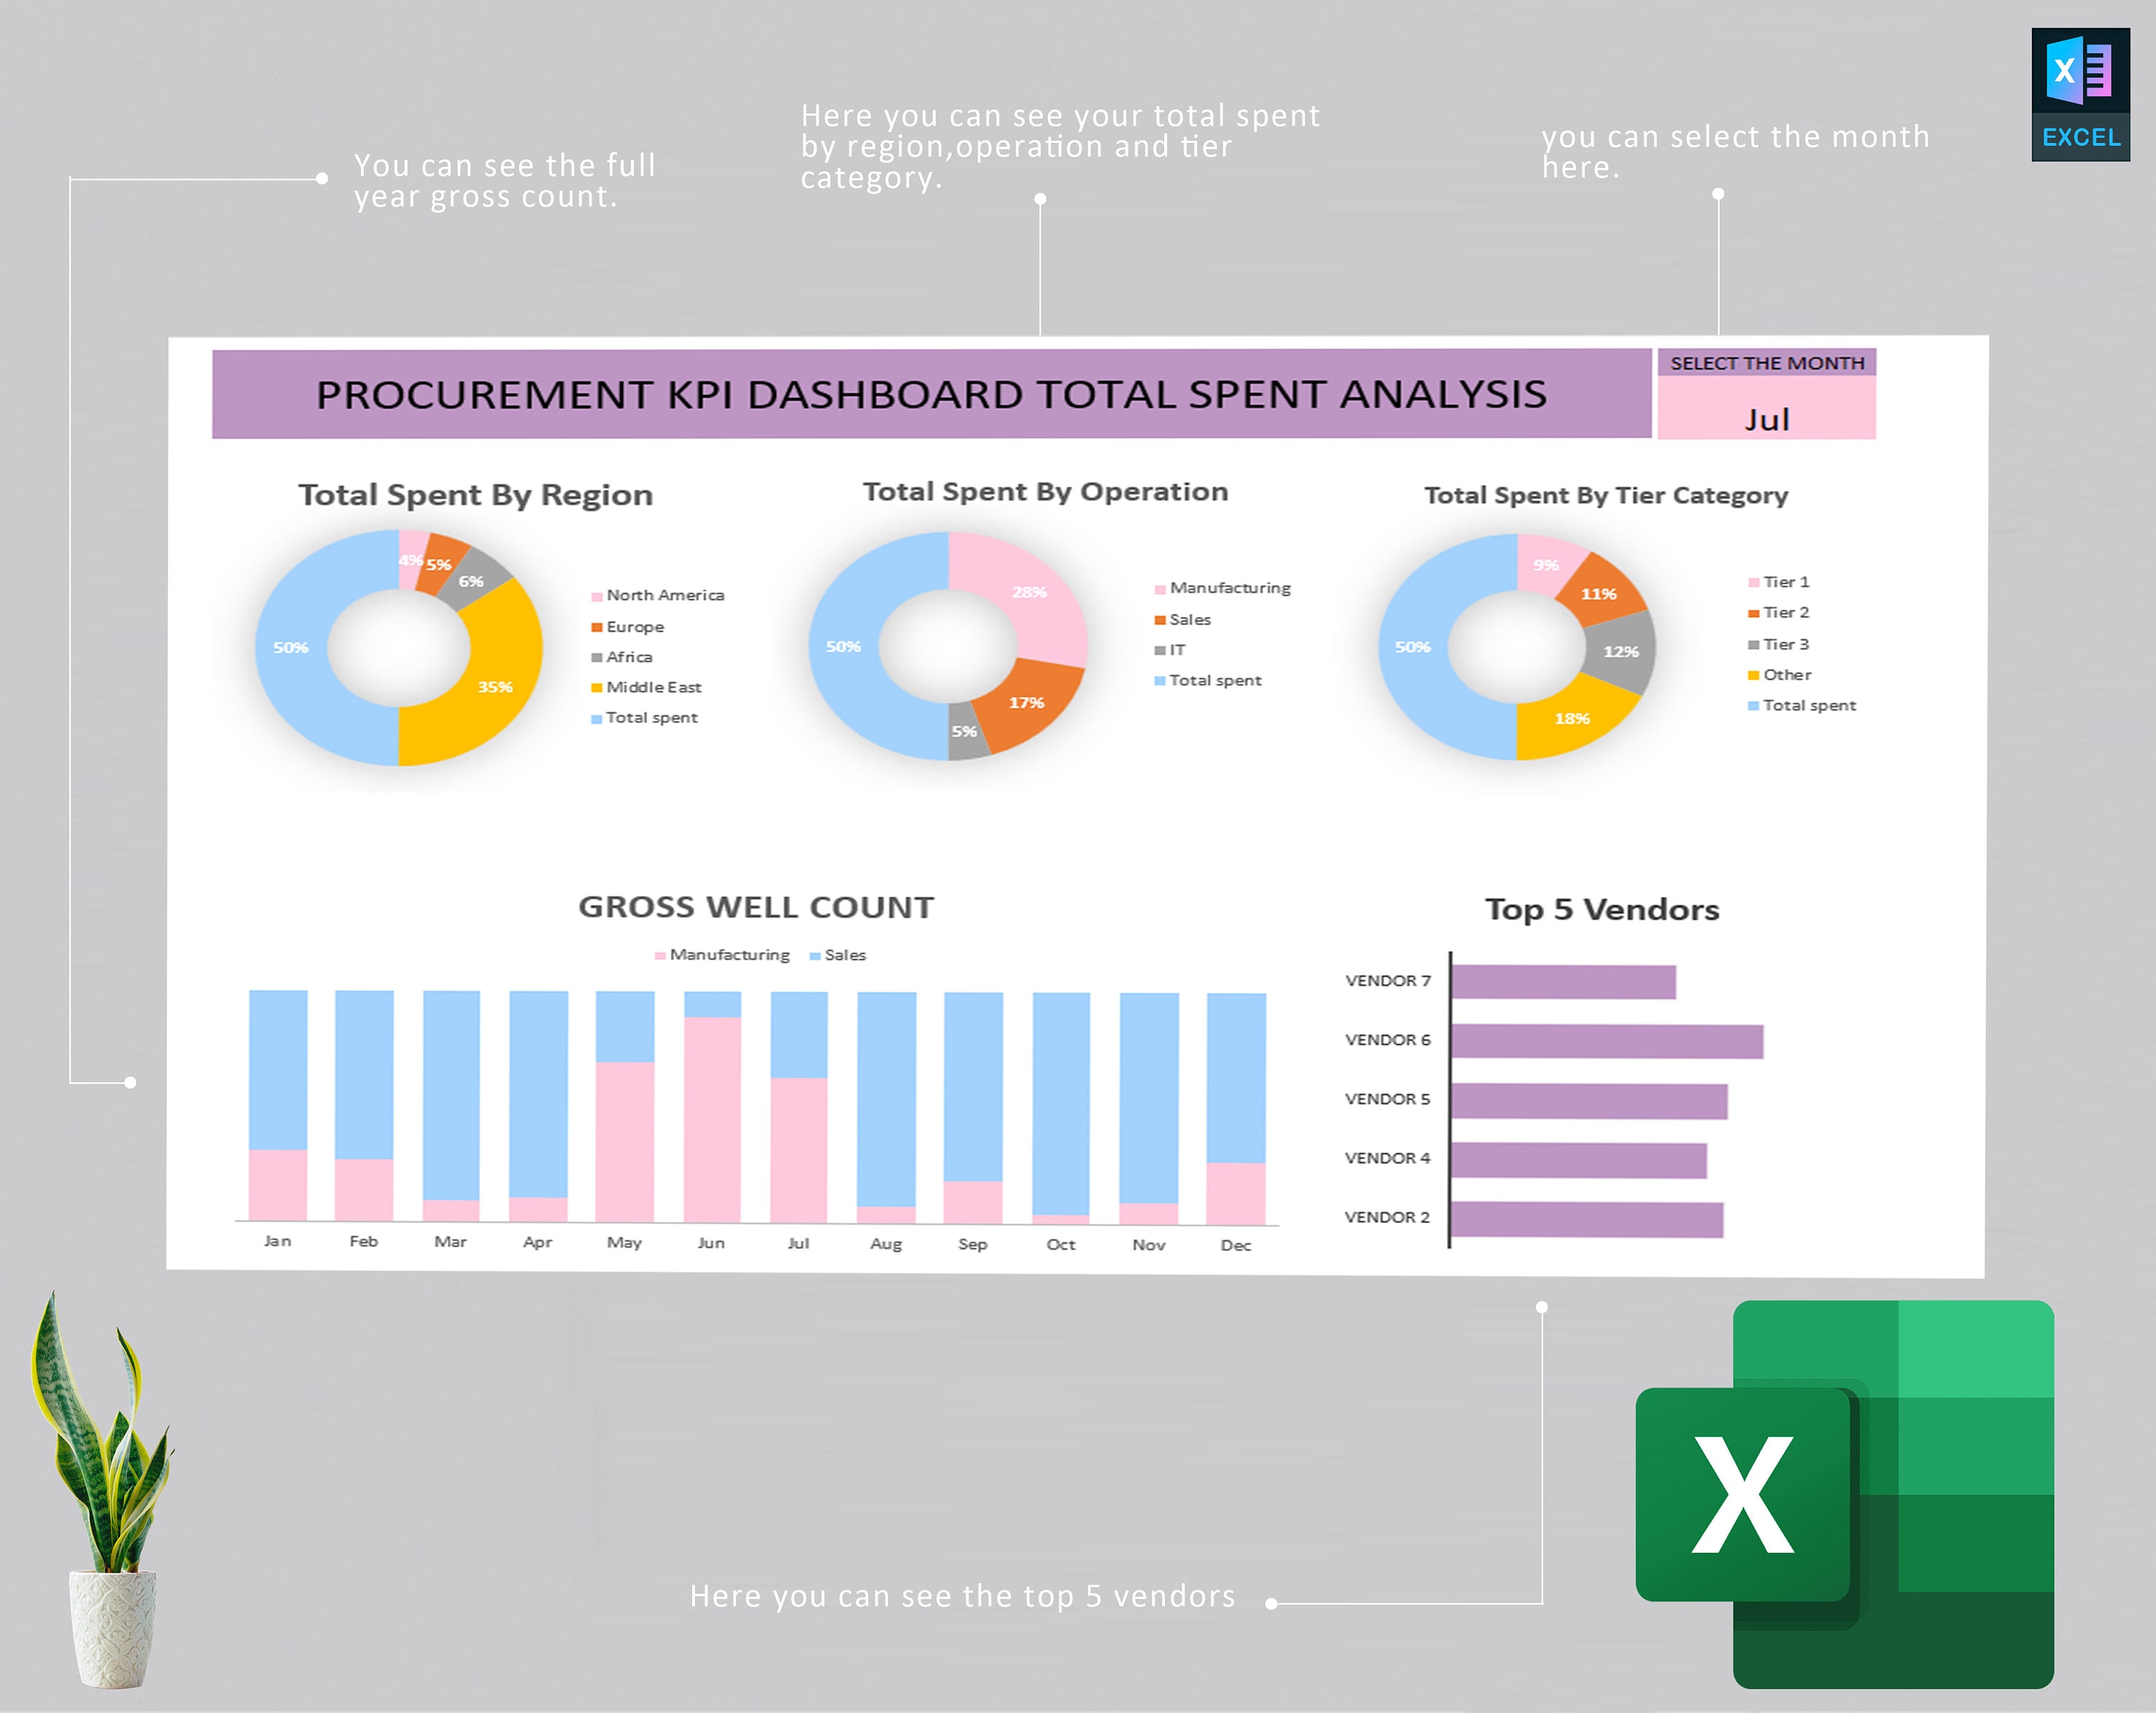
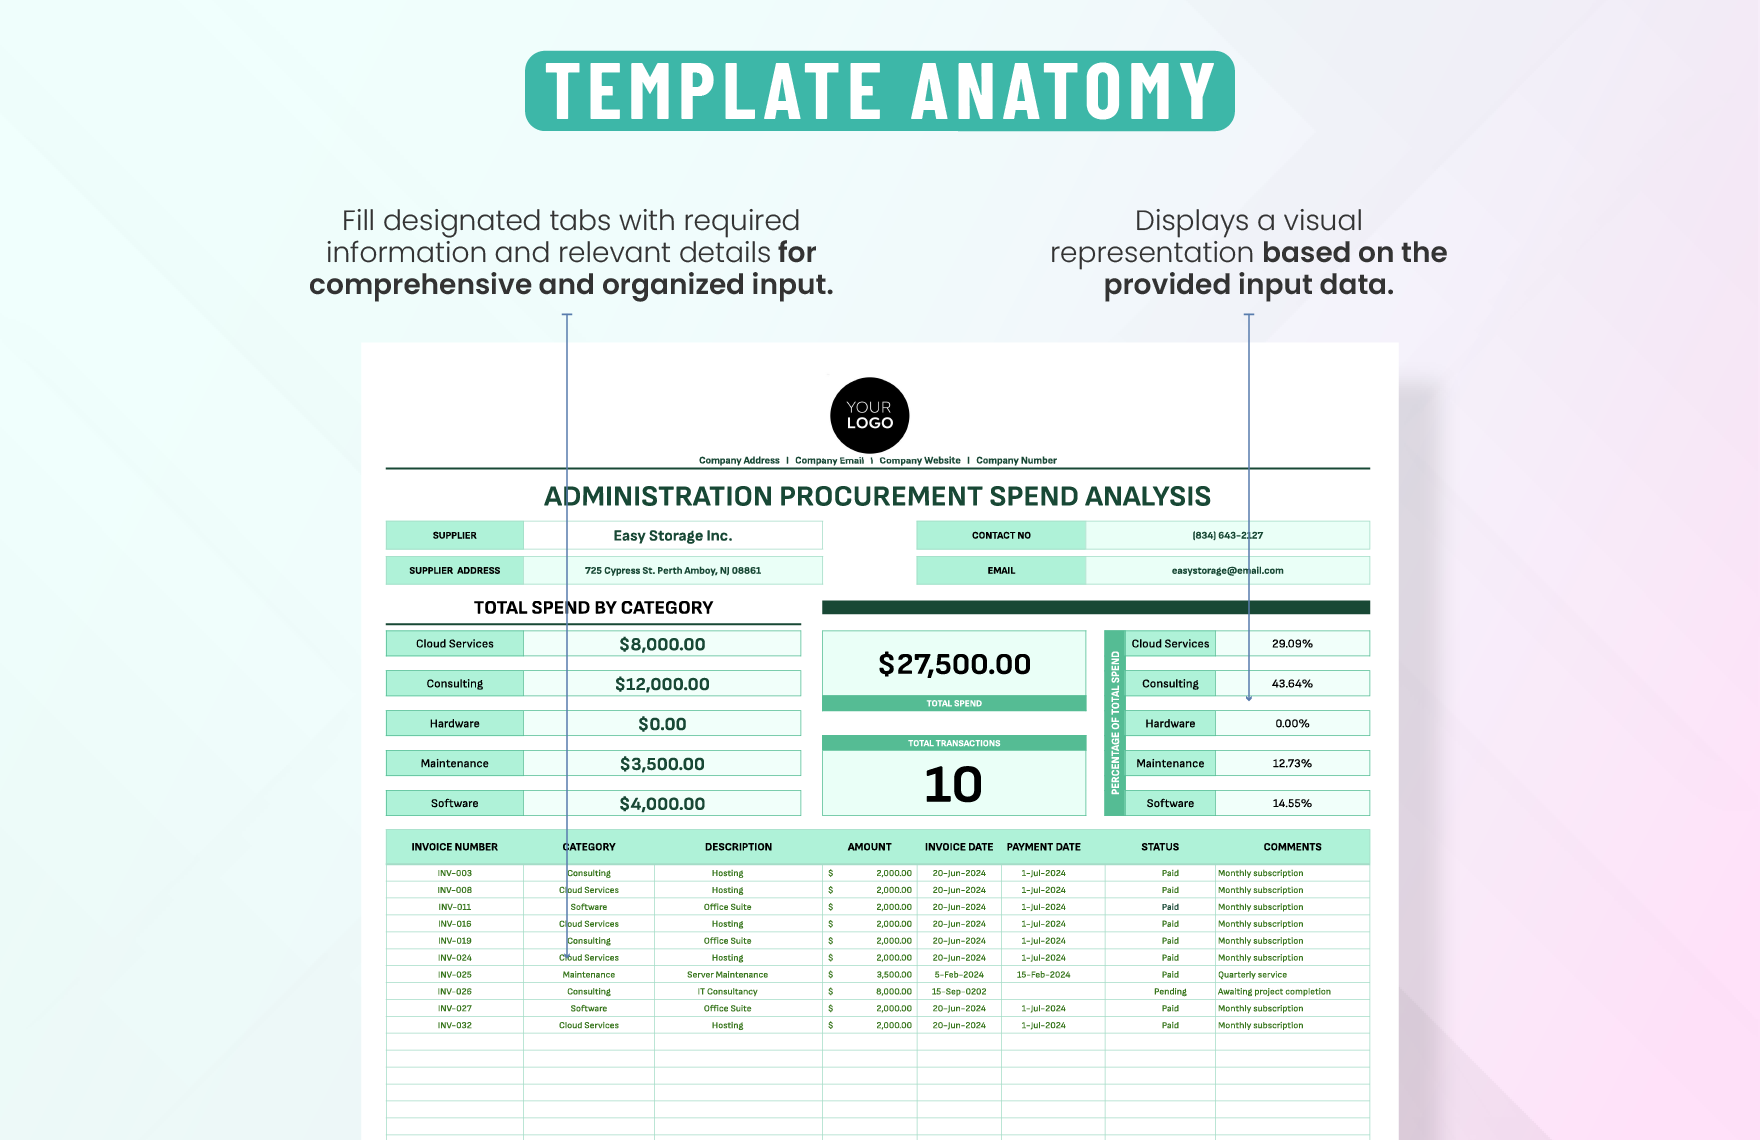
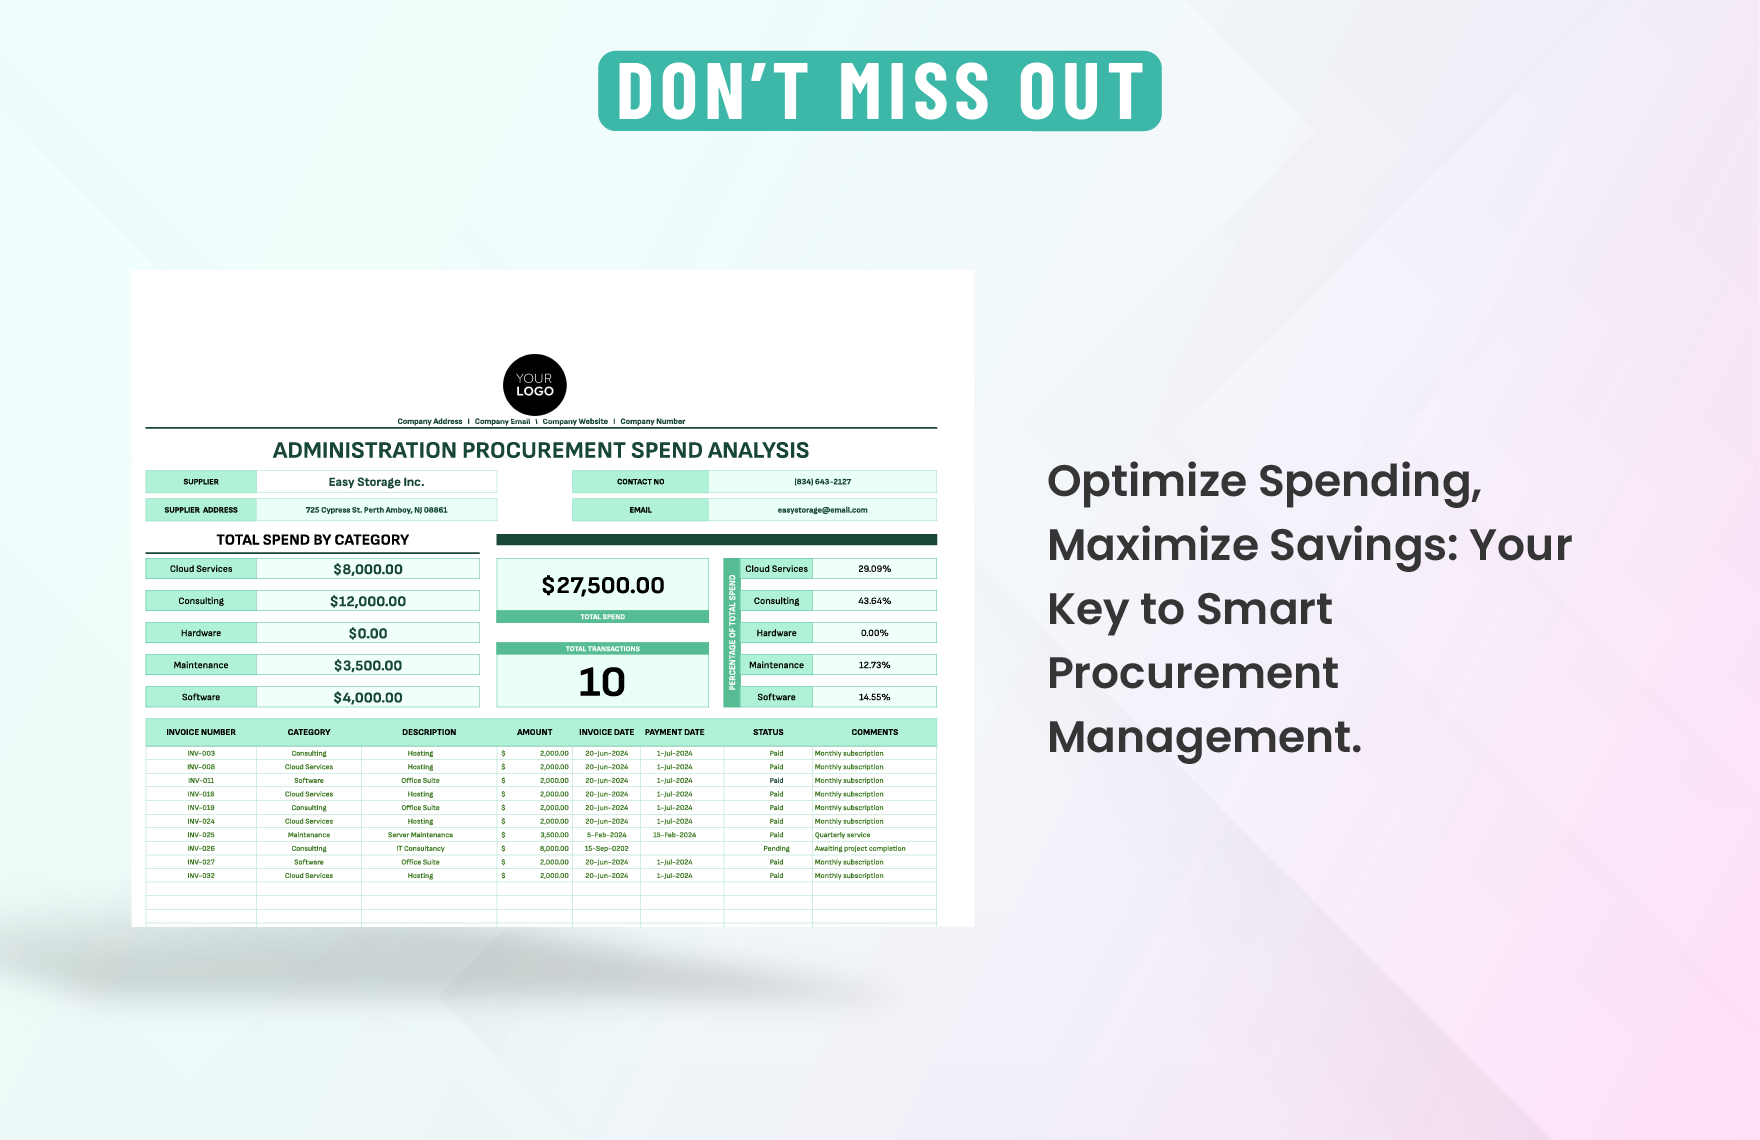
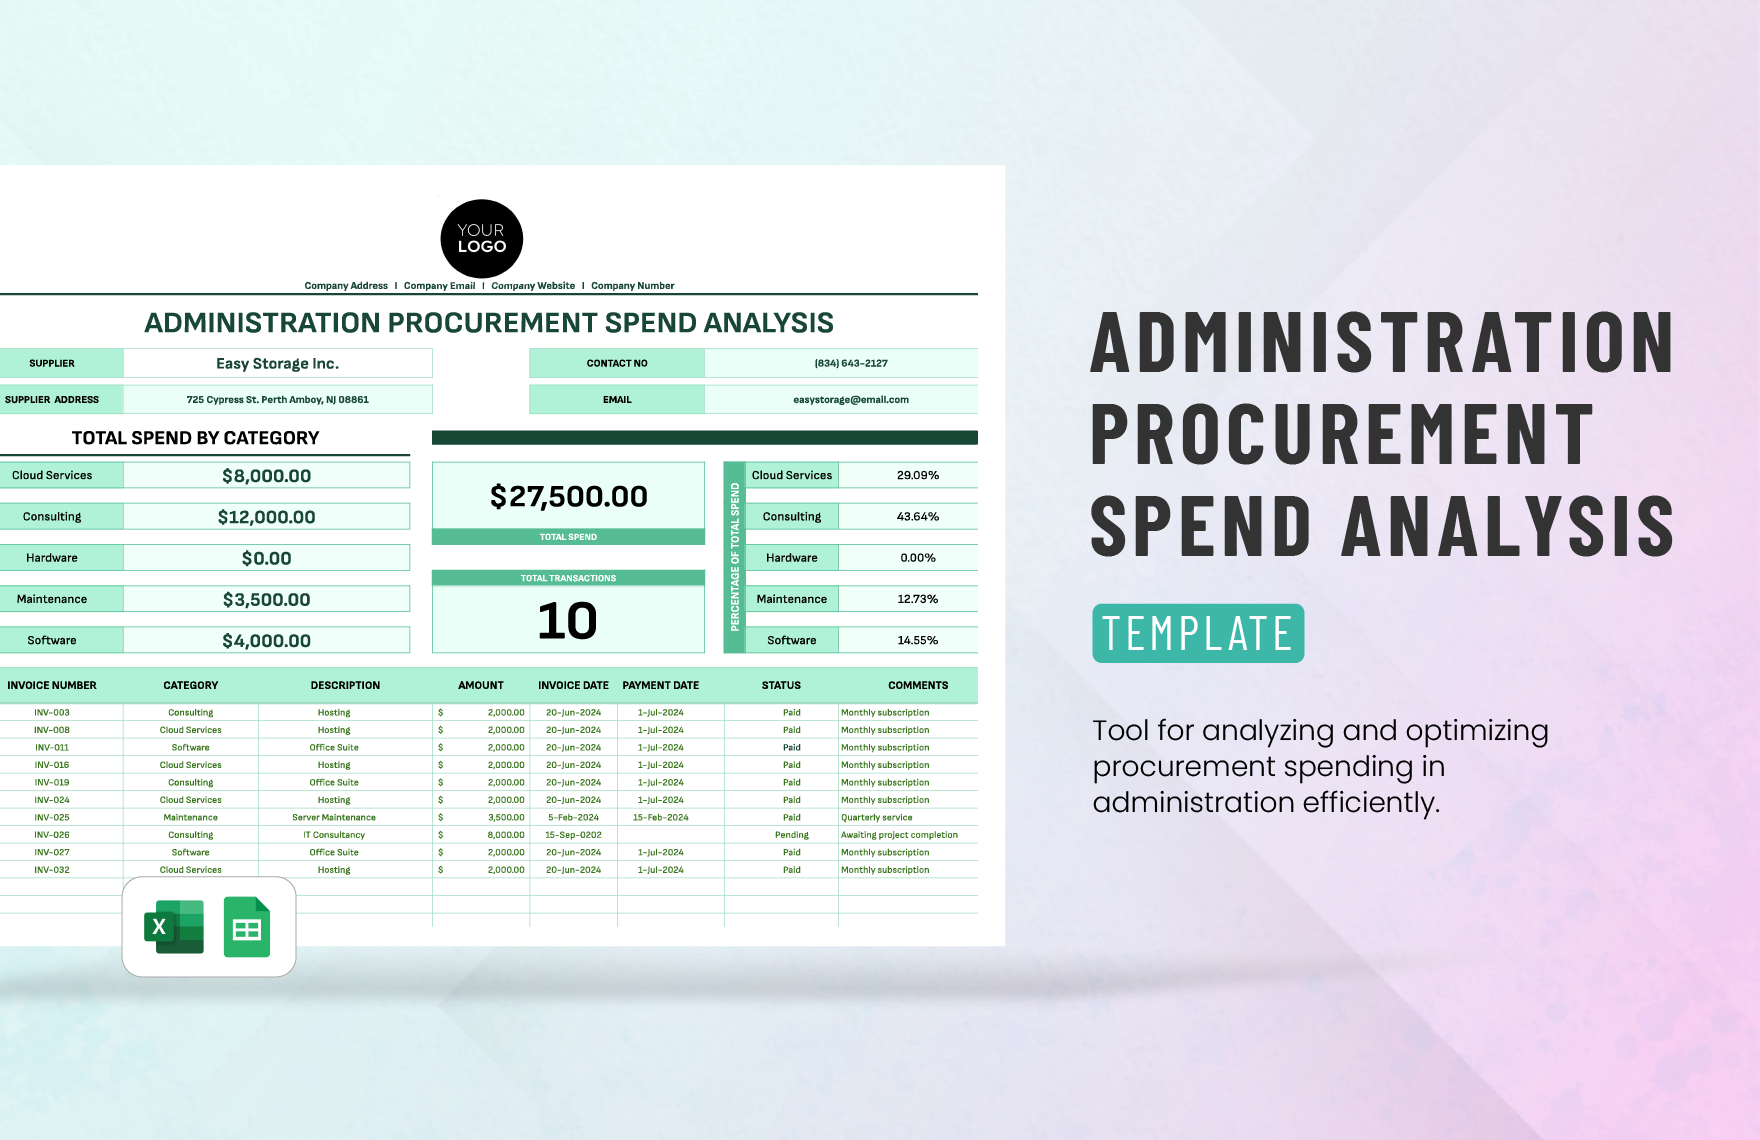
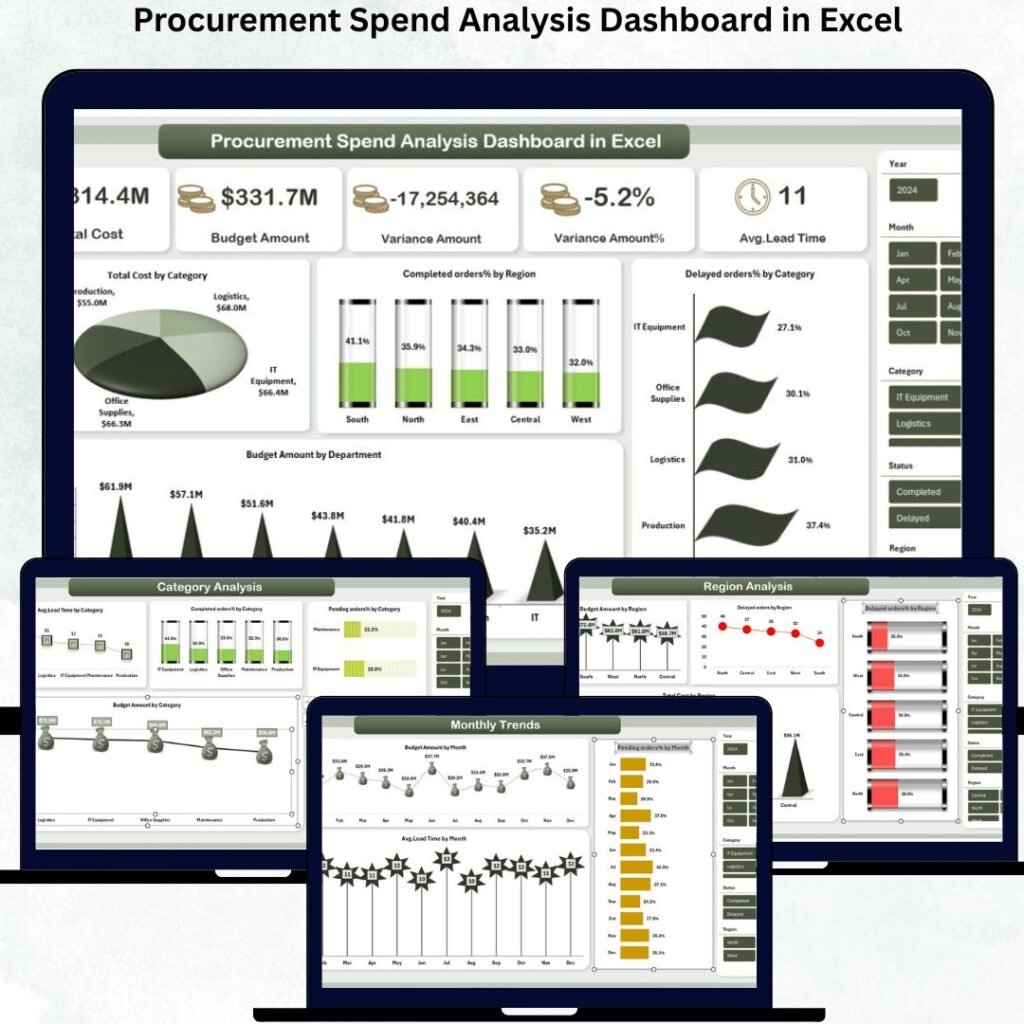
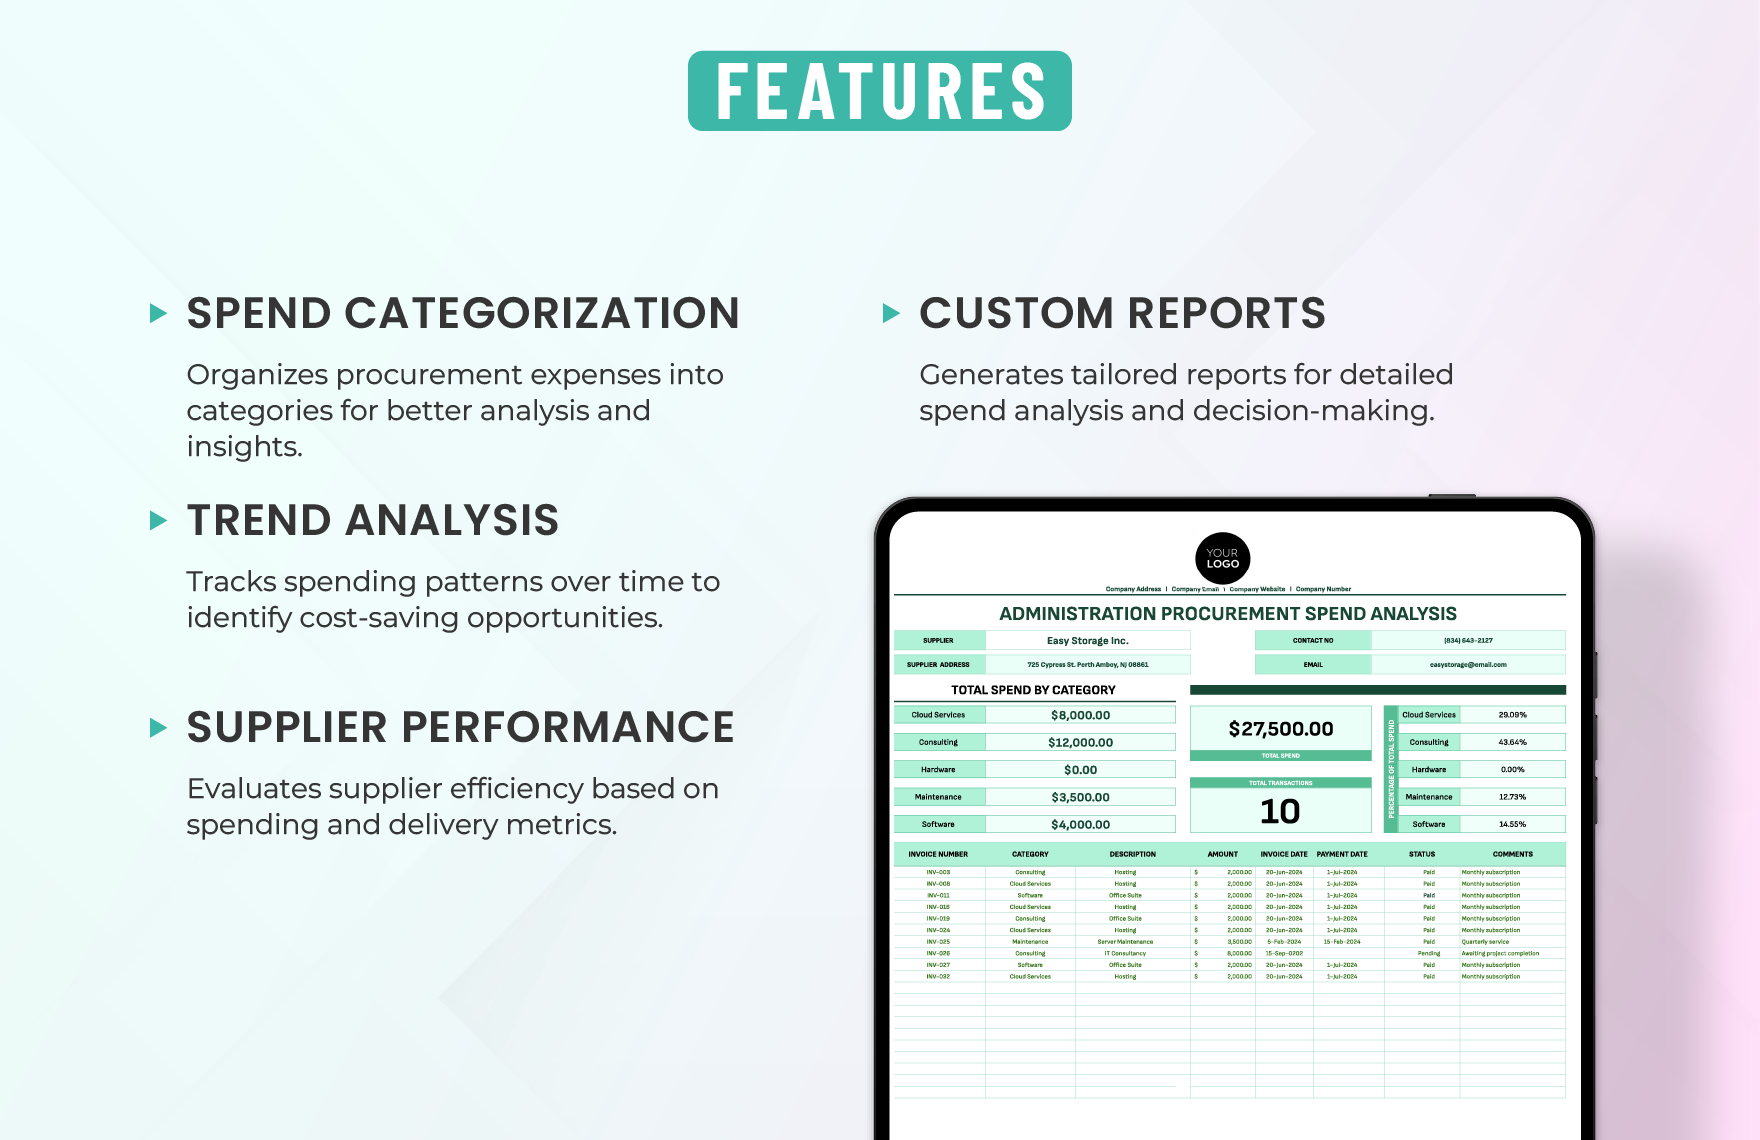
Procurement Spend Analysis Template Excel is the silent weapon every procurement professional needs when the margins are thin and the competition is ruthless; it cuts through the noise of invoices, contracts, and purchase orders to reveal the raw truth of where every dollar disappears. In a world where data is weaponized, a meticulously crafted Excel template becomes the battlefield map, showing you not just what you spend, but why you spend, where you bleed, and where you can strike back with precision. This guide dives deep into the anatomy of a high‑impact spend analysis template, offering a step‑by‑step roadmap that transforms raw data into actionable insight, all while maintaining a tone as unforgiving as the bottom line.
Why Spend Analysis Matters

Strategic Leverage Over Cost
Spend analysis is not a vanity metric; it is the cornerstone of strategic sourcing. By aggregating spend data across suppliers, categories, and business units, you gain leverage in negotiations, identify duplicate spend, and uncover opportunities for consolidation. The result is a tighter, more predictable cost structure that can be reinvested into growth initiatives.
Risk Mitigation
Every unchecked vendor relationship carries hidden risk—whether it be compliance breaches, supply chain disruptions, or price volatility. A robust spend analysis shines a light on these blind spots, enabling you to diversify sources, enforce contract compliance, and build resilience against market shocks.
Performance Benchmarking
Without a baseline, improvement is impossible. A spend analysis template provides a clear benchmark against industry standards and internal targets, allowing procurement teams to measure progress, celebrate wins, and recalibrate strategies when performance stalls.
Key Components of a Procurement Spend Analysis Template

Data Collection Framework
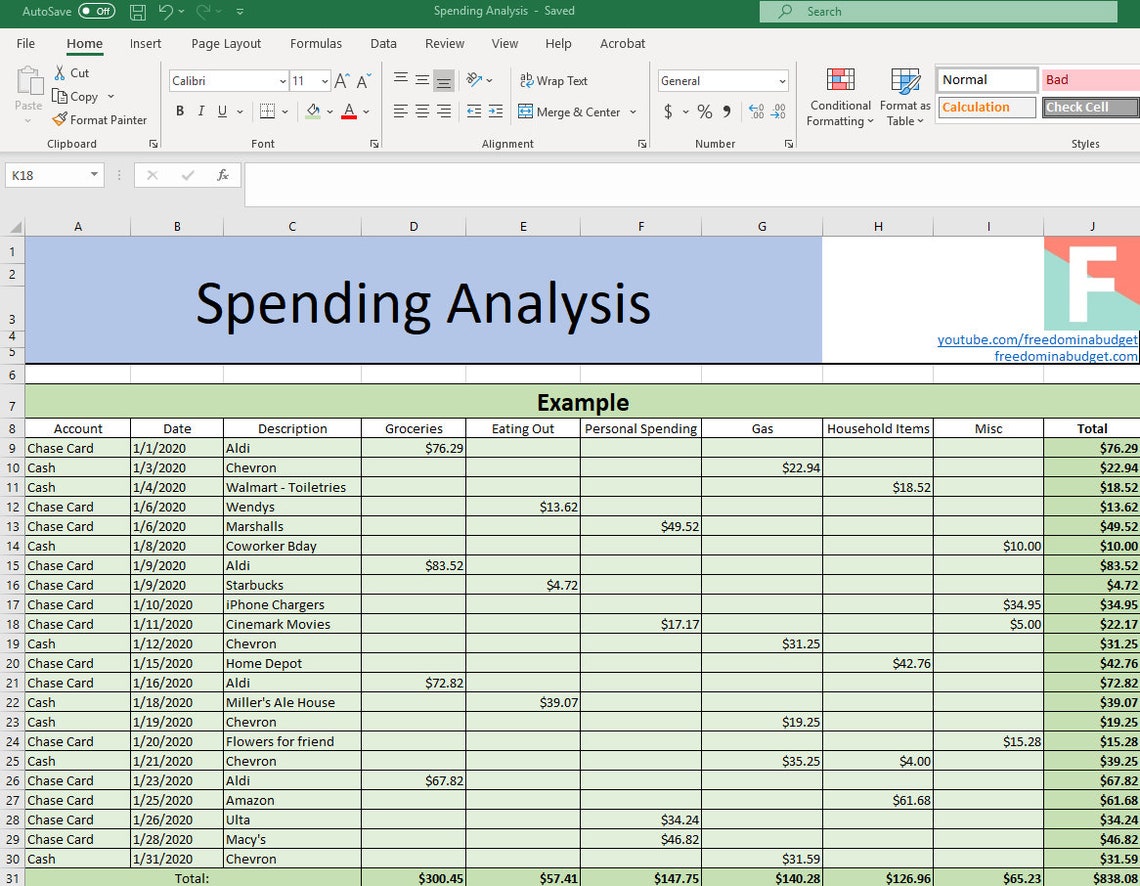
The foundation of any analysis is clean, comprehensive data. Your template should include fields for invoice number, date, supplier name, item description, quantity, unit price, total cost, cost center, and purchase order reference. Each column must be consistently formatted—dates as ISO 8601, monetary values in a single currency, and text fields trimmed of extraneous spaces.
Category Segmentation
Segmentation transforms chaos into clarity. Group spend by natural categories such as “Direct Materials,” “Indirect Services,” “IT Hardware,” and “Facilities.” Use Excel’s Data Validation lists to enforce consistent category labels, preventing the dreaded “Office Supplies” vs. “Office‑Supplies” mismatch.
Supplier Scoring Matrix
Beyond raw spend, evaluate suppliers on criteria like performance rating, risk score, and contract compliance. Add columns for these metrics and calculate a weighted score that can be visualized in conditional formatting heat maps, instantly flagging under‑performing partners.
Time‑Series Analysis
Spend is rarely static. Include a “Fiscal Year” or “Quarter” column and use PivotTables to track trends over time. Spot seasonality, sudden spikes, or gradual drifts that may indicate emerging risks or opportunities.
Compliance and Savings Tracking
Capture contract‑mandated pricing, discount thresholds, and rebate agreements in separate columns. Then, create formulas that compare actual spend against these benchmarks, automatically flagging non‑compliant transactions and calculating potential savings.
Building the Template in Excel
Step 1: Set Up the Data Input Sheet
Begin with a clean worksheet titled “RawData.” Define each column header in row 1, lock the row using Freeze Panes, and apply a Table style (Ctrl + T) to enable dynamic range expansion. This Table will be the source for all downstream analysis.
Step 2: Normalize Supplier Names
Duplicate supplier entries are a common plague. Add a helper column called “CleanSupplier” that uses the =TRIM(UPPER([@Supplier])) formula to strip spaces and unify case. Then, create a separate “Supplier Master” sheet that lists the canonical name and a unique ID; use VLOOKUP or XLOOKUP to replace the raw name with the ID.
Step 3: Build the Category Mapping Table
On a sheet named “Categories,” list every possible “Item Description” pattern alongside its assigned category. Use IFERROR(LOOKUP(...)) or a combination of SEARCH functions to auto‑assign categories as new rows are added to “RawData.”
Step 4: Create PivotTables for Core Views
Insert a PivotTable on a new sheet called “Dashboard.” Drag “Category” to Rows, “Supplier ID” to Columns, and “Total Cost” to Values (summarized as Sum). Add a slicer for “Fiscal Year” to enable quick toggling between periods. Duplicate this PivotTable to show “Spend by Cost Center” and “Spend by Quarter.”
Step 5: Add Conditional Formatting for Alerts
Highlight spend that exceeds a defined threshold—say, any supplier contributing more than 10 % of total spend. Select the appropriate PivotTable field, choose Conditional Formatting → Top/Bottom Rules → Top 10 % Items, and set a bold red fill. This visual cue forces the reader to confront concentration risk.
Step 6: Embed Savings Calculations
Insert a column called “TargetPrice” that pulls contractual pricing from a “Contracts” sheet via INDEX/MATCH. Then, compute “Savings” as =[@TotalCost]-[@TargetPrice]*[@Quantity]. Summarize total savings in a dedicated KPI box using the GETPIVOTDATA function.
Step 7: Protect and Share
Lock the structure of the workbook (Review → Protect Workbook) to prevent accidental alteration of formulas. Use Excel’s built‑in sharing capabilities or export the dashboard as a PDF for executive review. Ensure that the raw data sheet remains read‑only to preserve auditability.
Advanced Features and Automation

Power Query for Data Ingestion
Manual data entry is a death sentence for accuracy. Leverage Power Query to pull data directly from ERP systems, CSV exports, or cloud‑based procurement platforms. Set up a repeatable query that cleanses dates, merges duplicate rows, and appends new records on each refresh.
Dynamic Named Ranges
Replace static ranges with dynamic named ranges that automatically expand as new rows are added. Use the =OFFSET and =COUNTA functions within the Name Manager to keep formulas and charts perpetually up‑to‑date.
Macro‑Driven Report Generation
Write a VBA macro that, upon execution, refreshes all Power Query connections, updates PivotTables, applies conditional formatting, and exports a snapshot of the dashboard to a timestamped file. This one‑click operation frees analysts from repetitive chores, allowing them to focus on interpretation.
Integration with Power BI
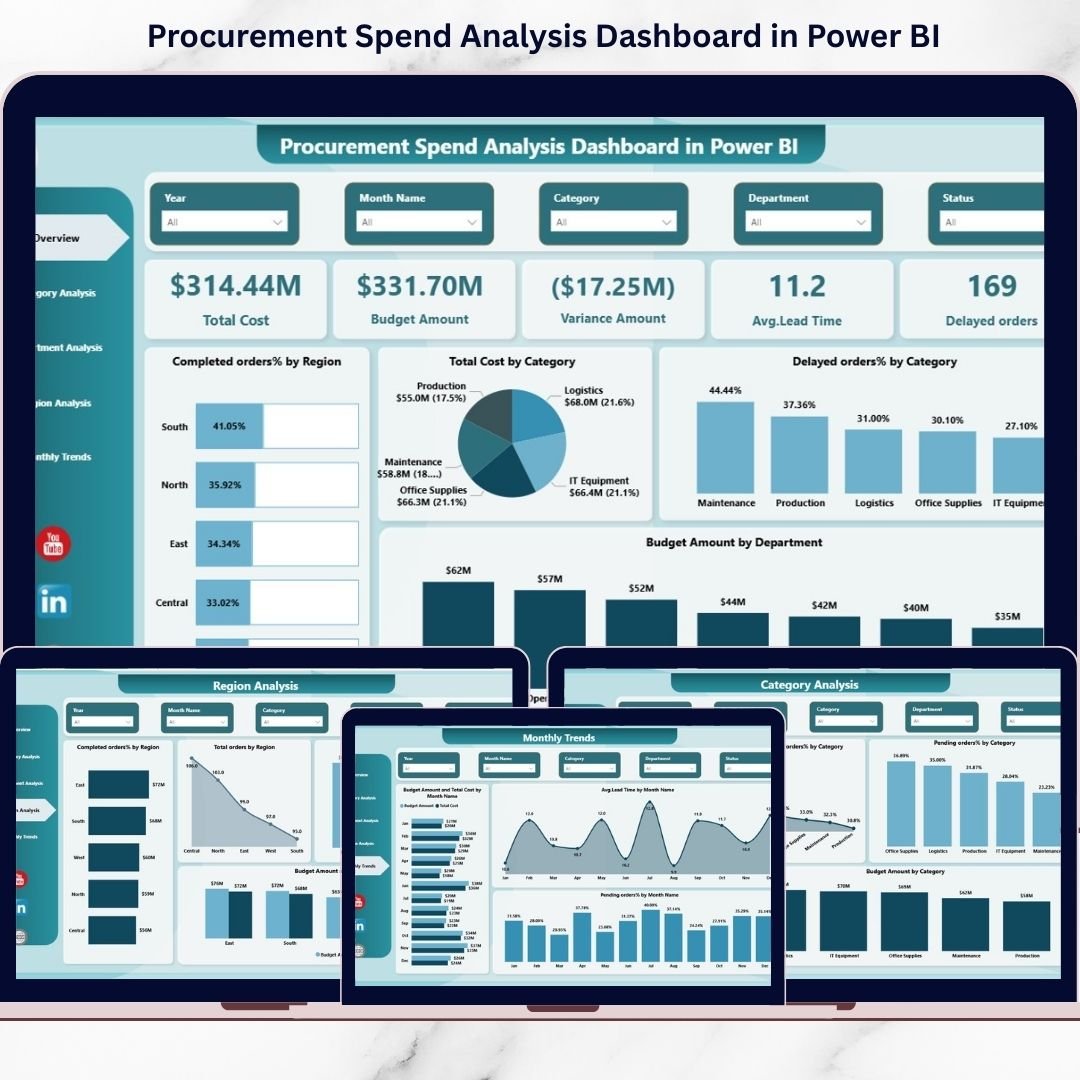
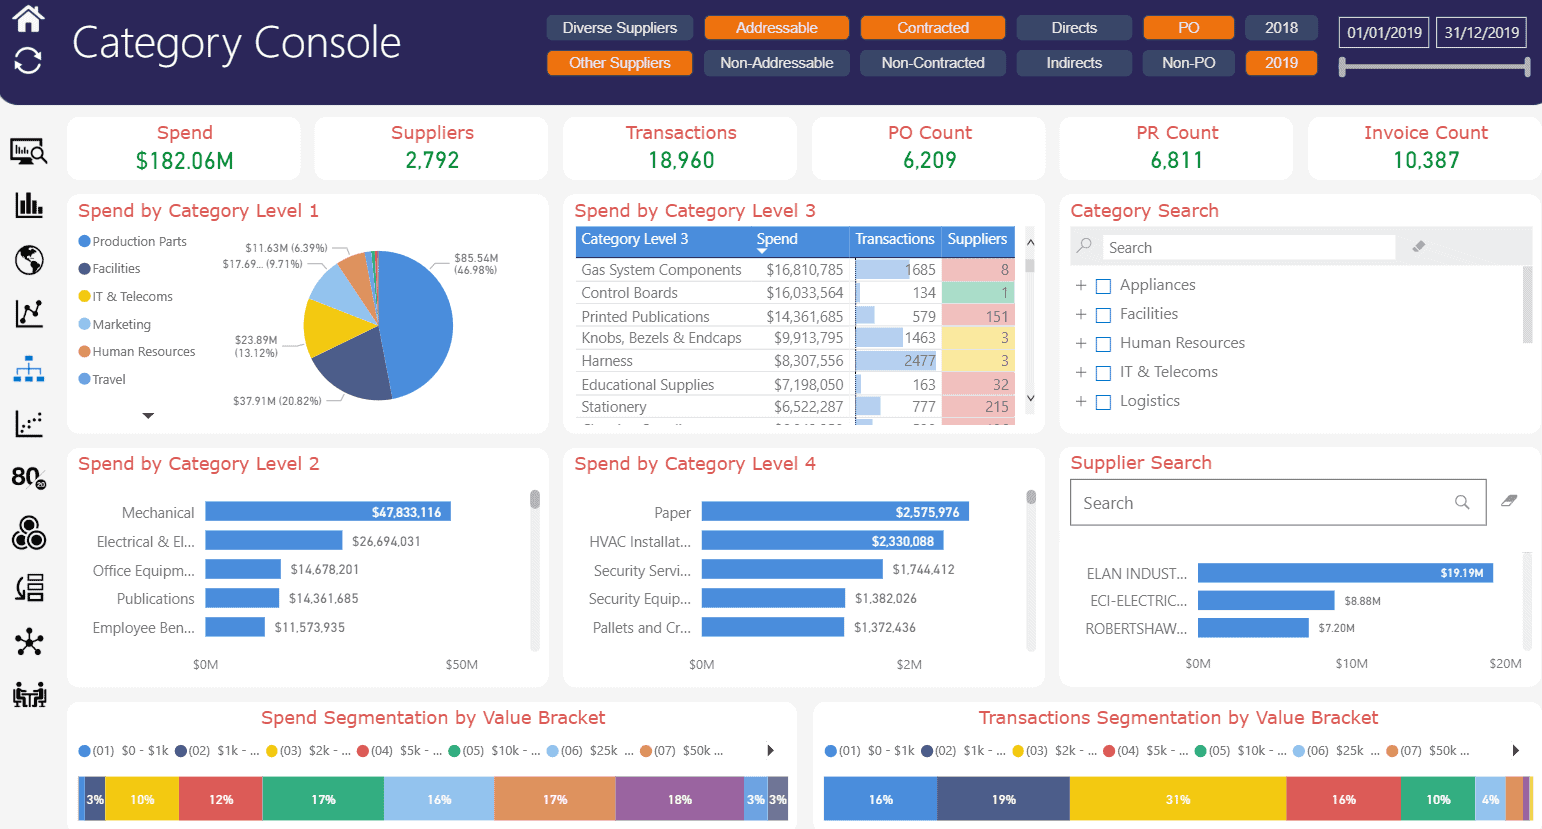
For organizations that demand interactive visual storytelling, export the cleaned Table to Power BI. The same data model can be enriched with geographic maps, drill‑through capabilities, and AI‑driven anomaly detection, turning a static Excel file into a living decision engine.
Real‑World Use Cases
Manufacturing Consolidation
A mid‑size automotive parts manufacturer used the template to uncover that 23 % of its raw material spend was duplicated across three subsidiaries. By consolidating orders under a single contract, they negotiated a 7 % price reduction, translating to $1.2 million in annual savings.
IT Services Optimization
A regional health system mapped its IT spend and discovered that a legacy licensing model caused a 15 % over‑payment on software renewals. The template highlighted the discrepancy, prompting a renegotiation that yielded a $350 k reduction and freed budget for cybersecurity upgrades.
Facilities Management Risk Reduction
A university’s facilities department identified that 12 % of its cleaning services were sourced from unvetted contractors lacking proper insurance. The risk matrix within the template flagged these vendors, leading to an audit and subsequent transition to compliant providers, averting potential liability.
Best Practices for Ongoing Management
Maintain Data Hygiene
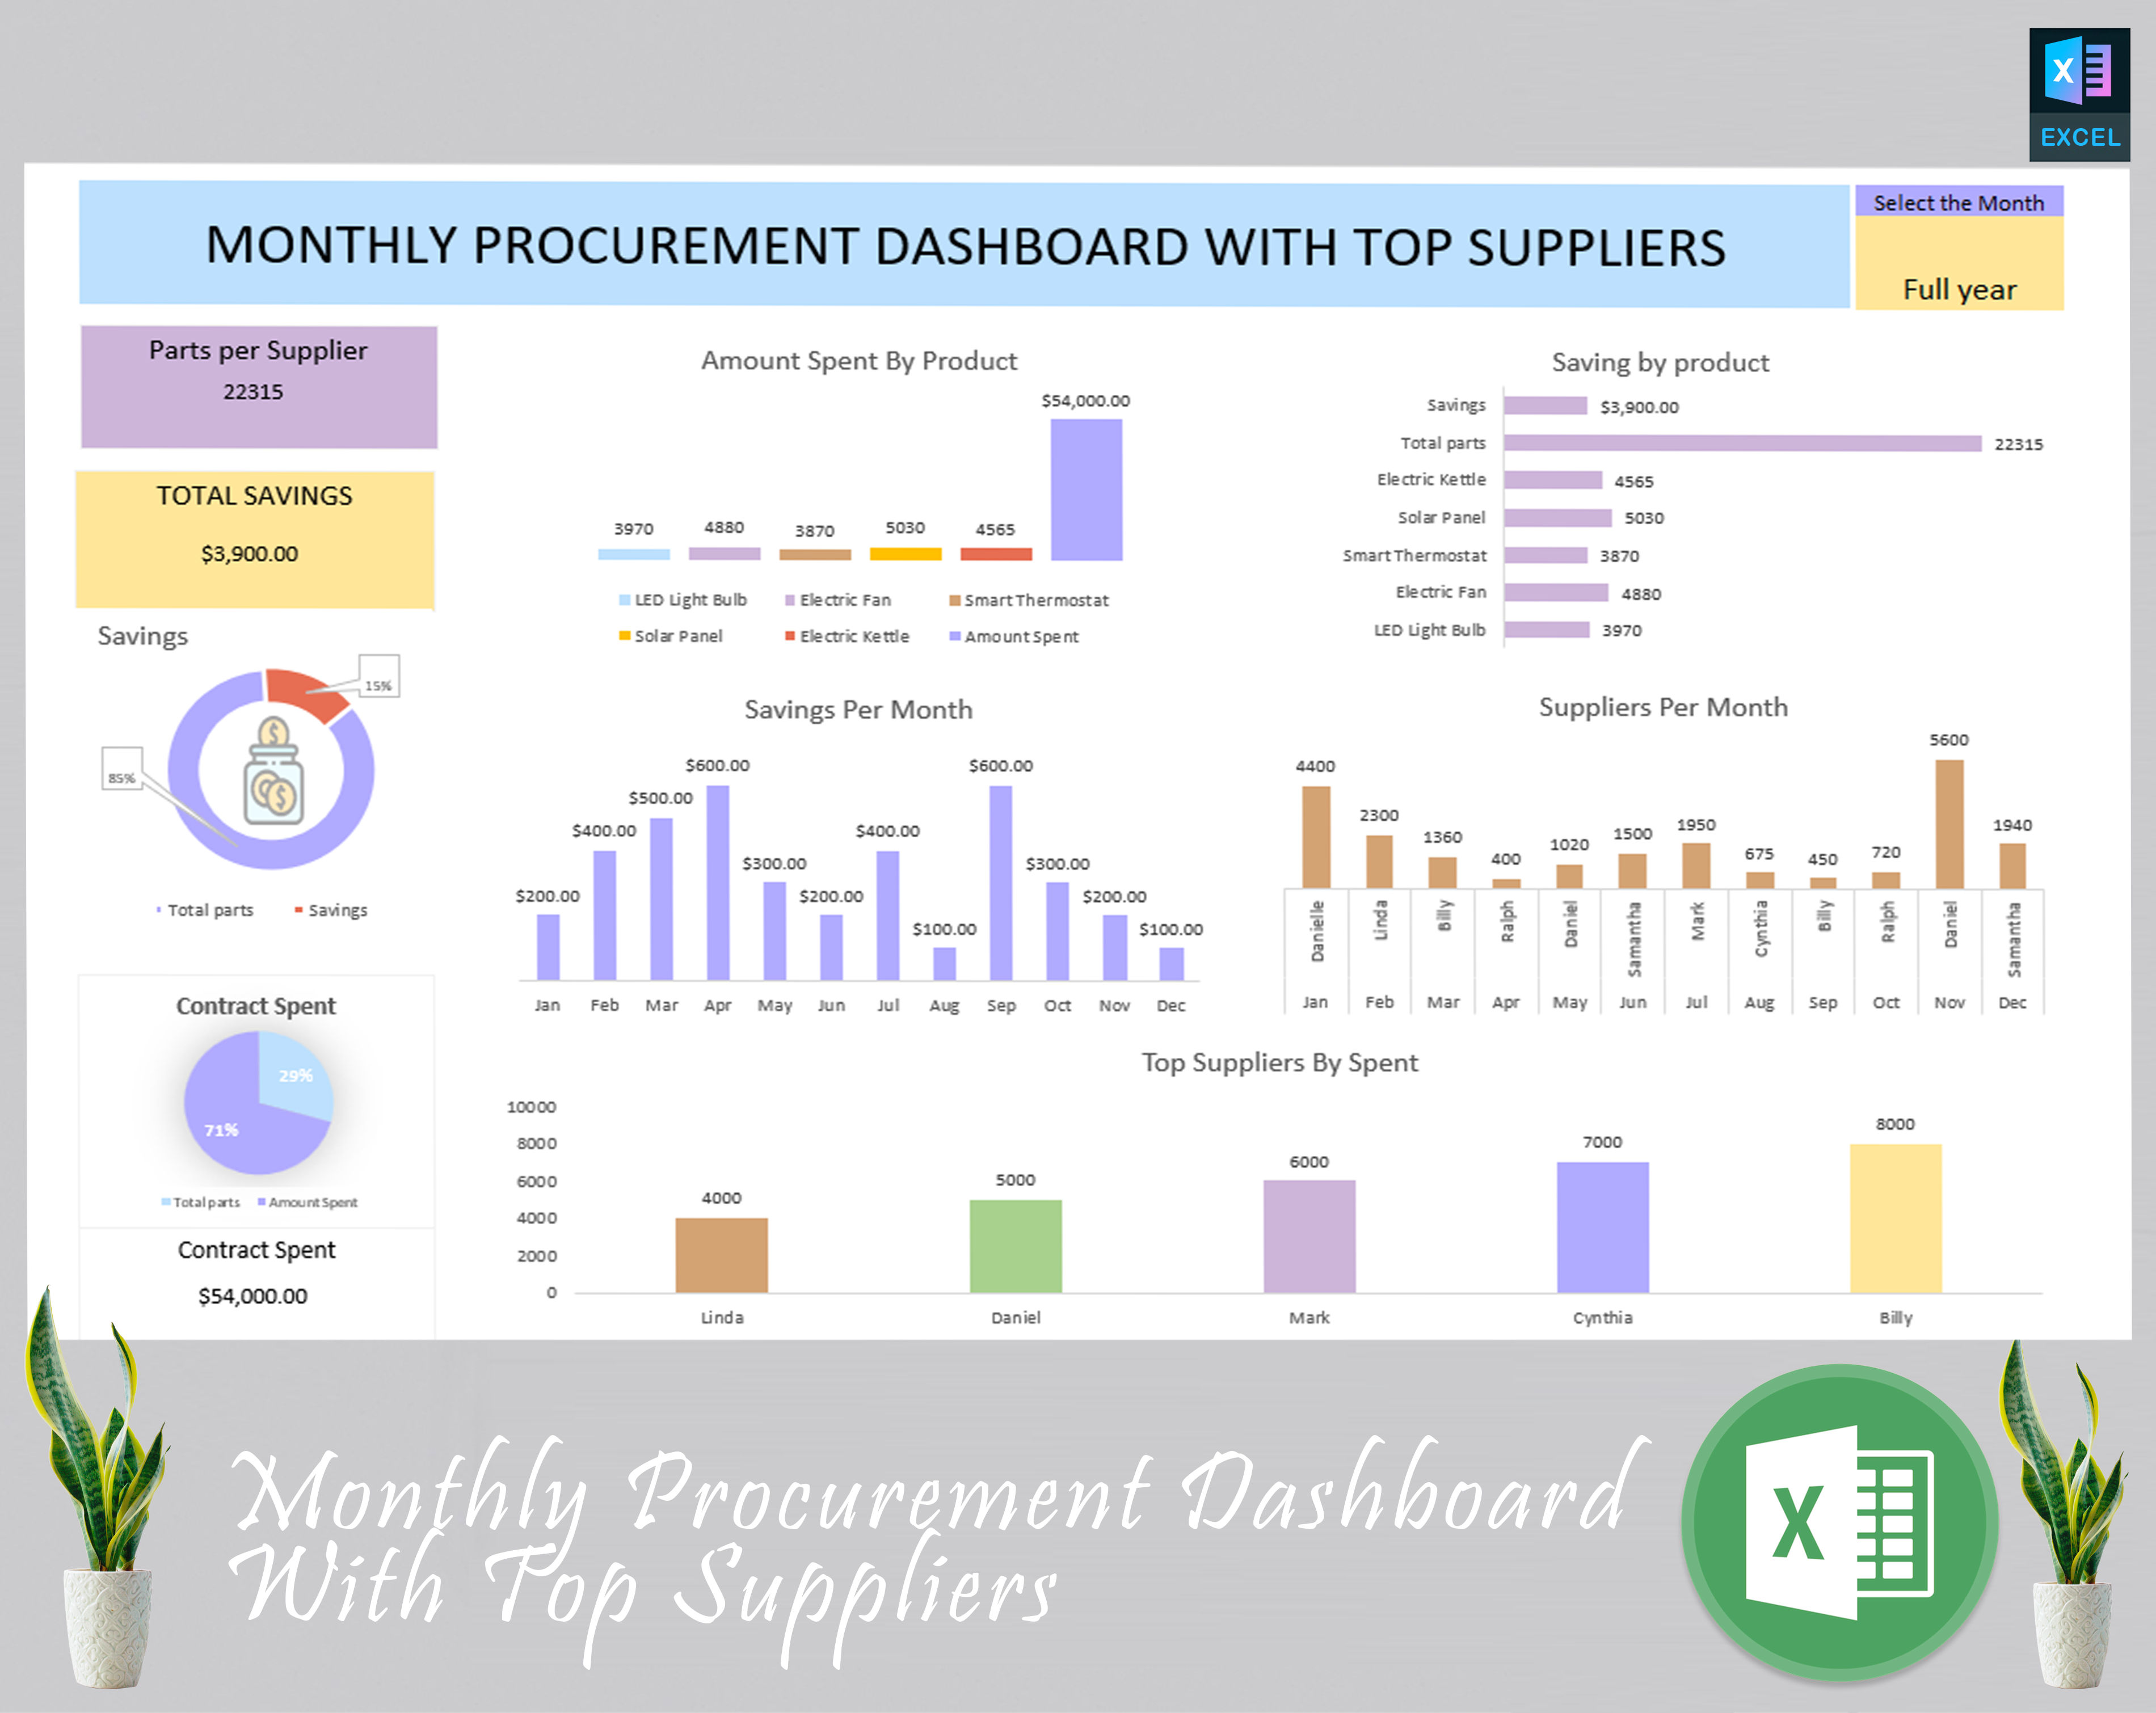
Schedule a monthly data validation routine. Use Excel’s Remove Duplicates feature, cross‑check supplier master lists, and reconcile any mismatched totals with the finance department. Clean data is the lifeblood of accurate analysis.
Iterate the Category Tree
Business needs evolve; your category hierarchy should too. Conduct quarterly reviews with stakeholders to add emerging spend categories—think “Sustainability Services” or “Cloud Subscription Fees”—and adjust the mapping rules accordingly.
Embed Governance Controls
Assign ownership for each sheet: “RawData” belongs to Finance, “Categories” to Procurement, and “Dashboard” to Senior Management. Document change‑log procedures and require sign‑off before any structural modifications are made.
Leverage Benchmarks
Compare your spend ratios against industry benchmarks published by consulting firms or trade associations. Highlight gaps in a dedicated “Gap Analysis” section of the dashboard, turning raw numbers into strategic narratives.
Train the Team
Even the most sophisticated template is useless if the team cannot interpret it. Conduct hands‑on workshops that walk analysts through pivot manipulation, slicer usage, and KPI interpretation. Knowledge diffusion ensures the tool scales with the organization.
Conclusion
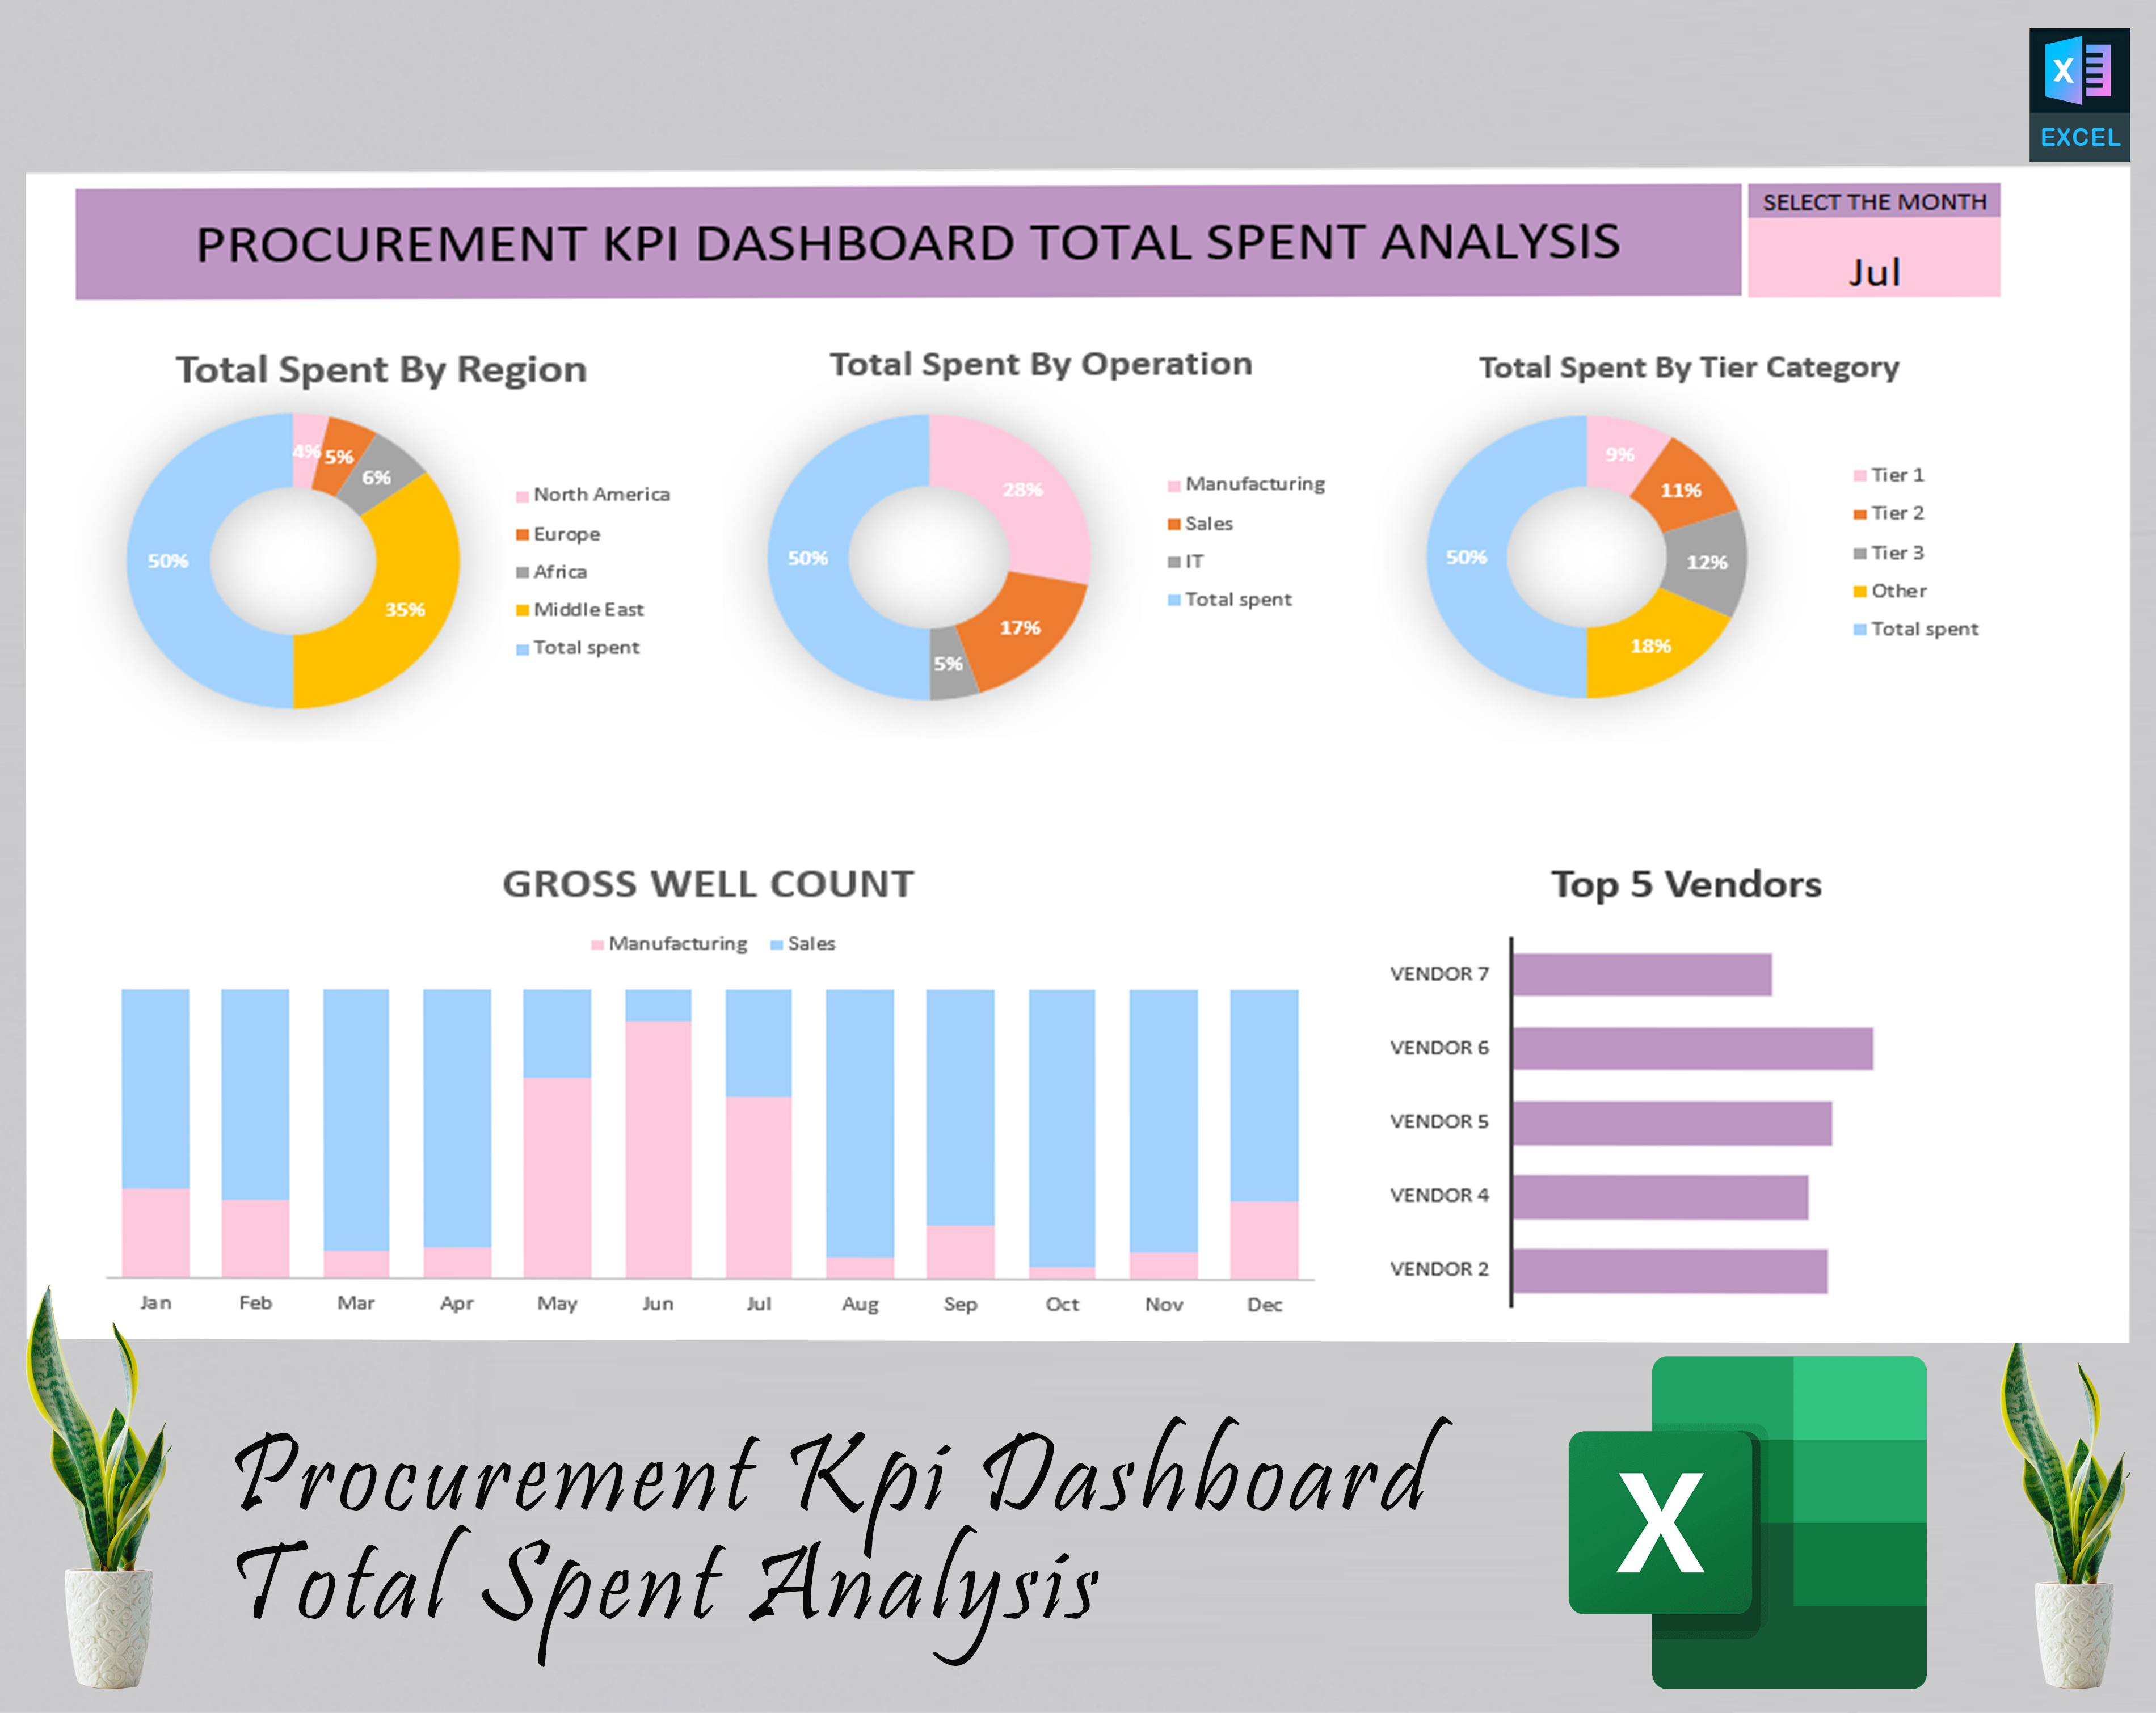
The Procurement Spend Analysis Template Excel is far more than a spreadsheet; it is a strategic instrument that converts chaotic transactional noise into a clear, actionable portrait of an organization’s financial health. By meticulously structuring data, enforcing rigorous categorization, and layering advanced analytics—augmented by Power Query, macros, and optional Power BI integration—procurement teams can unearth hidden savings, mitigate risk, and wield data as a competitive weapon. When maintained with disciplined governance, continuous improvement, and cross‑functional training, this template becomes a living asset that drives cost discipline, supplier accountability, and strategic agility for years to come.