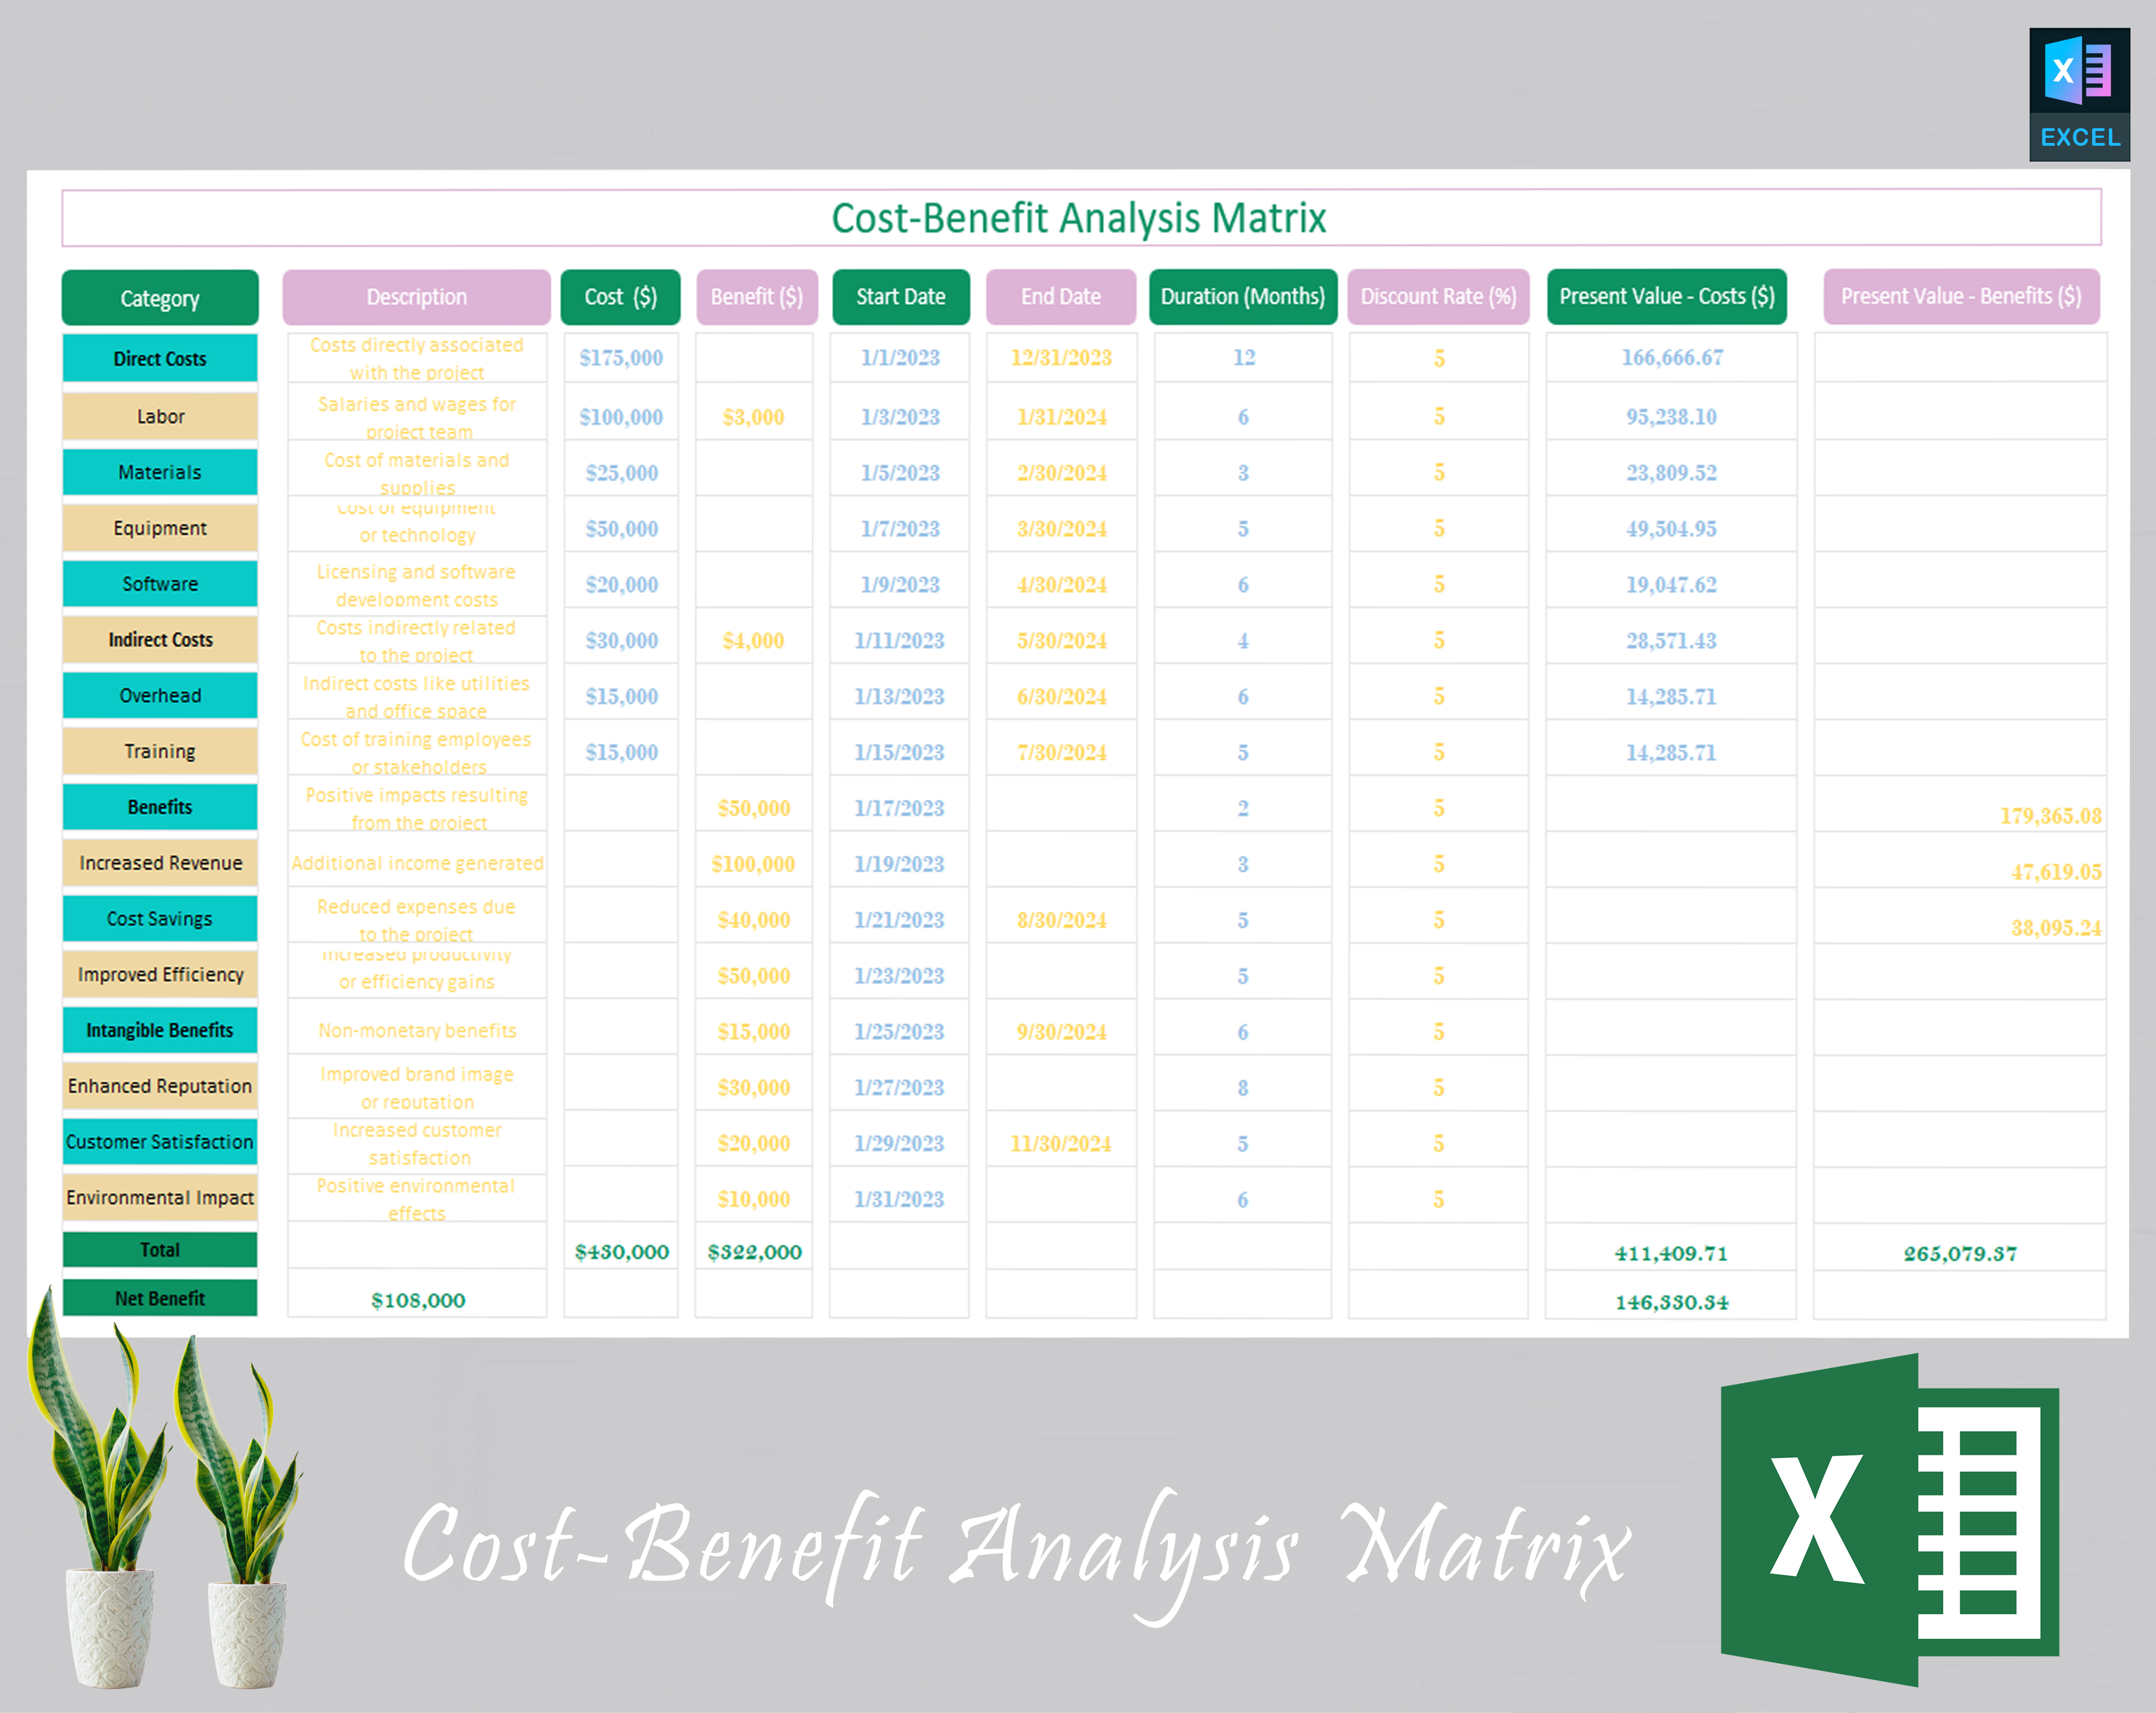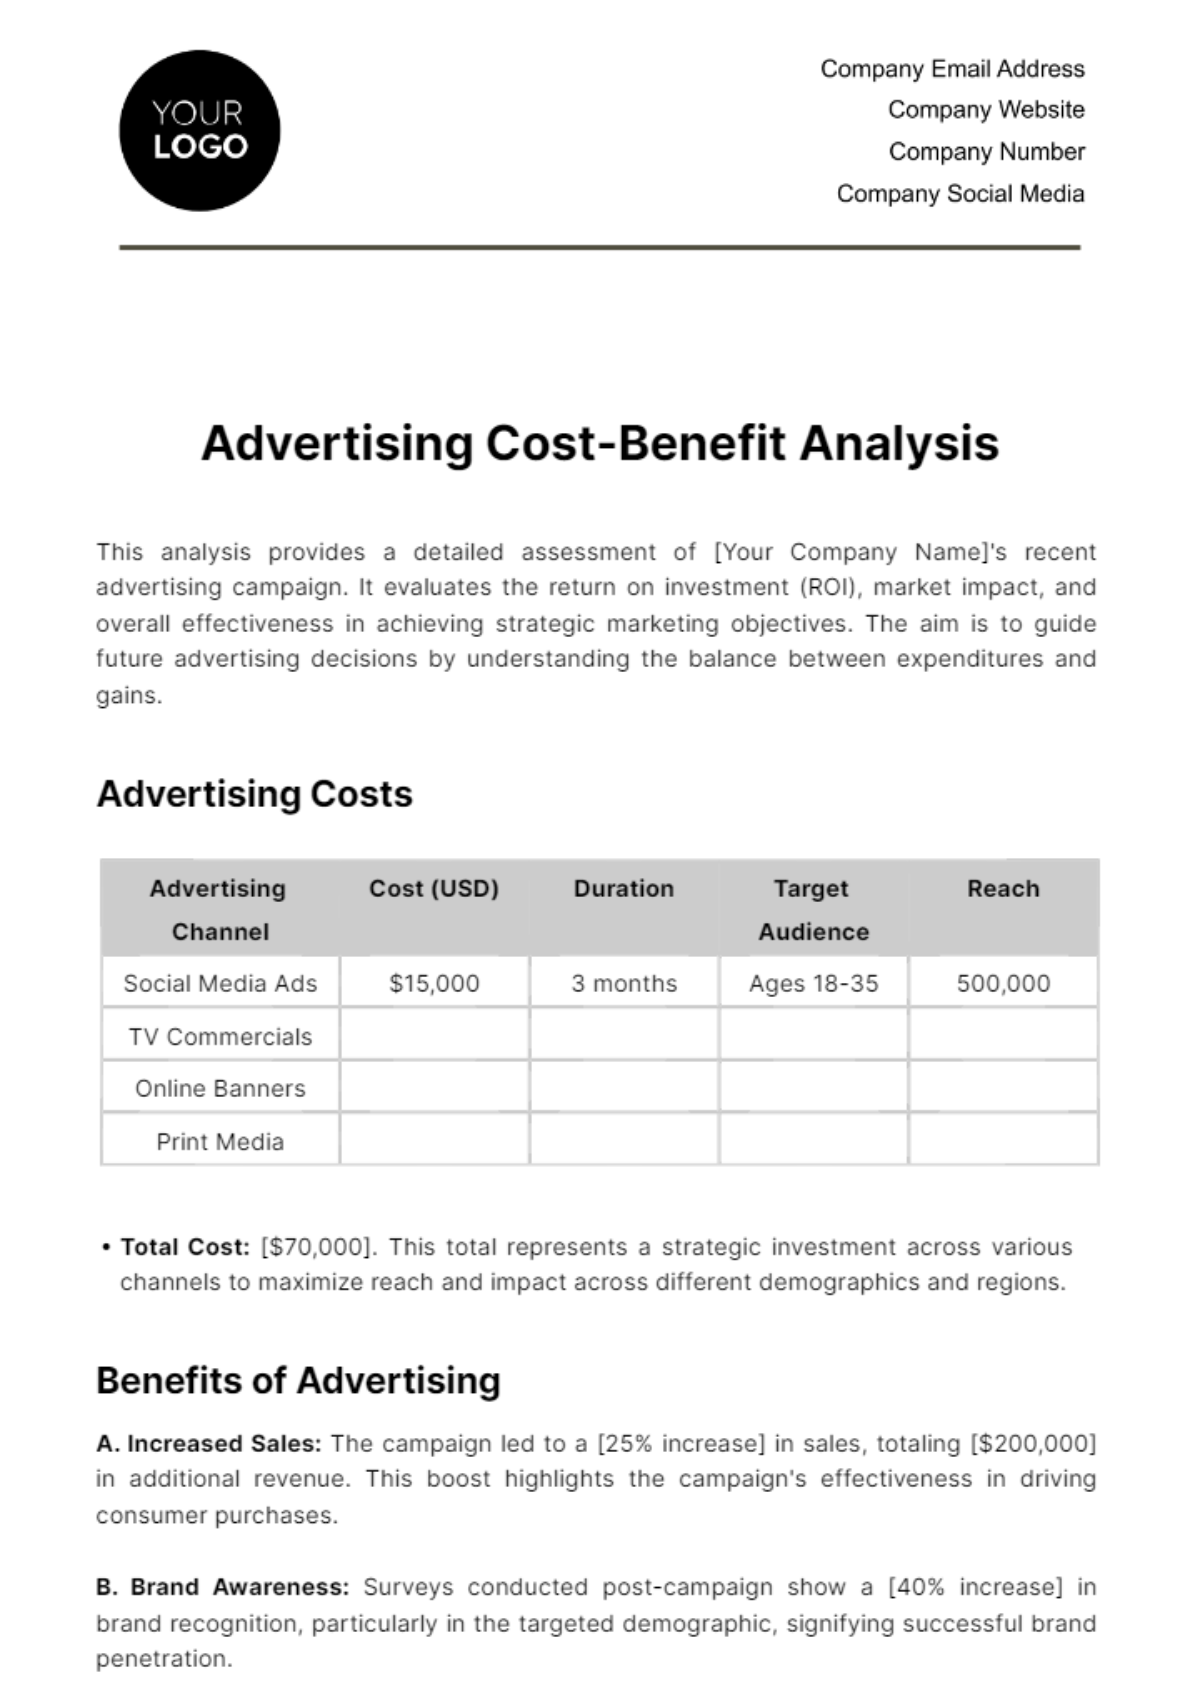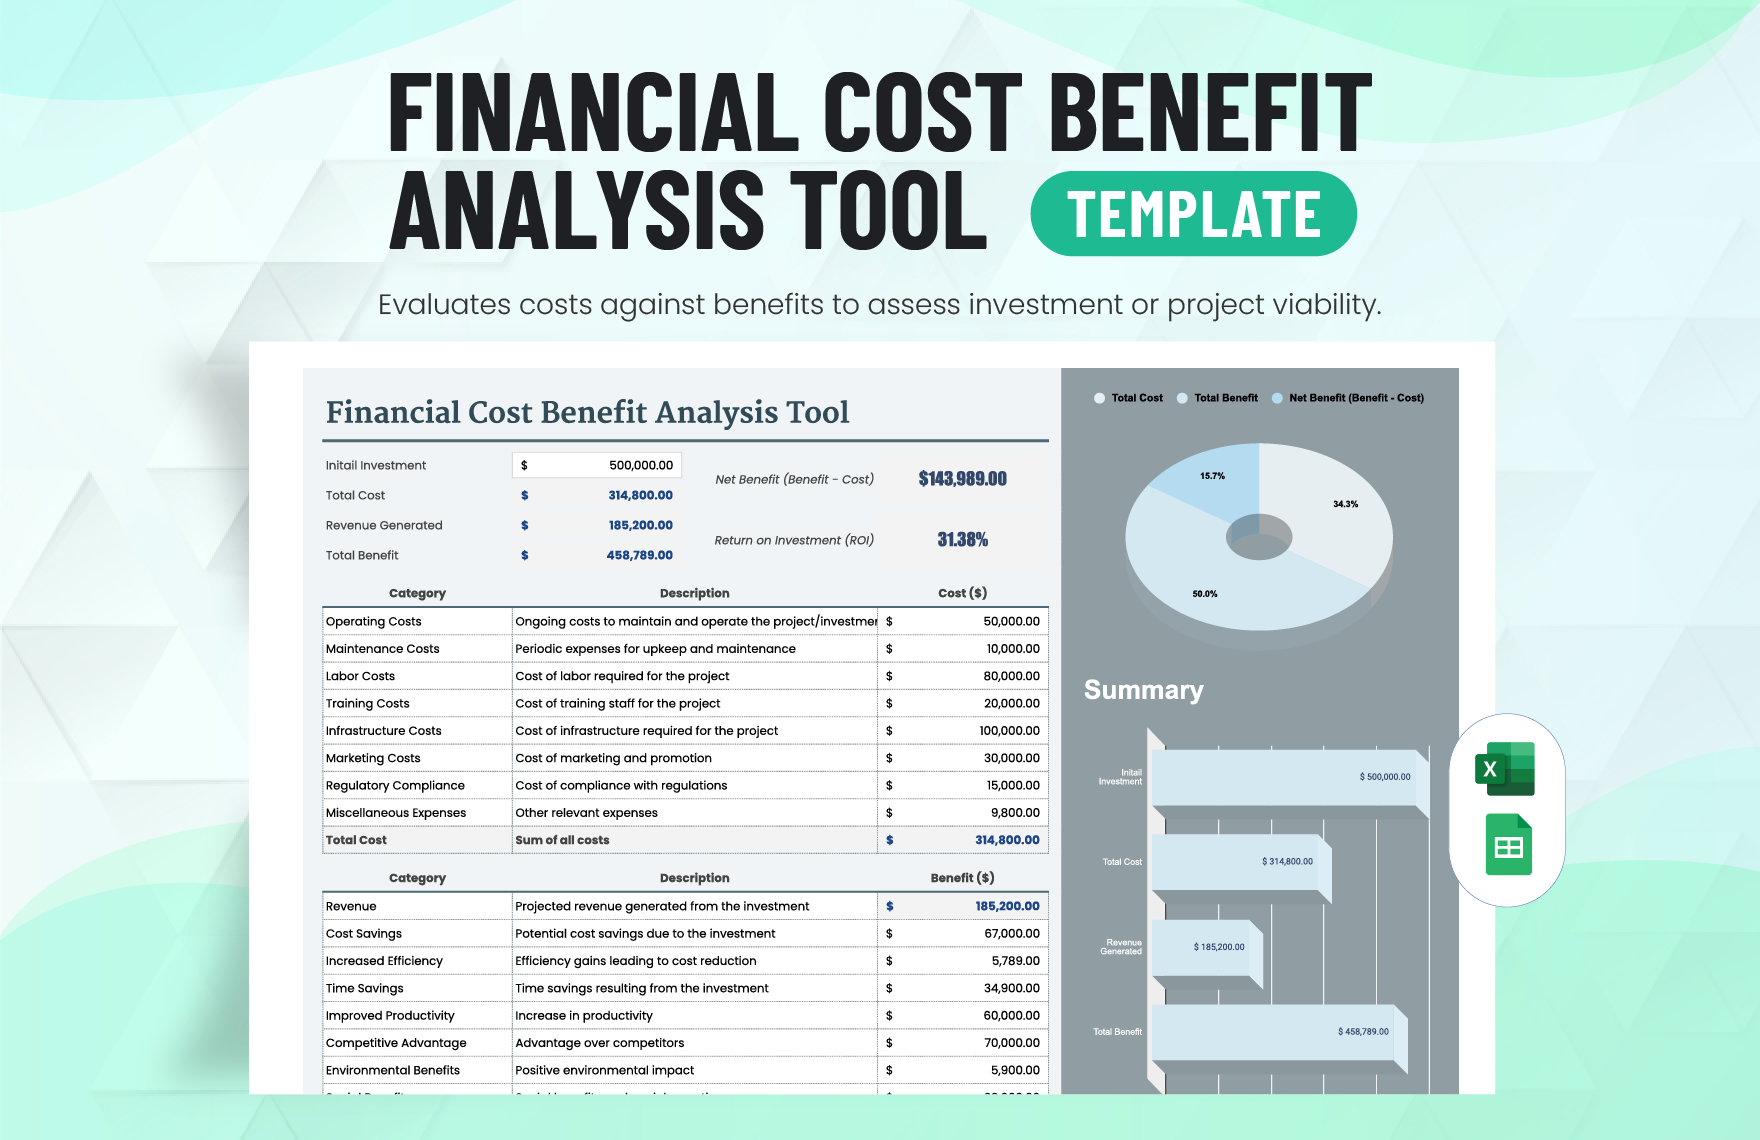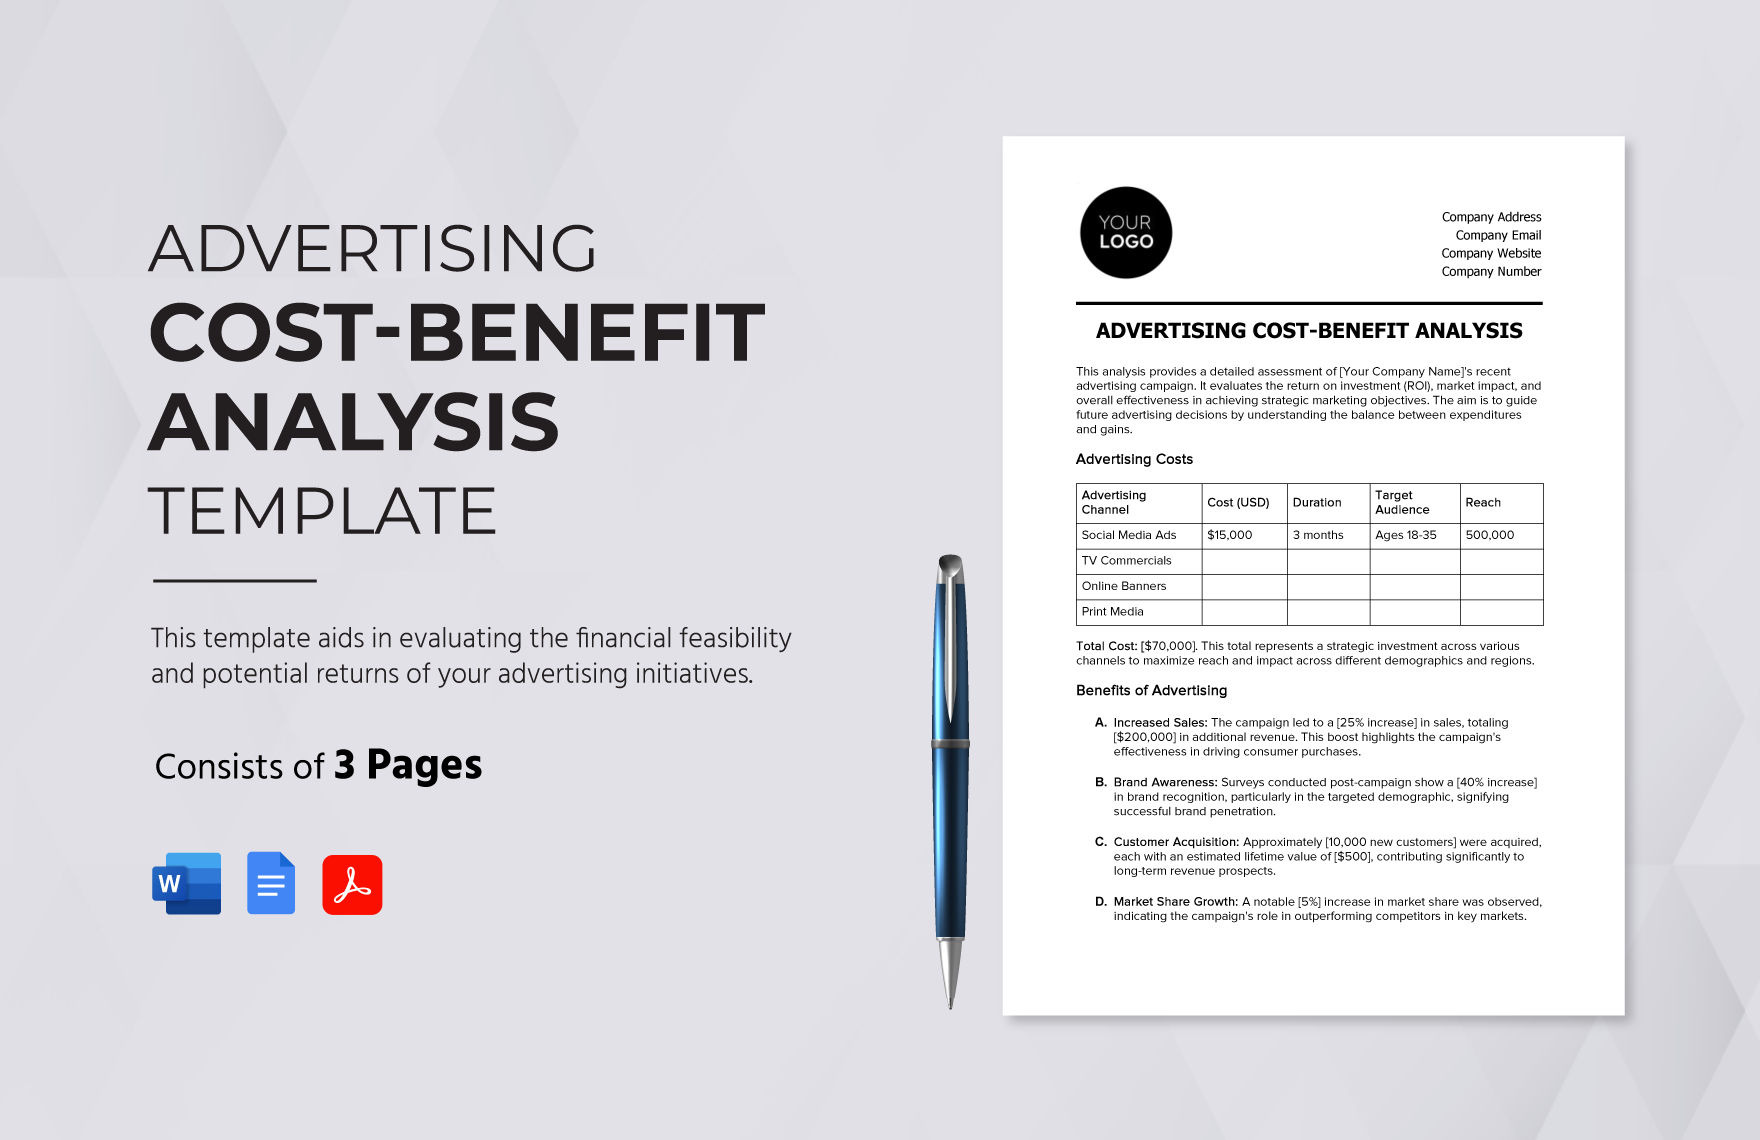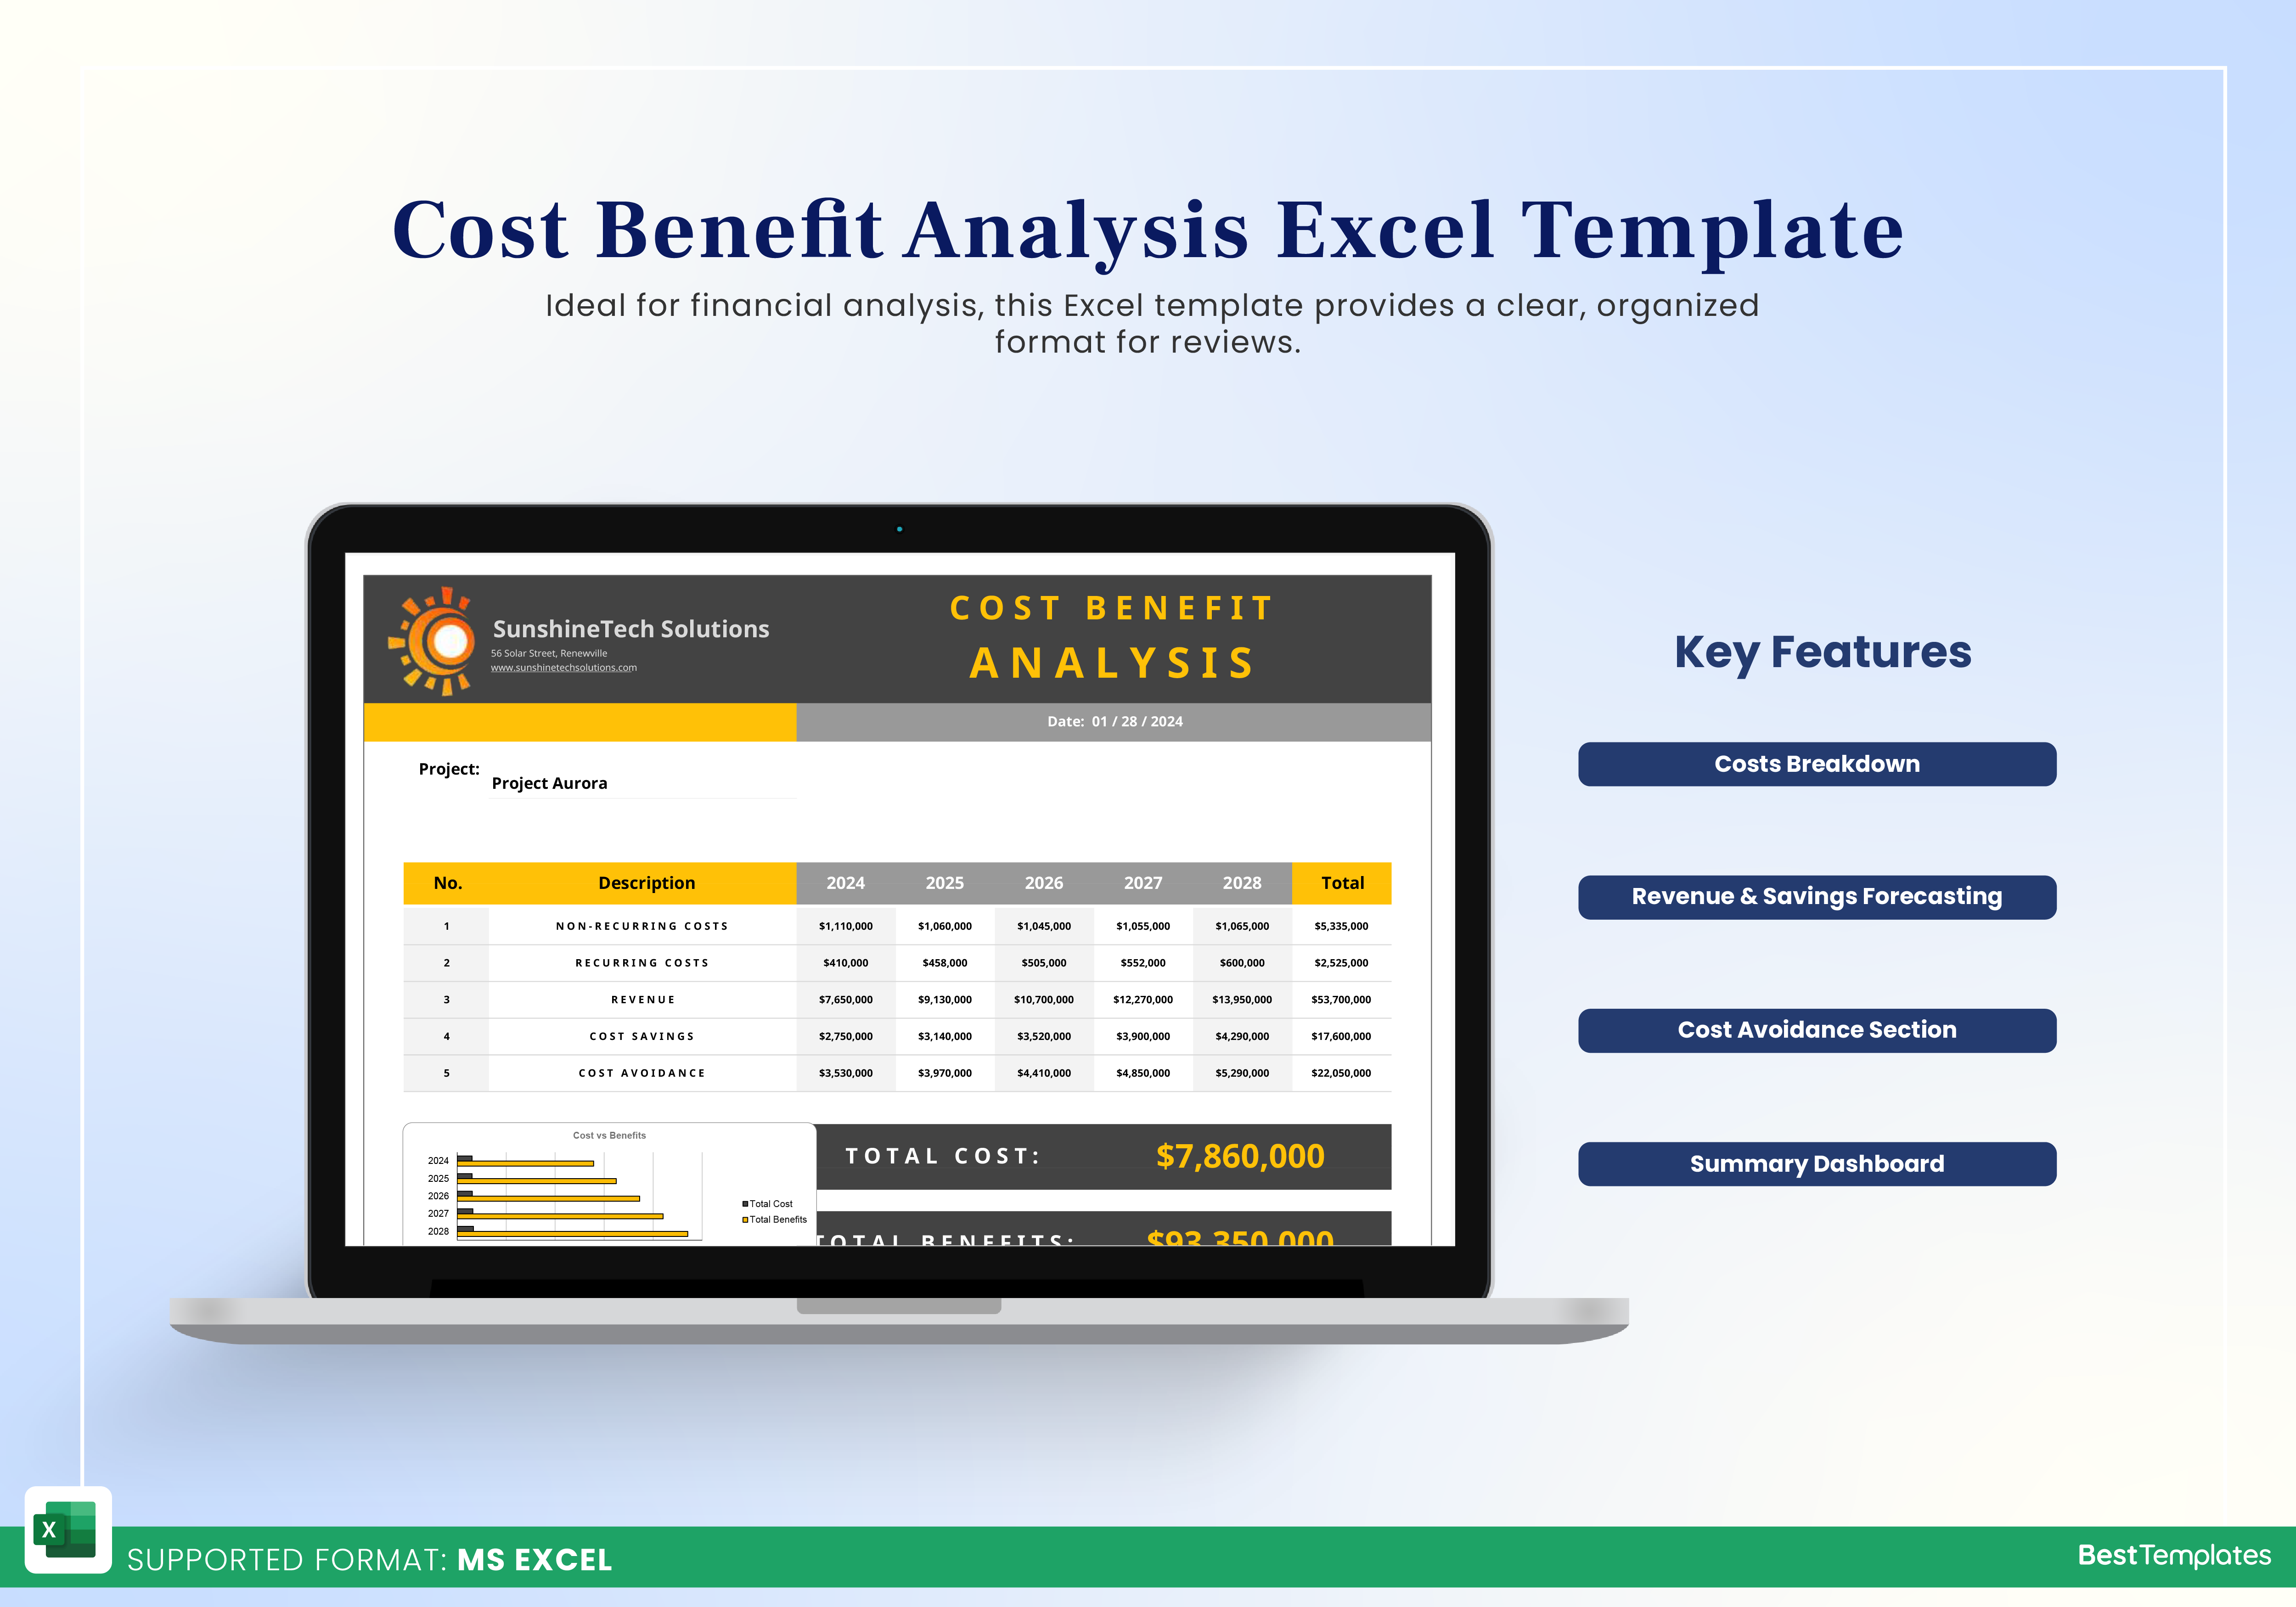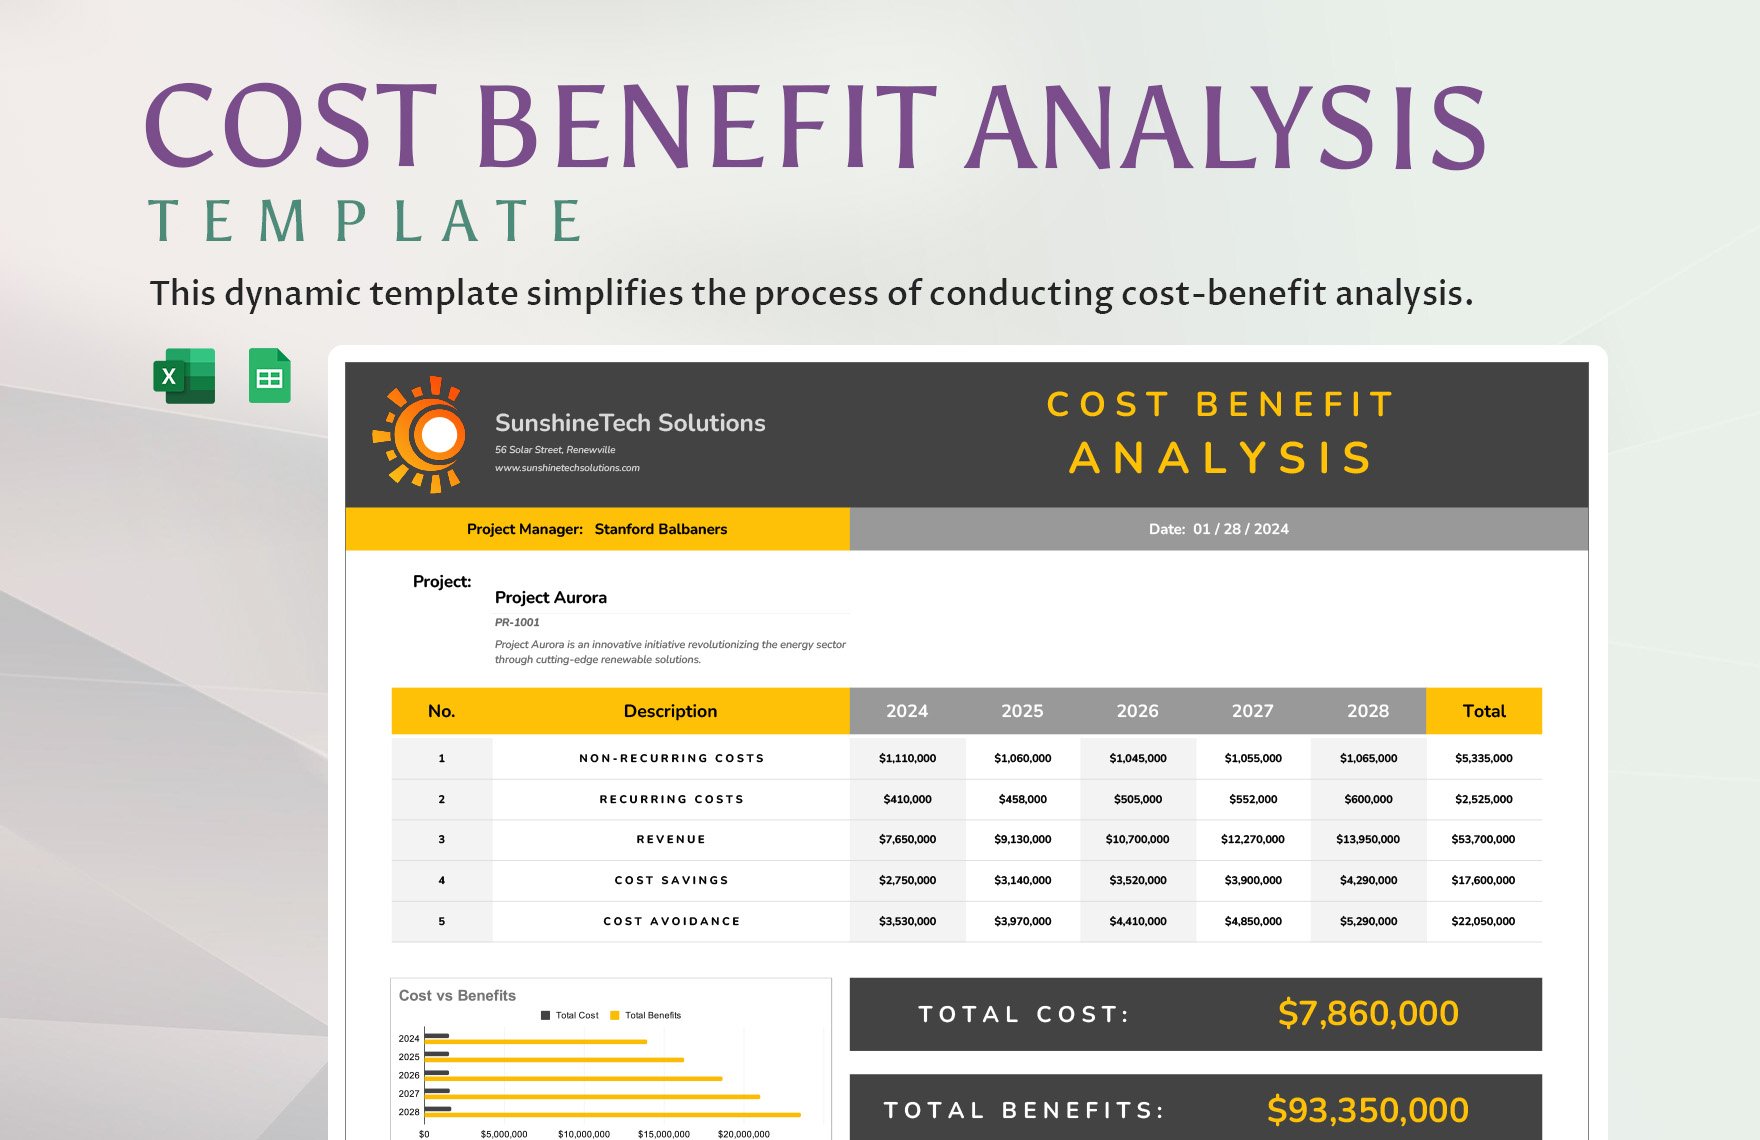
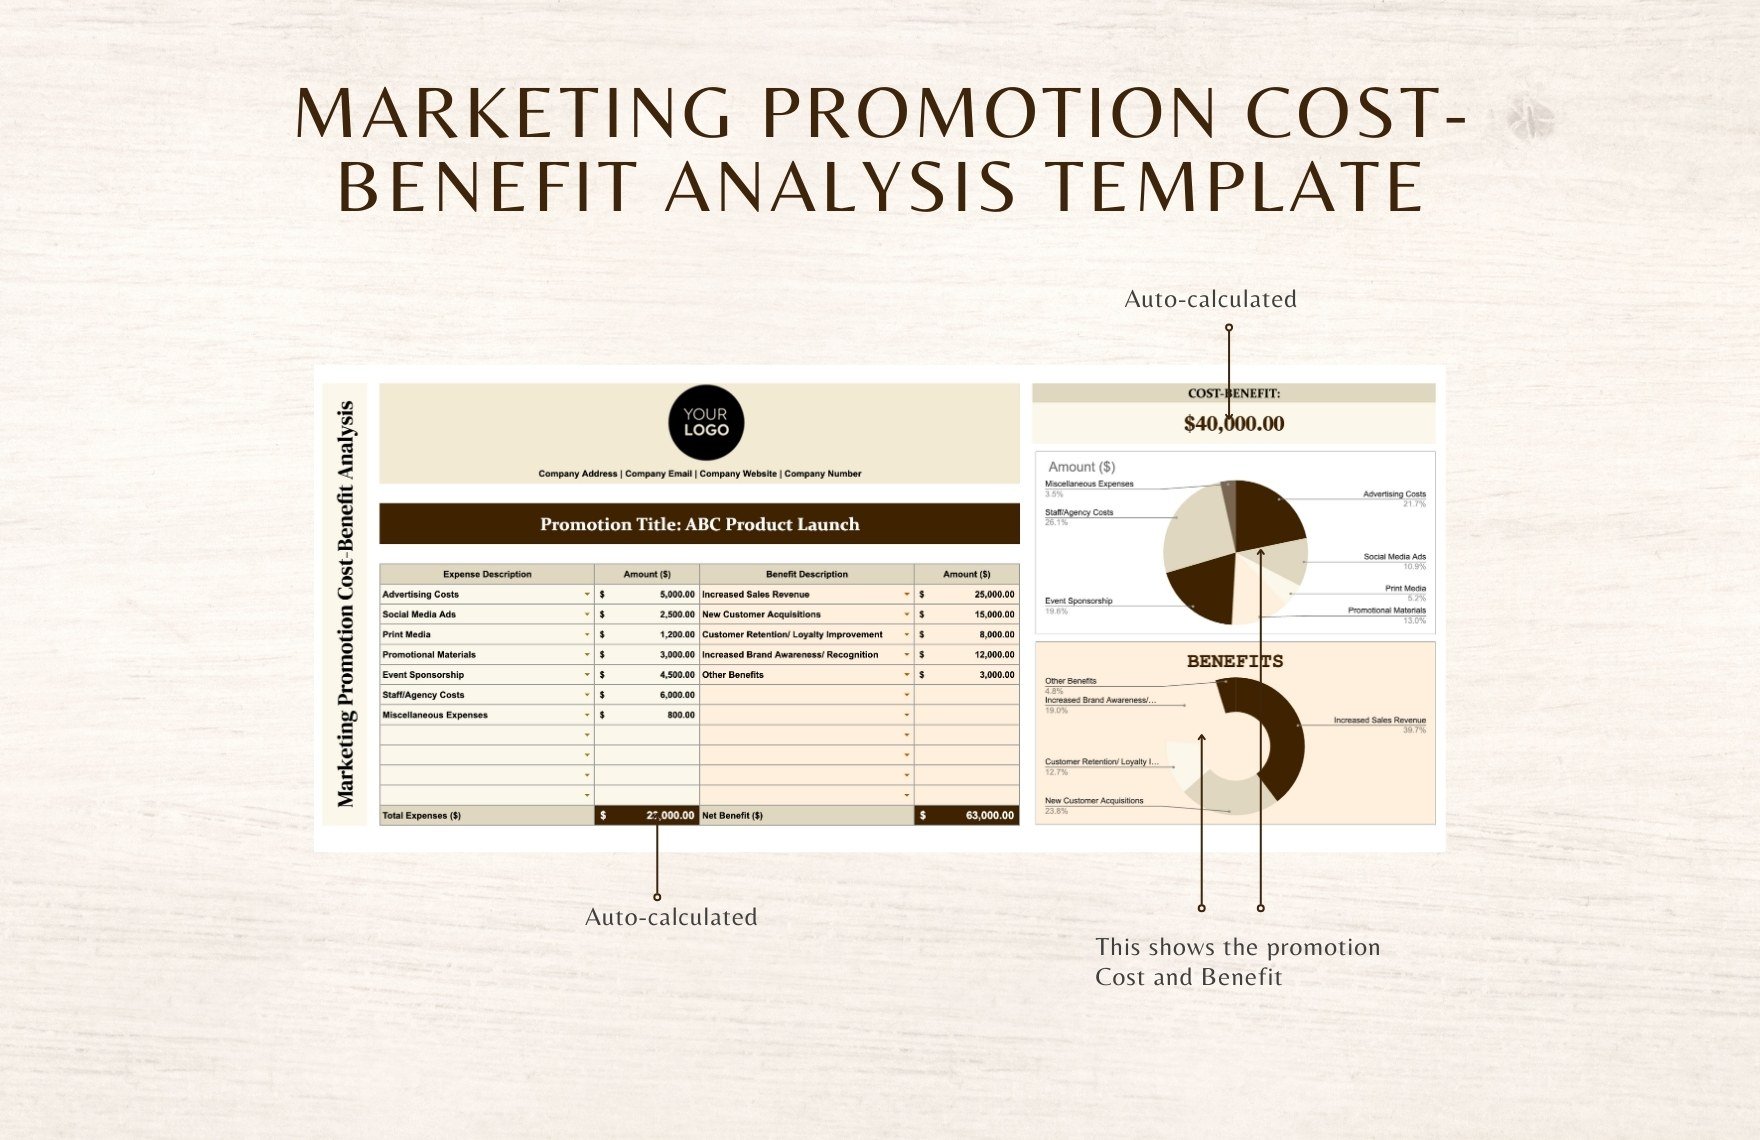
Marketing Cost Benefit Analysis Template is the indispensable tool that every modern marketer needs to quantify the true value of promotional activities, align spending with strategic goals, and persuade stakeholders with hard data rather than gut feelings. Whether you’re a small agency launching a new campaign or a Fortune 500 brand allocating multimillion dollar budgets, a well‑structured template turns raw numbers into actionable insights, guarantees consistency across projects, and ultimately drives smarter decision making.
Understanding the Core of Cost‑Benefit Analysis
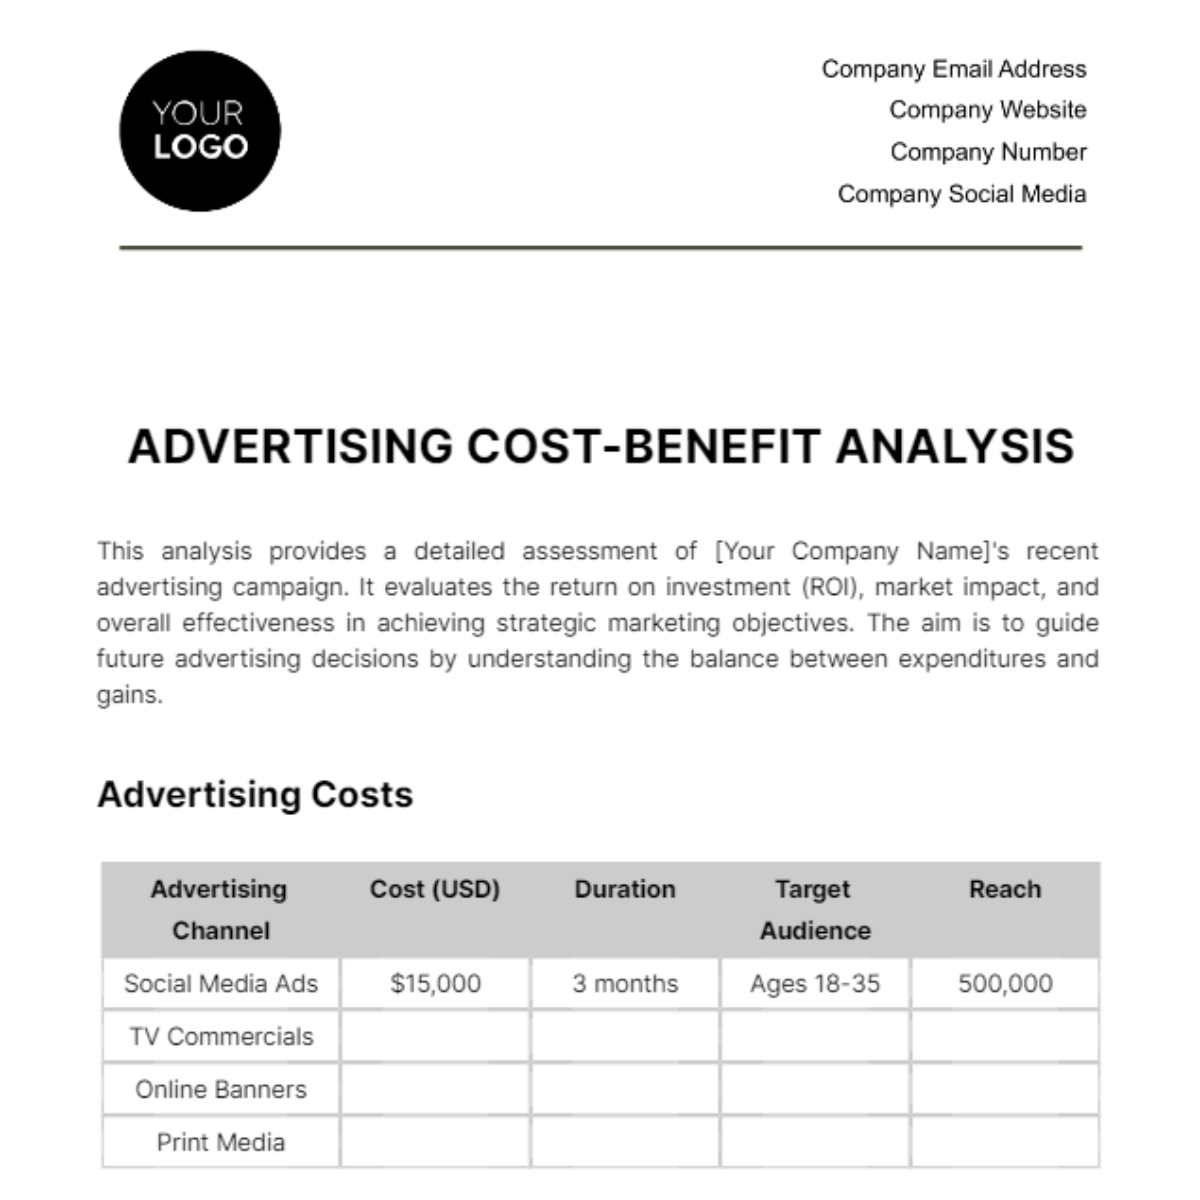
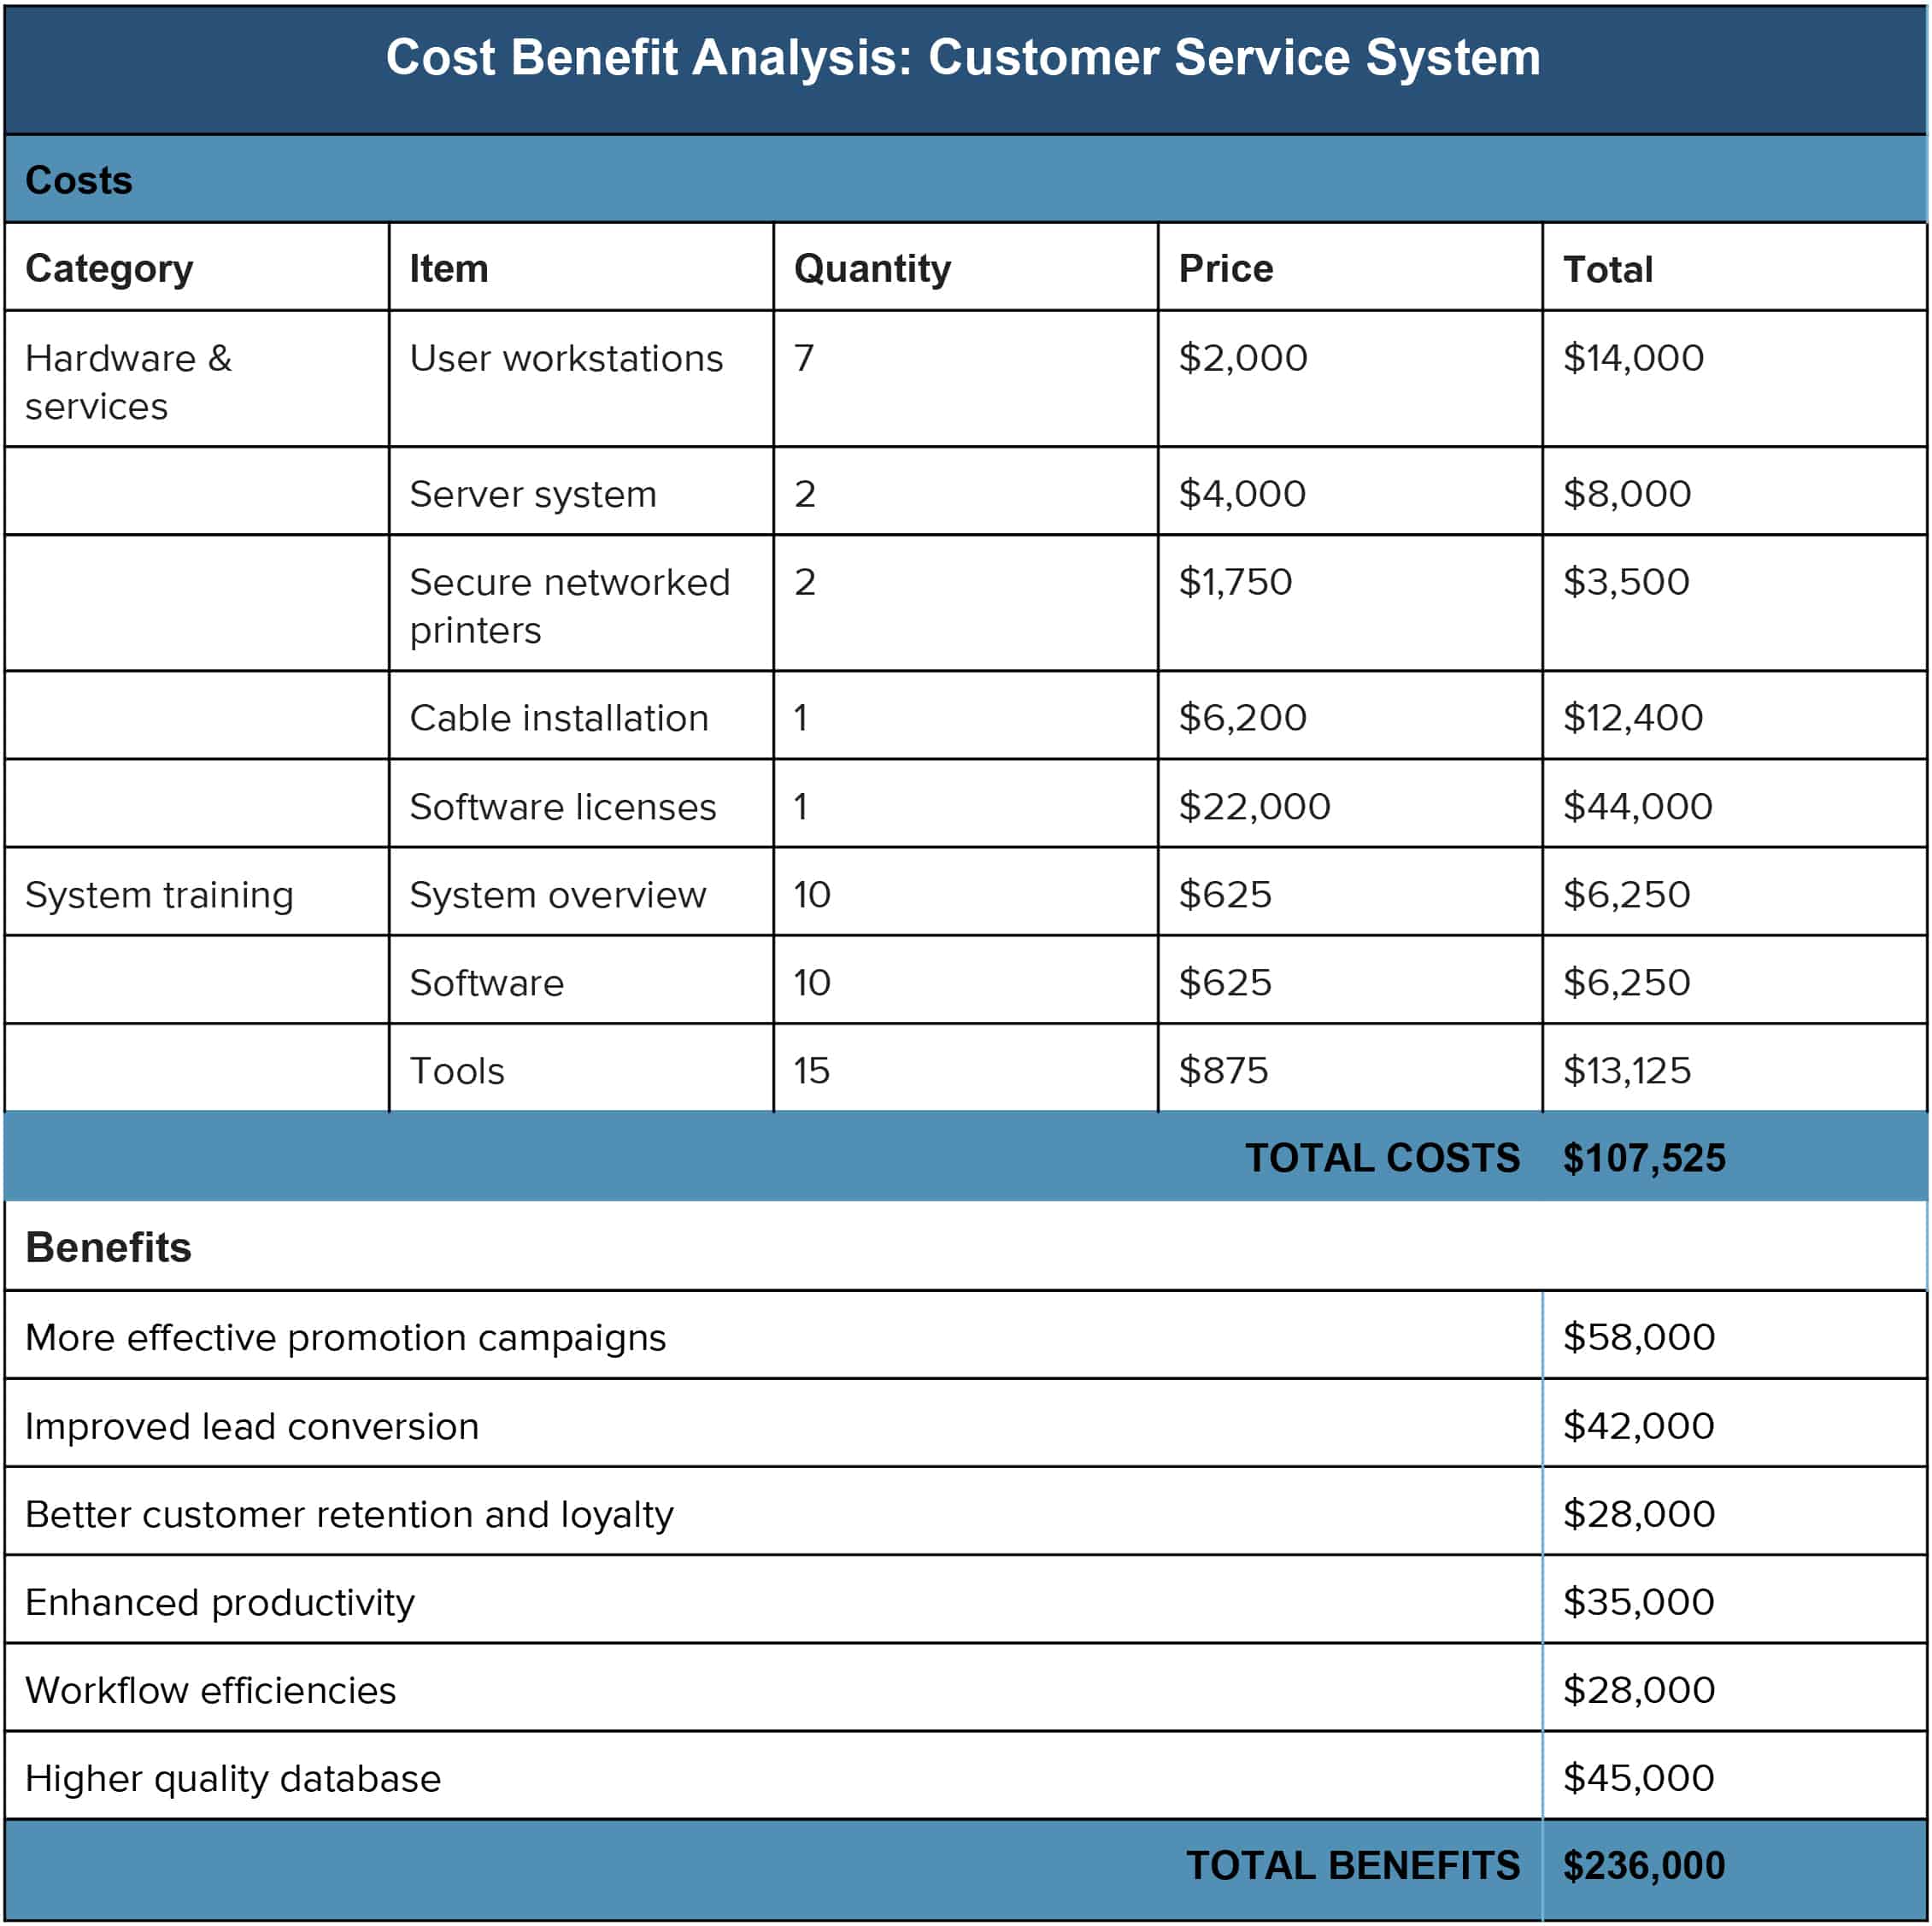
A cost‑benefit analysis (CBA) in marketing is more than a spreadsheet; it’s a framework that balances every dollar spent against every benefit gained. In practice, the template captures:
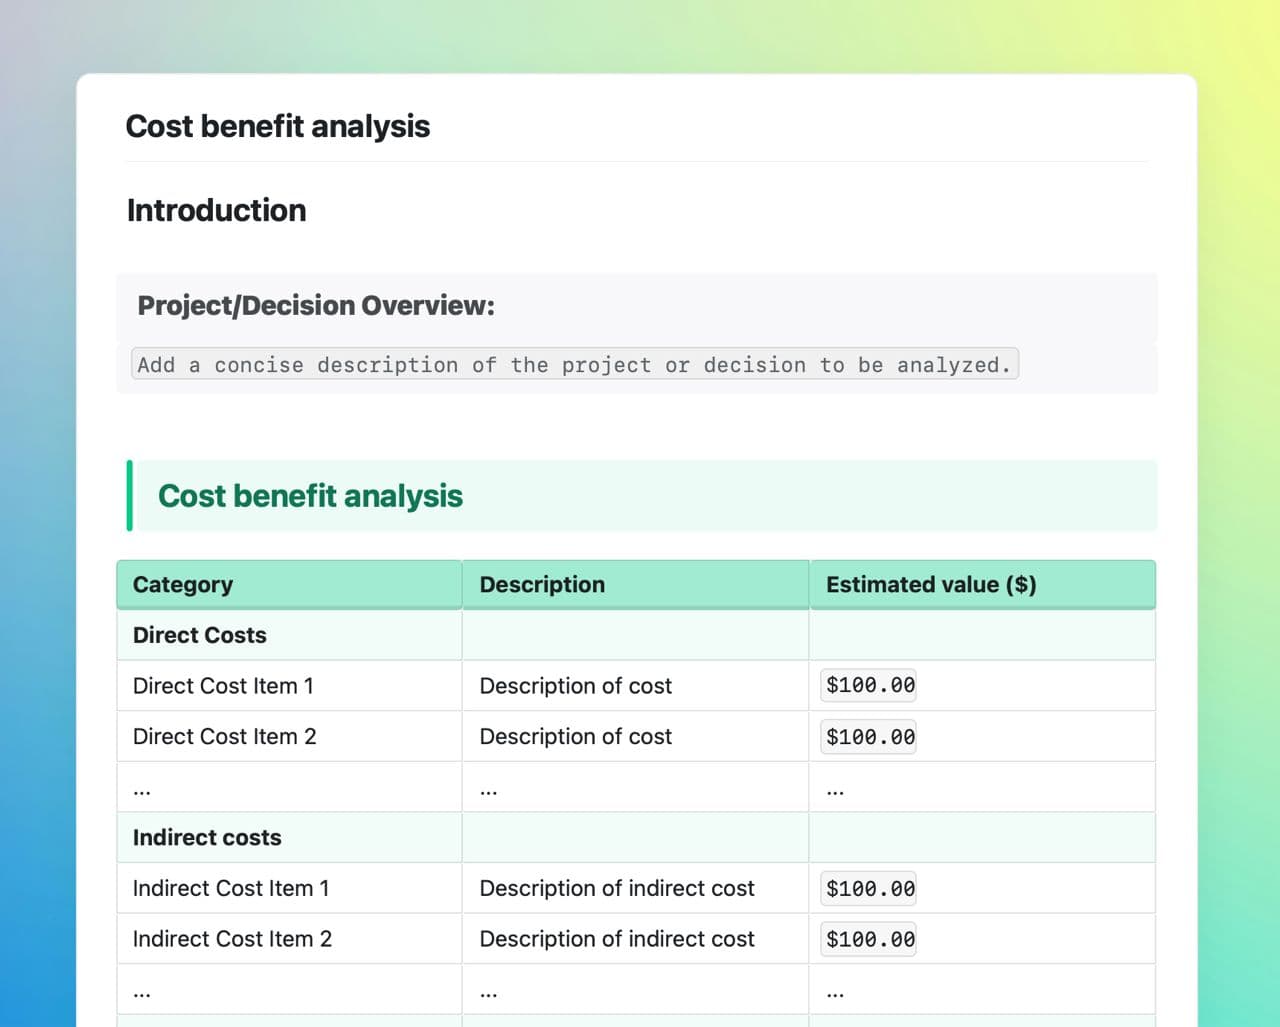
- Direct costs – creative production, media spend, technology fees, and labor.
- Indirect costs – overhead, opportunity cost of time, and cross‑functional resources.
- Quantifiable benefits – incremental sales, qualified leads, brand lift metrics, and customer lifetime value.
- Non‑quantitative benefits – market positioning, stakeholder confidence, and compliance assurance.
By quantifying these elements, the template delivers a clear, data‑driven narrative that demonstrates how each marketing initiative translates into business outcomes.
Why a Dedicated Template Beats Manual Calculations
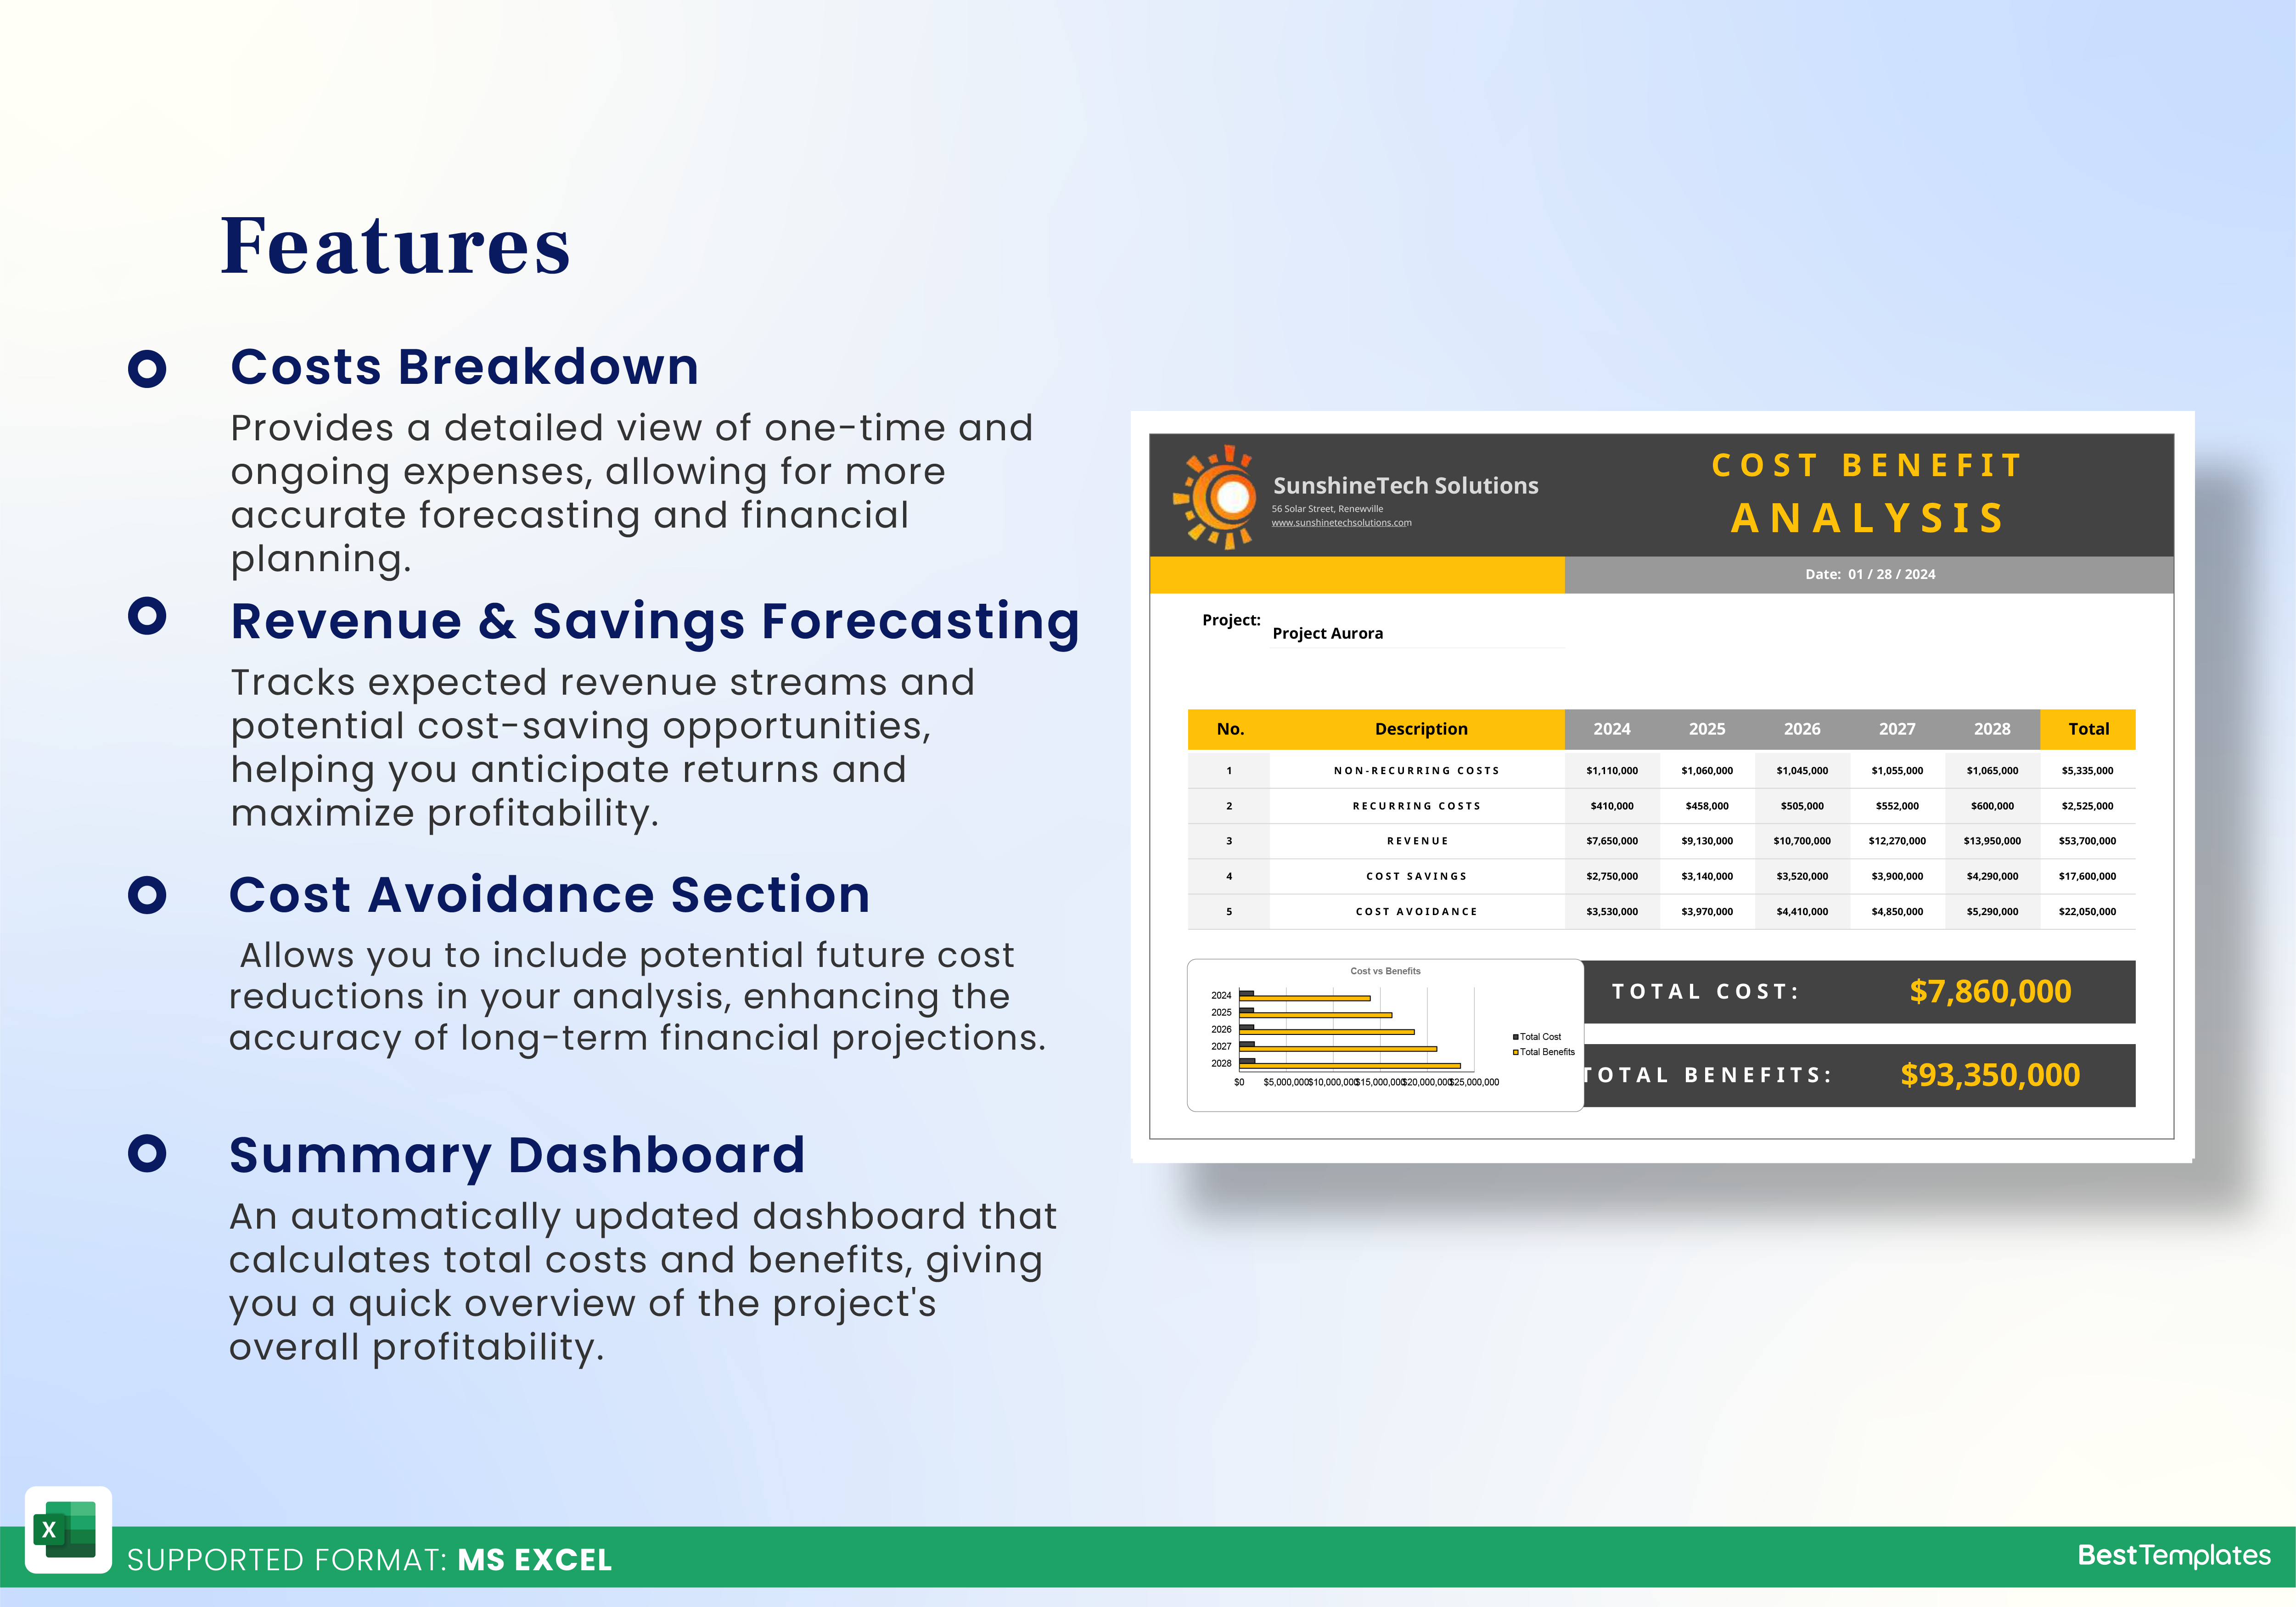
Hand‑typing cost and benefit figures can lead to errors, inconsistent assumptions, and difficulty in comparing campaigns. A dedicated template offers:
- Standardized assumptions – e.g., average conversion rate or cost per click, which can be easily updated.
- Version control – every change is tracked, ensuring that revisions don’t corrupt historical data.
- Quick scenario analysis – swapping numbers for “best case,” “worst case,” and “most likely” automatically recalculates ROI.
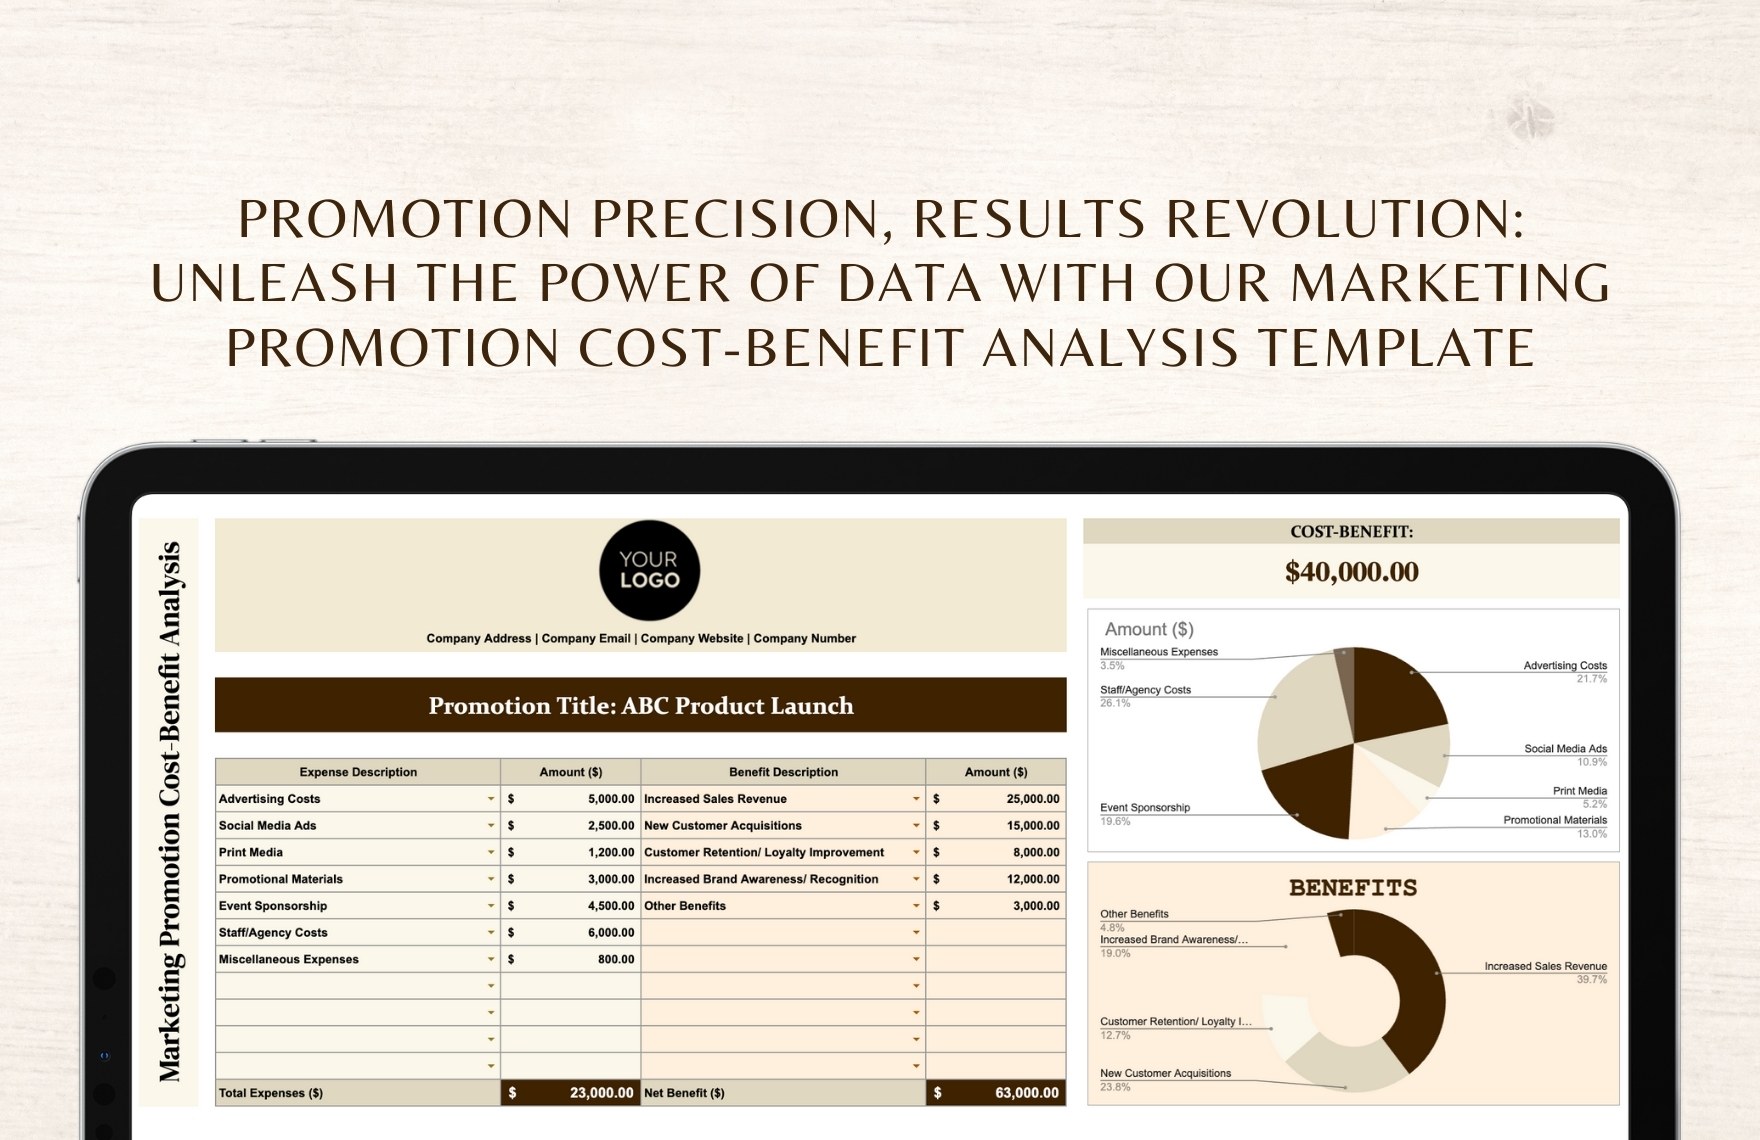
- Visual dashboards – charts that instantly display cost‑to‑benefit ratios, making presentations more persuasive.
In short, a template eliminates guesswork and makes your marketing economics transparent and repeatable.
Step‑by‑Step Guide to Building Your Own Template

1. Define Your Objectives
Start with a clear question: “What do we want to achieve?” For a product launch, the goal may be to generate $500,000 in incremental revenue. For a brand awareness drive, the goal could be a 15% lift in sentiment scores. Your template should capture the specific metric that matters most to the initiative.
2. Gather Historical Data
Pull past campaign reports, CRM data, and market research to establish realistic cost and benefit benchmarks. This data provides the baseline for assumptions such as customer acquisition cost (CAC), average order value (AOV), and conversion rates.
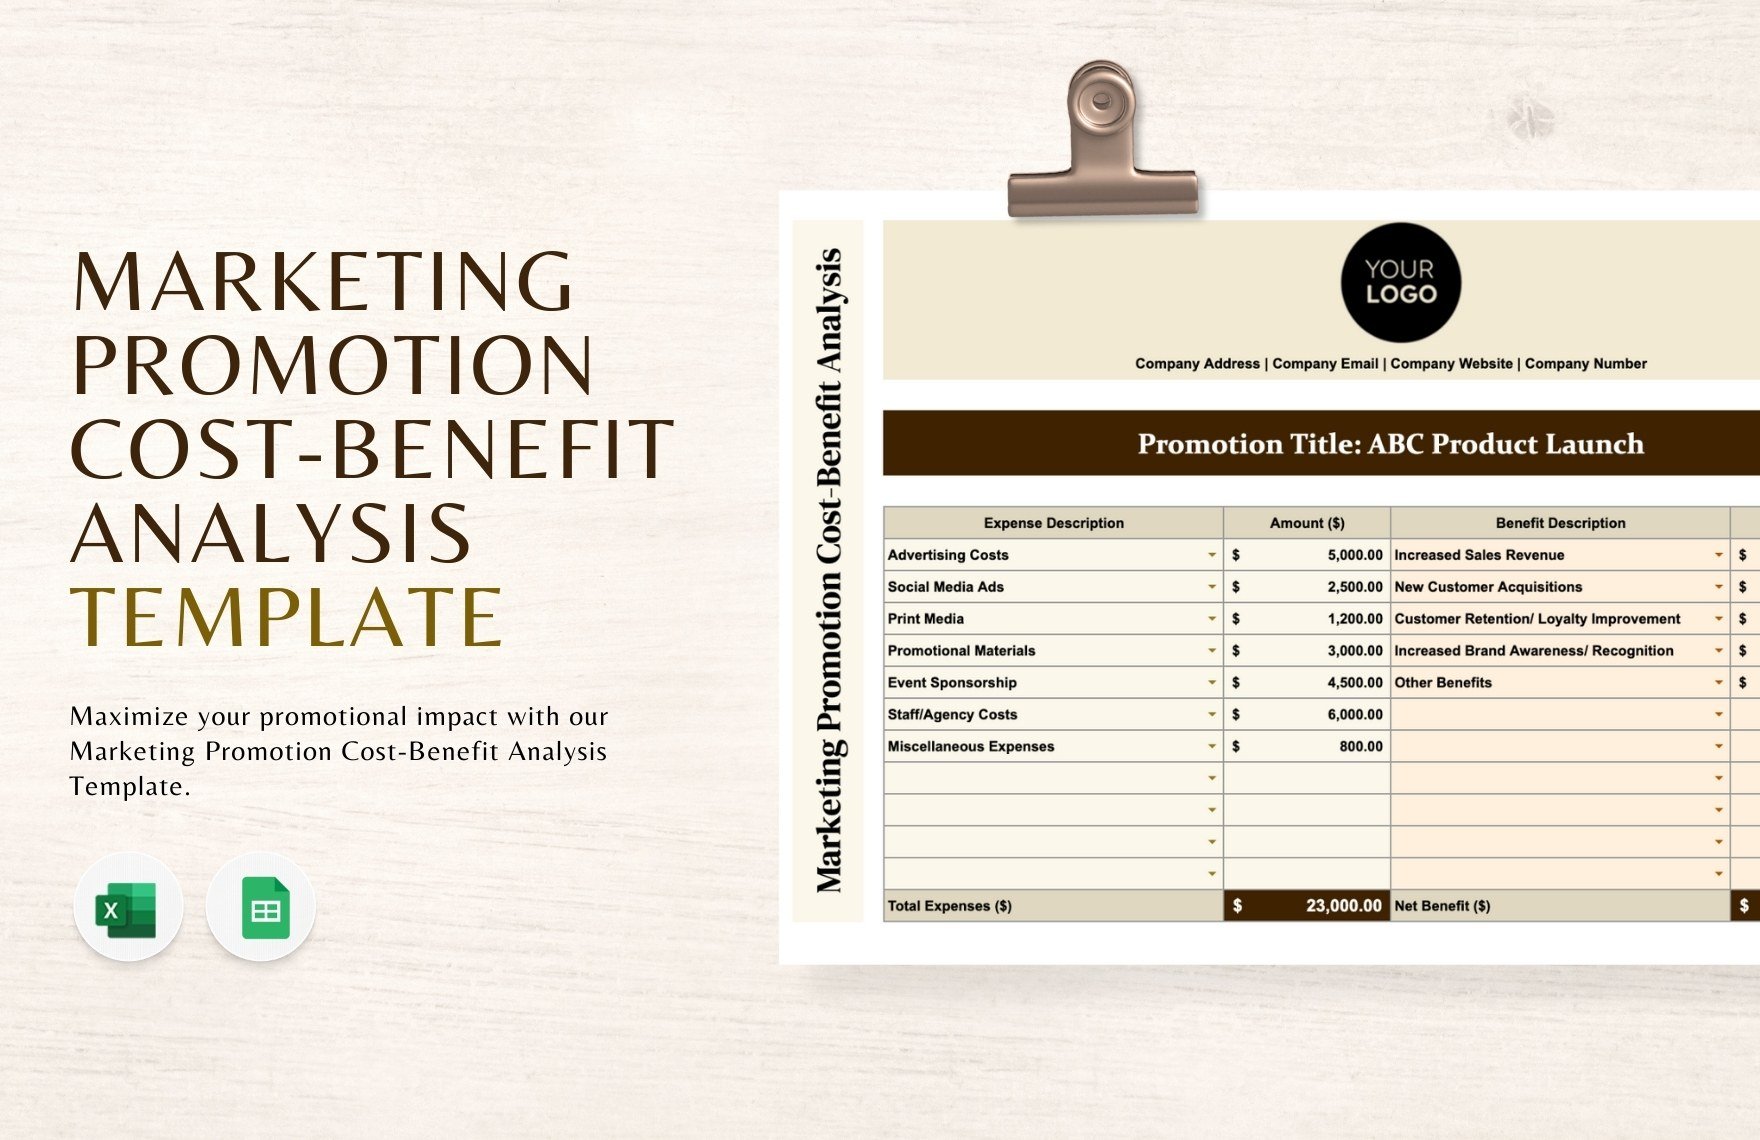
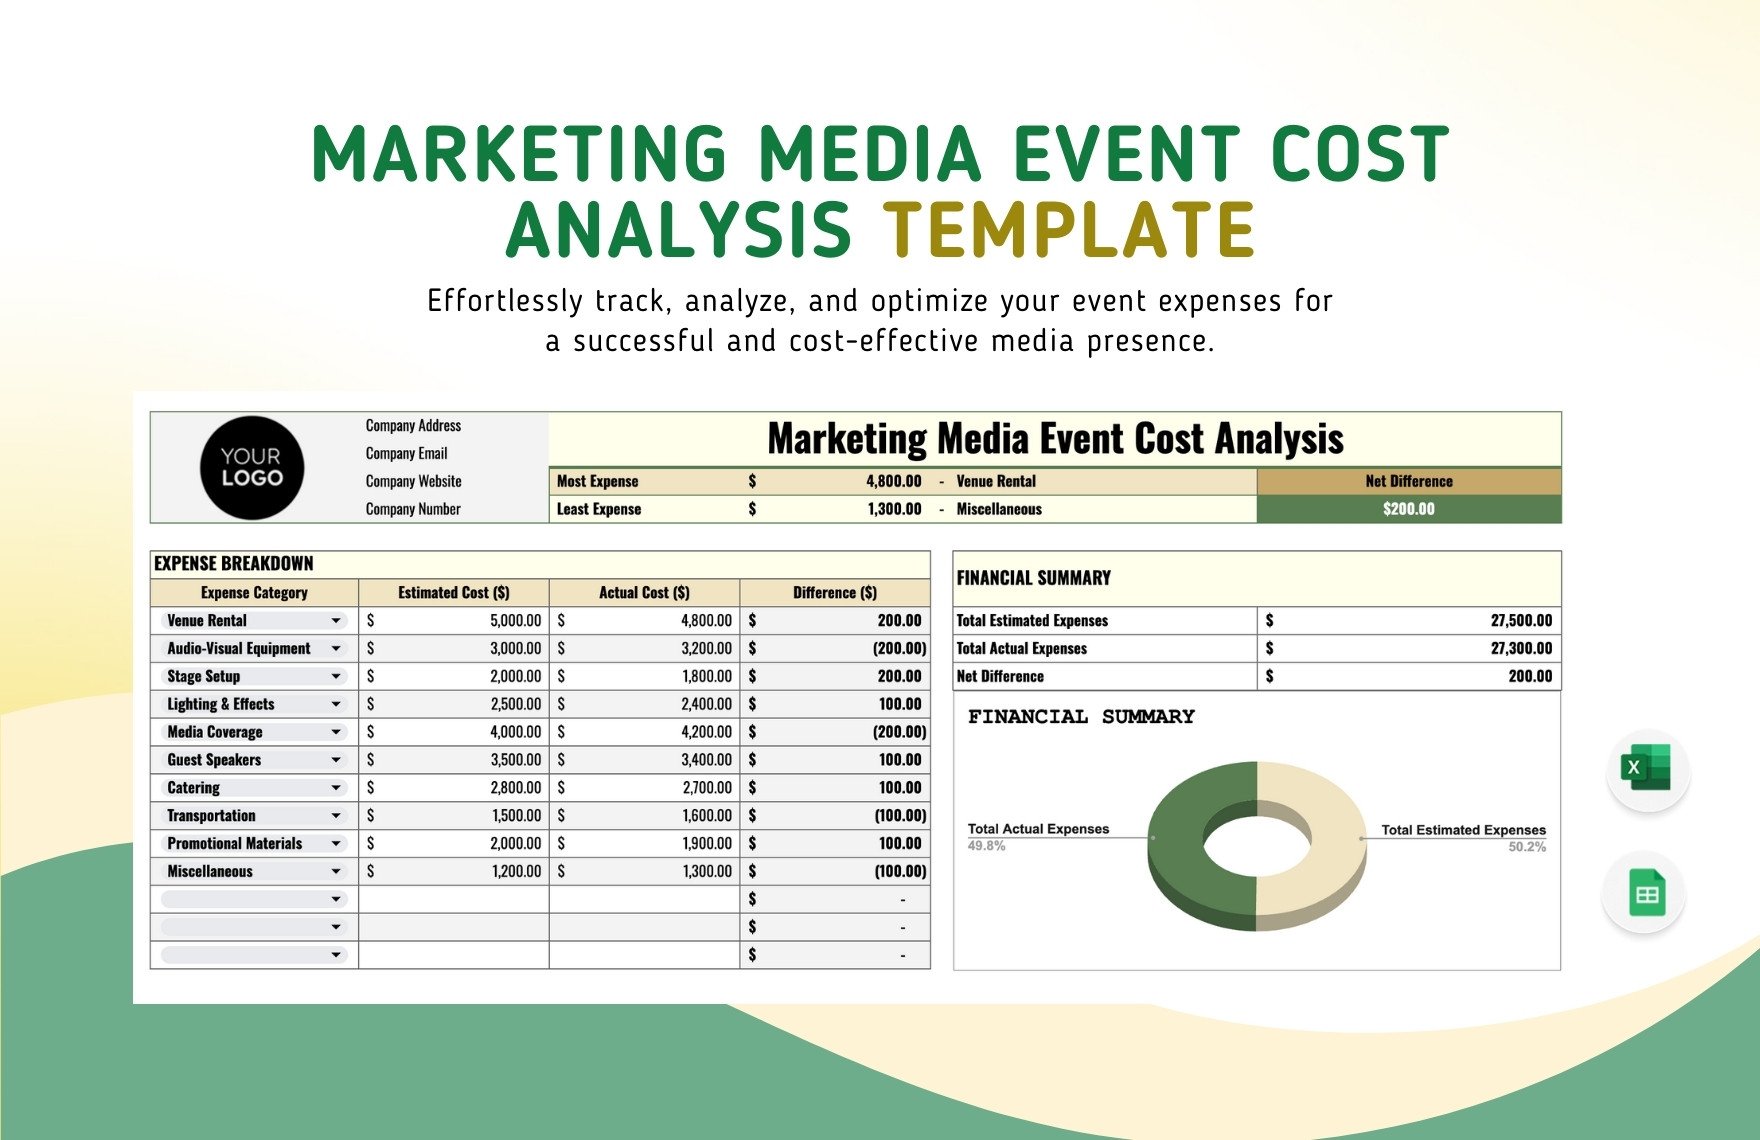
3. Create a Cost Breakdown Sheet
List all expenses under categories:
- Creative – copywriting, design, video production.
- Media – paid search, social ads, programmatic.
- Technology – marketing automation, analytics platforms.
- Personnel – internal time, external agency fees.
- Miscellaneous – event expenses, contests, influencer fees.
Use Excel’s table feature so that each category automatically sums and can be referenced in the benefit calculation sheet.
4. Build the Benefit Calculation Section
Translate cost inputs into expected outcomes. A typical structure includes:
- Projected reach – number of impressions or audience size.
- Engagement rates – click‑through, conversion, or response rates.
- Revenue metrics – incremental sales, average order value, upsell rate.
- Customer metrics – lifetime value, churn impact.
Use formulas that reference the cost sheet, ensuring any cost change automatically adjusts benefit projections.
5. Calculate Key Ratios
Populate a final table with:
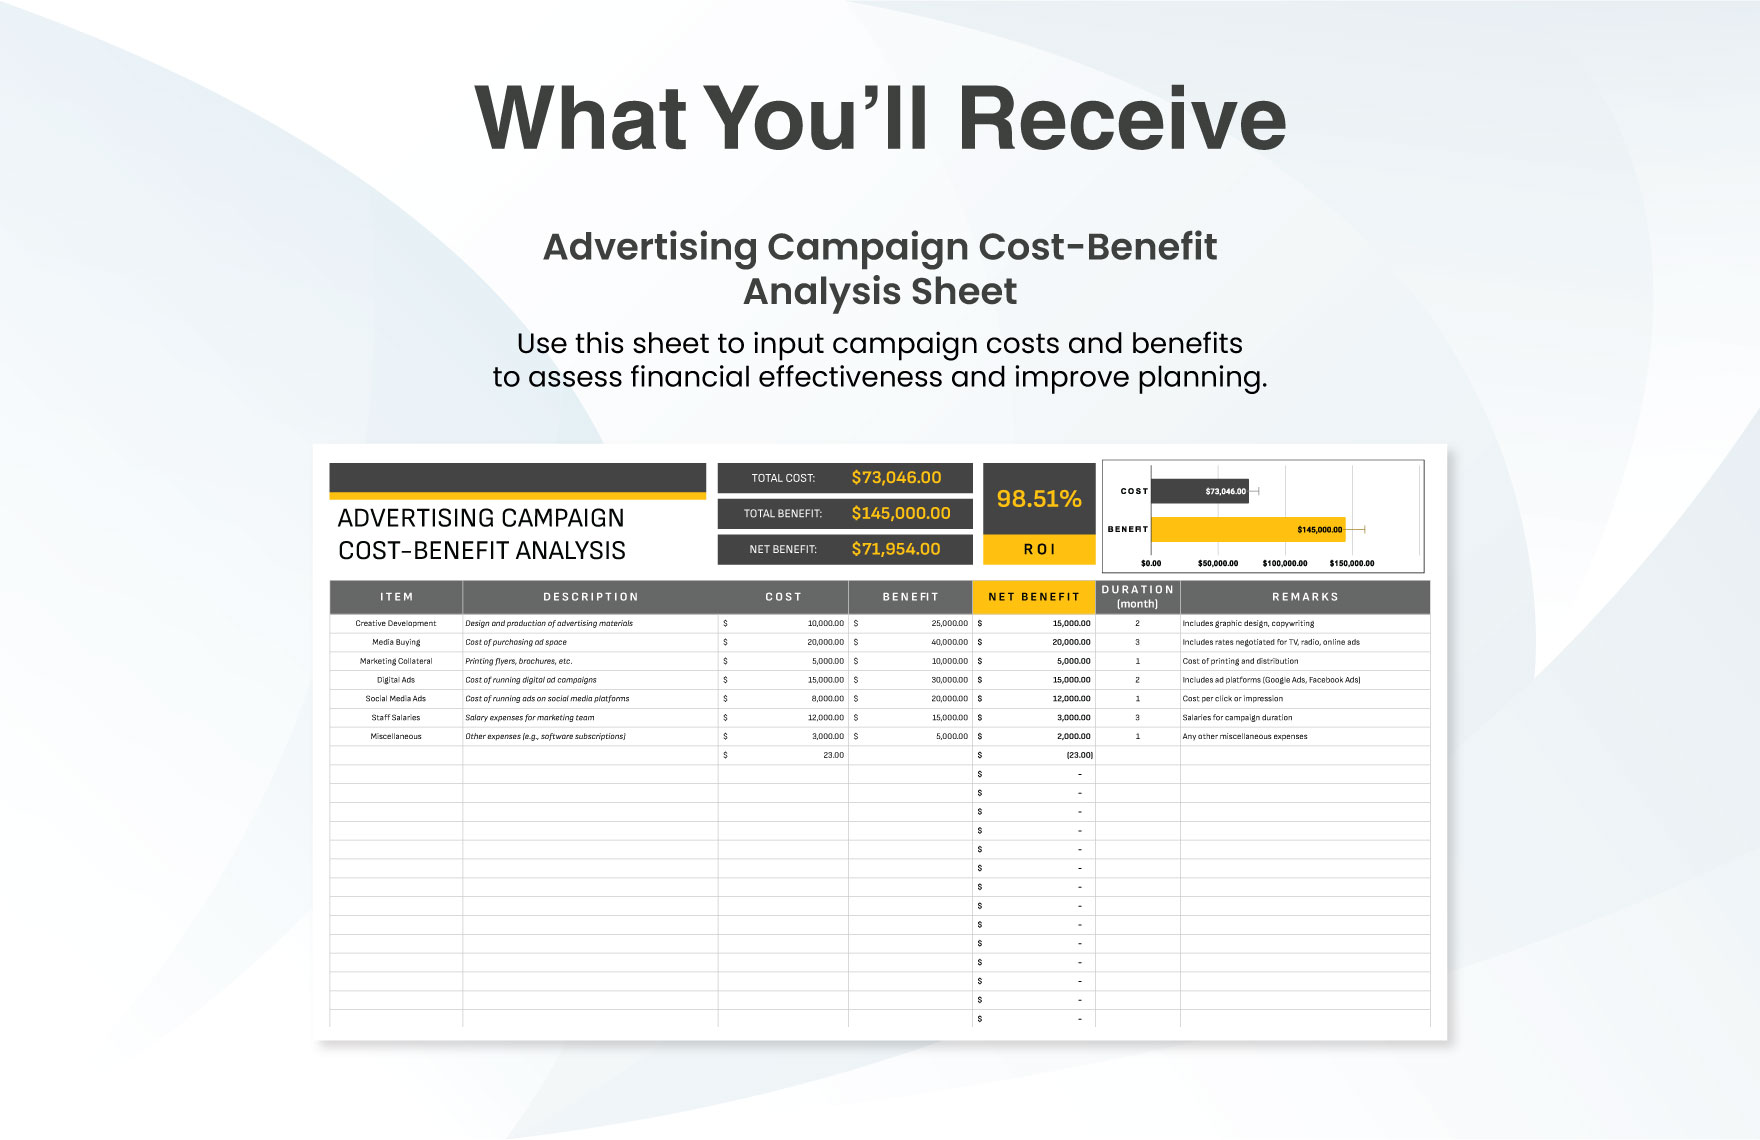
- Return on Investment (ROI) – (Benefits – Costs) / Costs.
- Payback Period – time it takes for benefits to equal costs.
- Net Present Value (NPV) – discounted cash flow of benefits over time.
These metrics let you rank campaigns and justify budget allocations.
6. Incorporate Scenario Analysis
Create columns for “Optimistic,” “Pessimistic,” and “Base Case.” Adjust key variables such as conversion rate, CPM, or AOV to see how sensitive ROI is to market changes. This adds confidence for executives and prepares you for risk mitigation.
7. Design a Dashboard
Use conditional formatting, sparklines, and charting tools to produce a single‑page executive summary. Highlight critical metrics like ROI percentage, payback time, and top‑performing channel, making the template a ready‑to‑present tool.
Real‑World Example: Launching a New Product Line
Imagine a tech company launching a smartwatch. The marketing team wants to evaluate a three‑month launch campaign comprising digital ads, influencer partnerships, and a pop‑up event.
Cost Breakdown:
- Creative: $20,000.
- Media: $60,000 (split equally across Google Ads and Instagram).
- Influencer: $25,000.
- Pop‑up: $15,000.
- Personnel: $10,000.
Total Cost: $130,000.
Benefit Assumptions:
- Projected reach: 2 million impressions.
- Click‑through rate: 2% (40,000 clicks).
- Conversion rate: 3% (1,200 sales).
- Average order value: $250.
- Gross margin: 40%.
Using the template, the team calculates incremental revenue of $300,000, gross profit of $120,000, and a net benefit of $-10,000 before considering long‑term brand lift. After adding a conservative 5% lift in future sales due to brand awareness, the net benefit turns positive, yielding an ROI of 23%. This quick analysis allows the team to refine the media mix and negotiate better rates with influencers.
Common Pitfalls and How to Avoid Them
Overlooking Attribution Errors
Assigning revenue solely to the last touchpoint can inflate the perceived benefit of a channel. Use multi‑touch attribution models—linear or time decay—to distribute credit fairly and adjust your template’s formulas accordingly.
Ignoring Cost of Opportunity
Focusing only on direct costs underestimates the true cost of marketing initiatives. Include staff time spent on competing projects and the opportunity cost of capital. A small addition to your cost sheet can significantly affect ROI.
Failing to Update Assumptions
Market conditions shift; a 10% change in ad pricing or conversion rates can derail the analysis. Build a dedicated “Assumptions” tab where stakeholders can update variables. Link these to your main calculations for instant recalibration.
Using Outdated Benchmarks
Benchmarks evolve with industry trends. Regularly compare your figures against peer data and industry reports. A template that flags when metrics deviate from norms helps you stay competitive.
Enhancing the Template with Advanced Features
Dynamic Forecasting Using Monte Carlo Simulations
Integrate Excel’s RAND and NORM.DIST functions to run thousands of simulations. The output shows a probability distribution of ROI, allowing risk‑averse executives to understand the likelihood of various outcomes.
Automated Data Pulls via Power Query
Connect the template to your CRM or analytics platform to auto‑populate raw data. This reduces manual entry errors and keeps the analysis current without manual intervention.
Customizable Dashboards with Power BI
Export your template to Power BI for interactive dashboards. Stakeholders can drill down into channel performance or tweak assumptions on the fly, creating a collaborative budgeting environment.
Integrating the Template into the Marketing Funnel
Place the CBA at every key funnel stage:
- Awareness – evaluate spend versus reach and brand lift.
- Consideration – link content marketing spend to lead quality scores.
- Conversion – tie sales enablement tools to incremental conversions.
- Retention – assess loyalty program costs versus repeat purchase value.
By embedding the template across the funnel, you can track the entire customer journey and see where marketing dollars are most effectively deployed.
Tips for Customizing the Template for Your Brand

- Adjust cost categories to fit your organizational structure (e.g., separate “SEO” from “Paid Search”).
- Incorporate a “Sustainability” column if your brand measures environmental impact or social responsibility.
- Include a “Compliance” section to capture regulatory costs in highly regulated industries.
- Translate ROI metrics into your company’s specific KPI framework (e.g., Customer Acquisition Cost per Acquisition or Cost per Lead).
Customization ensures the template resonates with internal stakeholders and reflects the unique aspects of your marketing ecosystem.
Conclusion
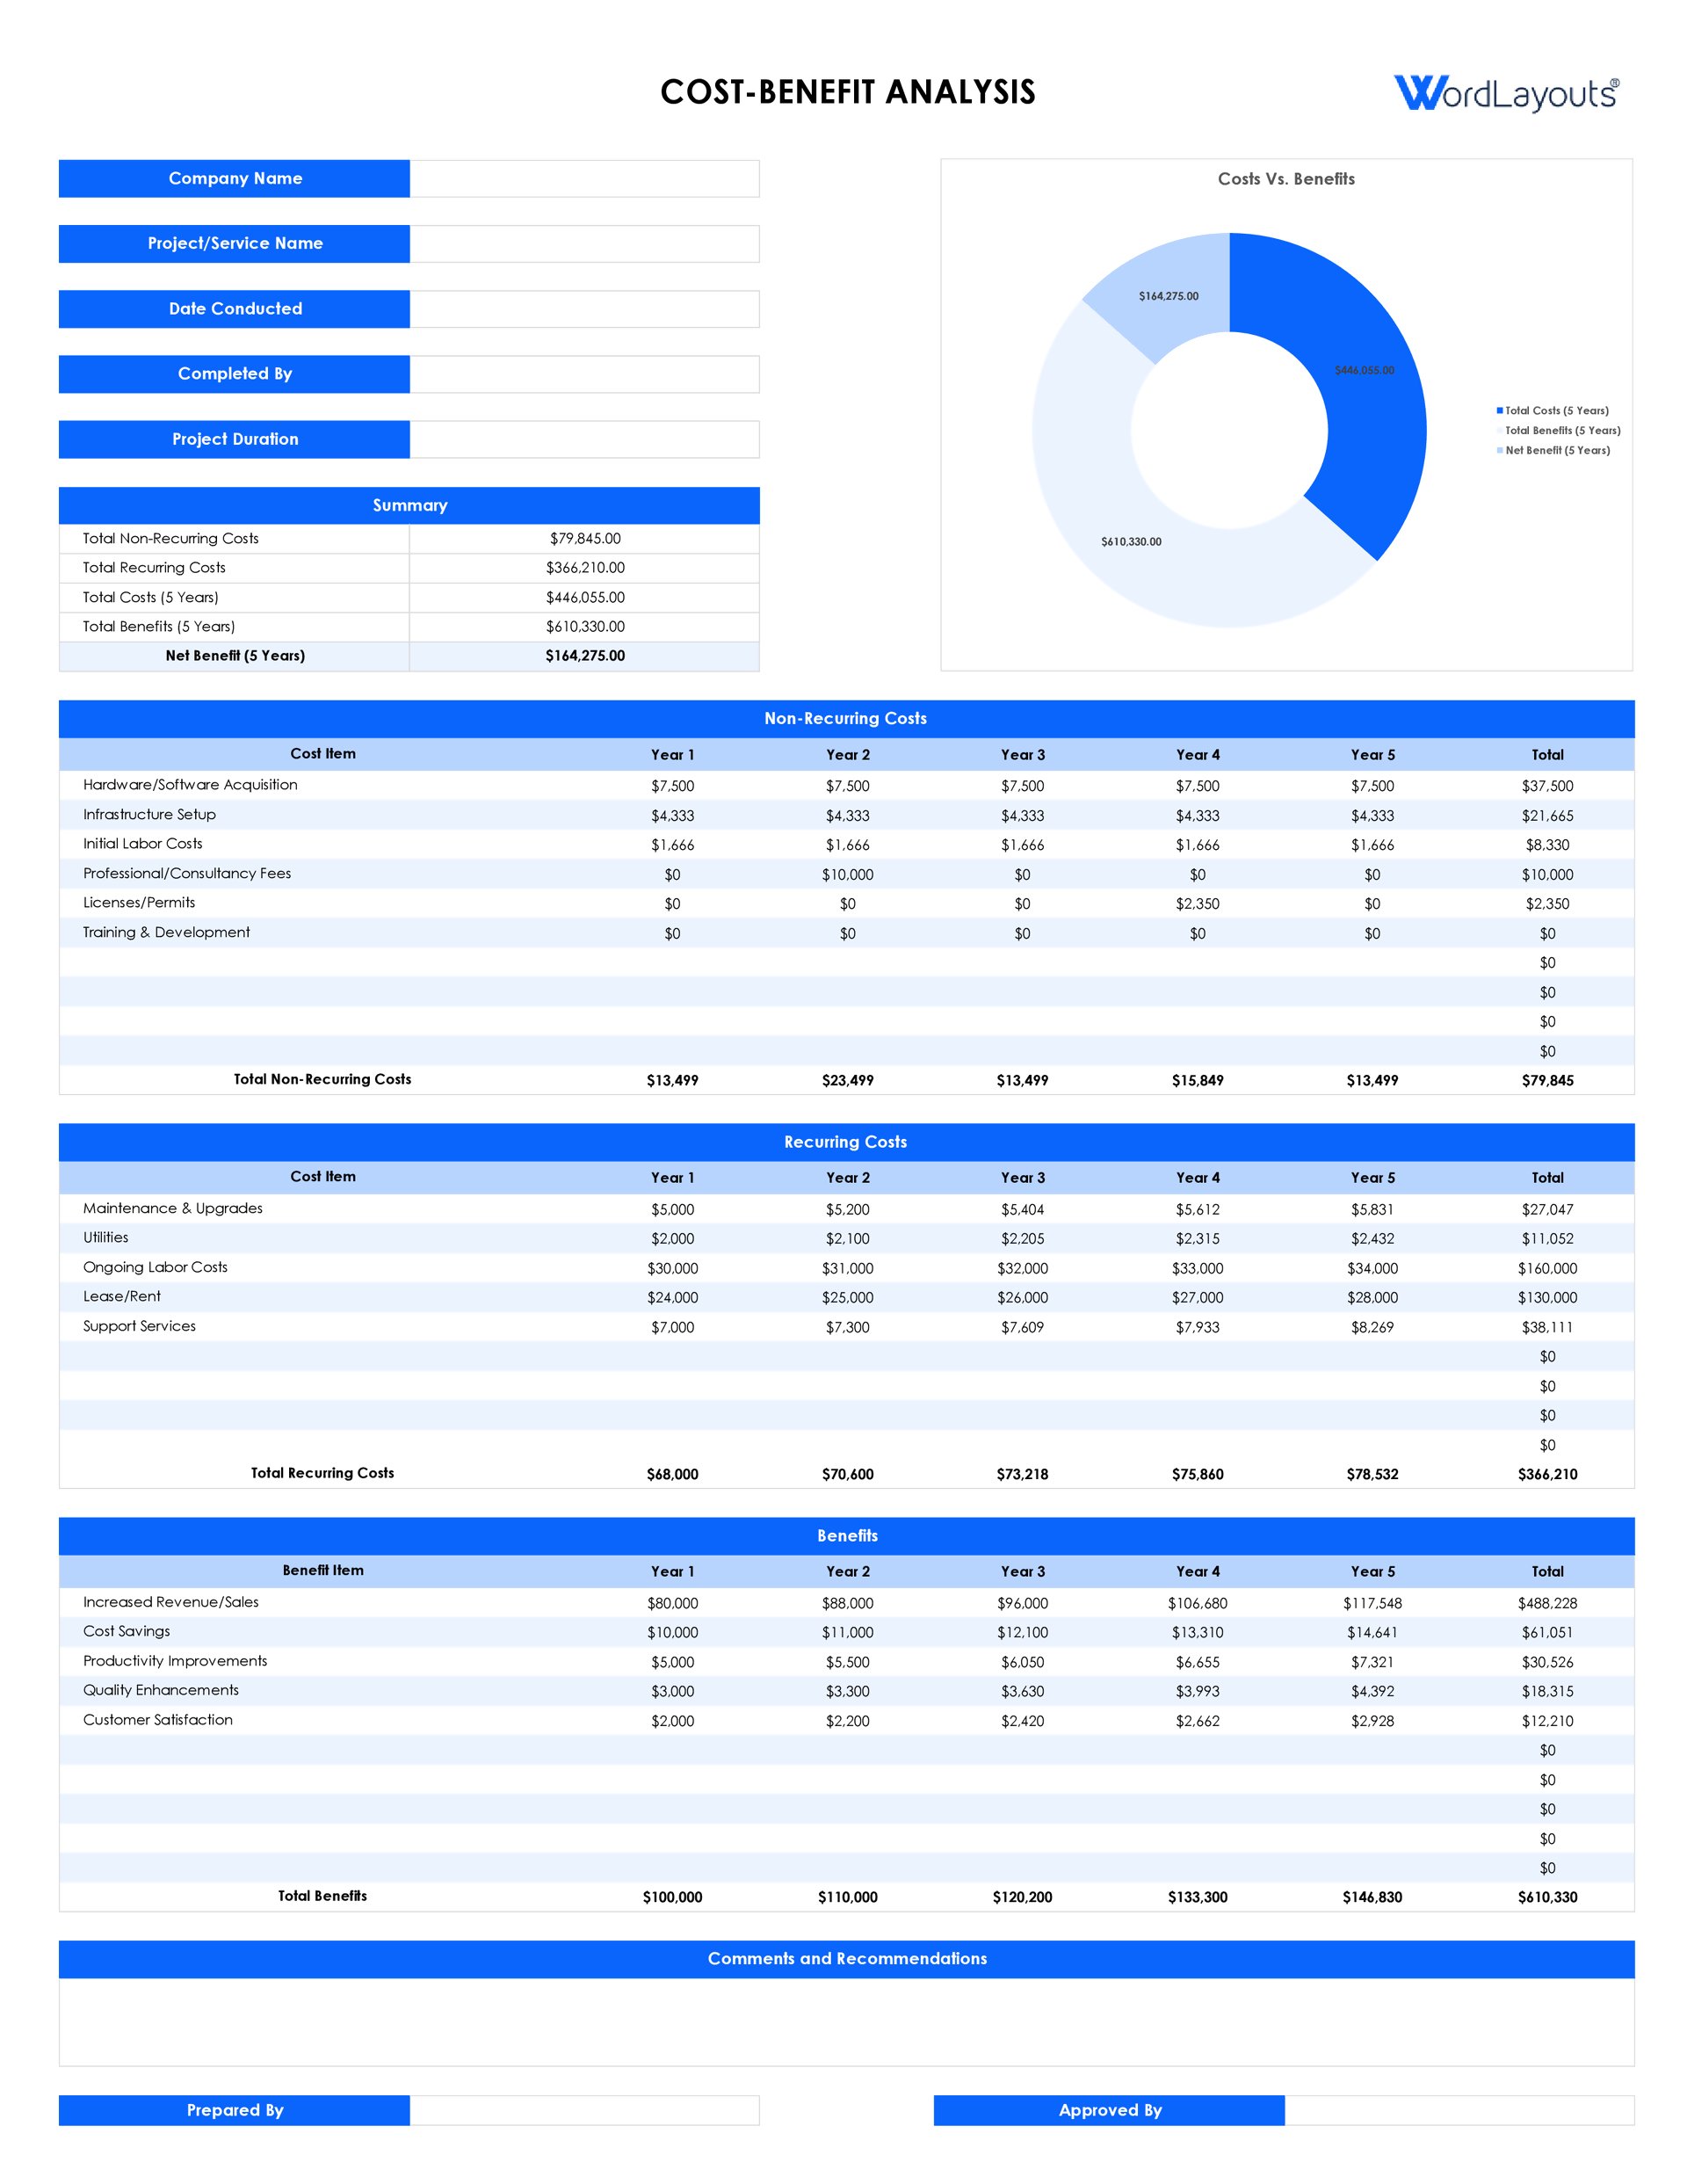
A well‑crafted Marketing Cost Benefit Analysis Template transforms abstract marketing spend into tangible business value. By methodically cataloging costs, quantifying benefits, and employing scenario planning, you create a repeatable, transparent process that empowers marketers to allocate budgets strategically, secure executive buy‑in, and drive measurable growth. Implement the steps outlined above, adapt the template to your brand’s nuances, and let data, not intuition, guide every marketing decision.