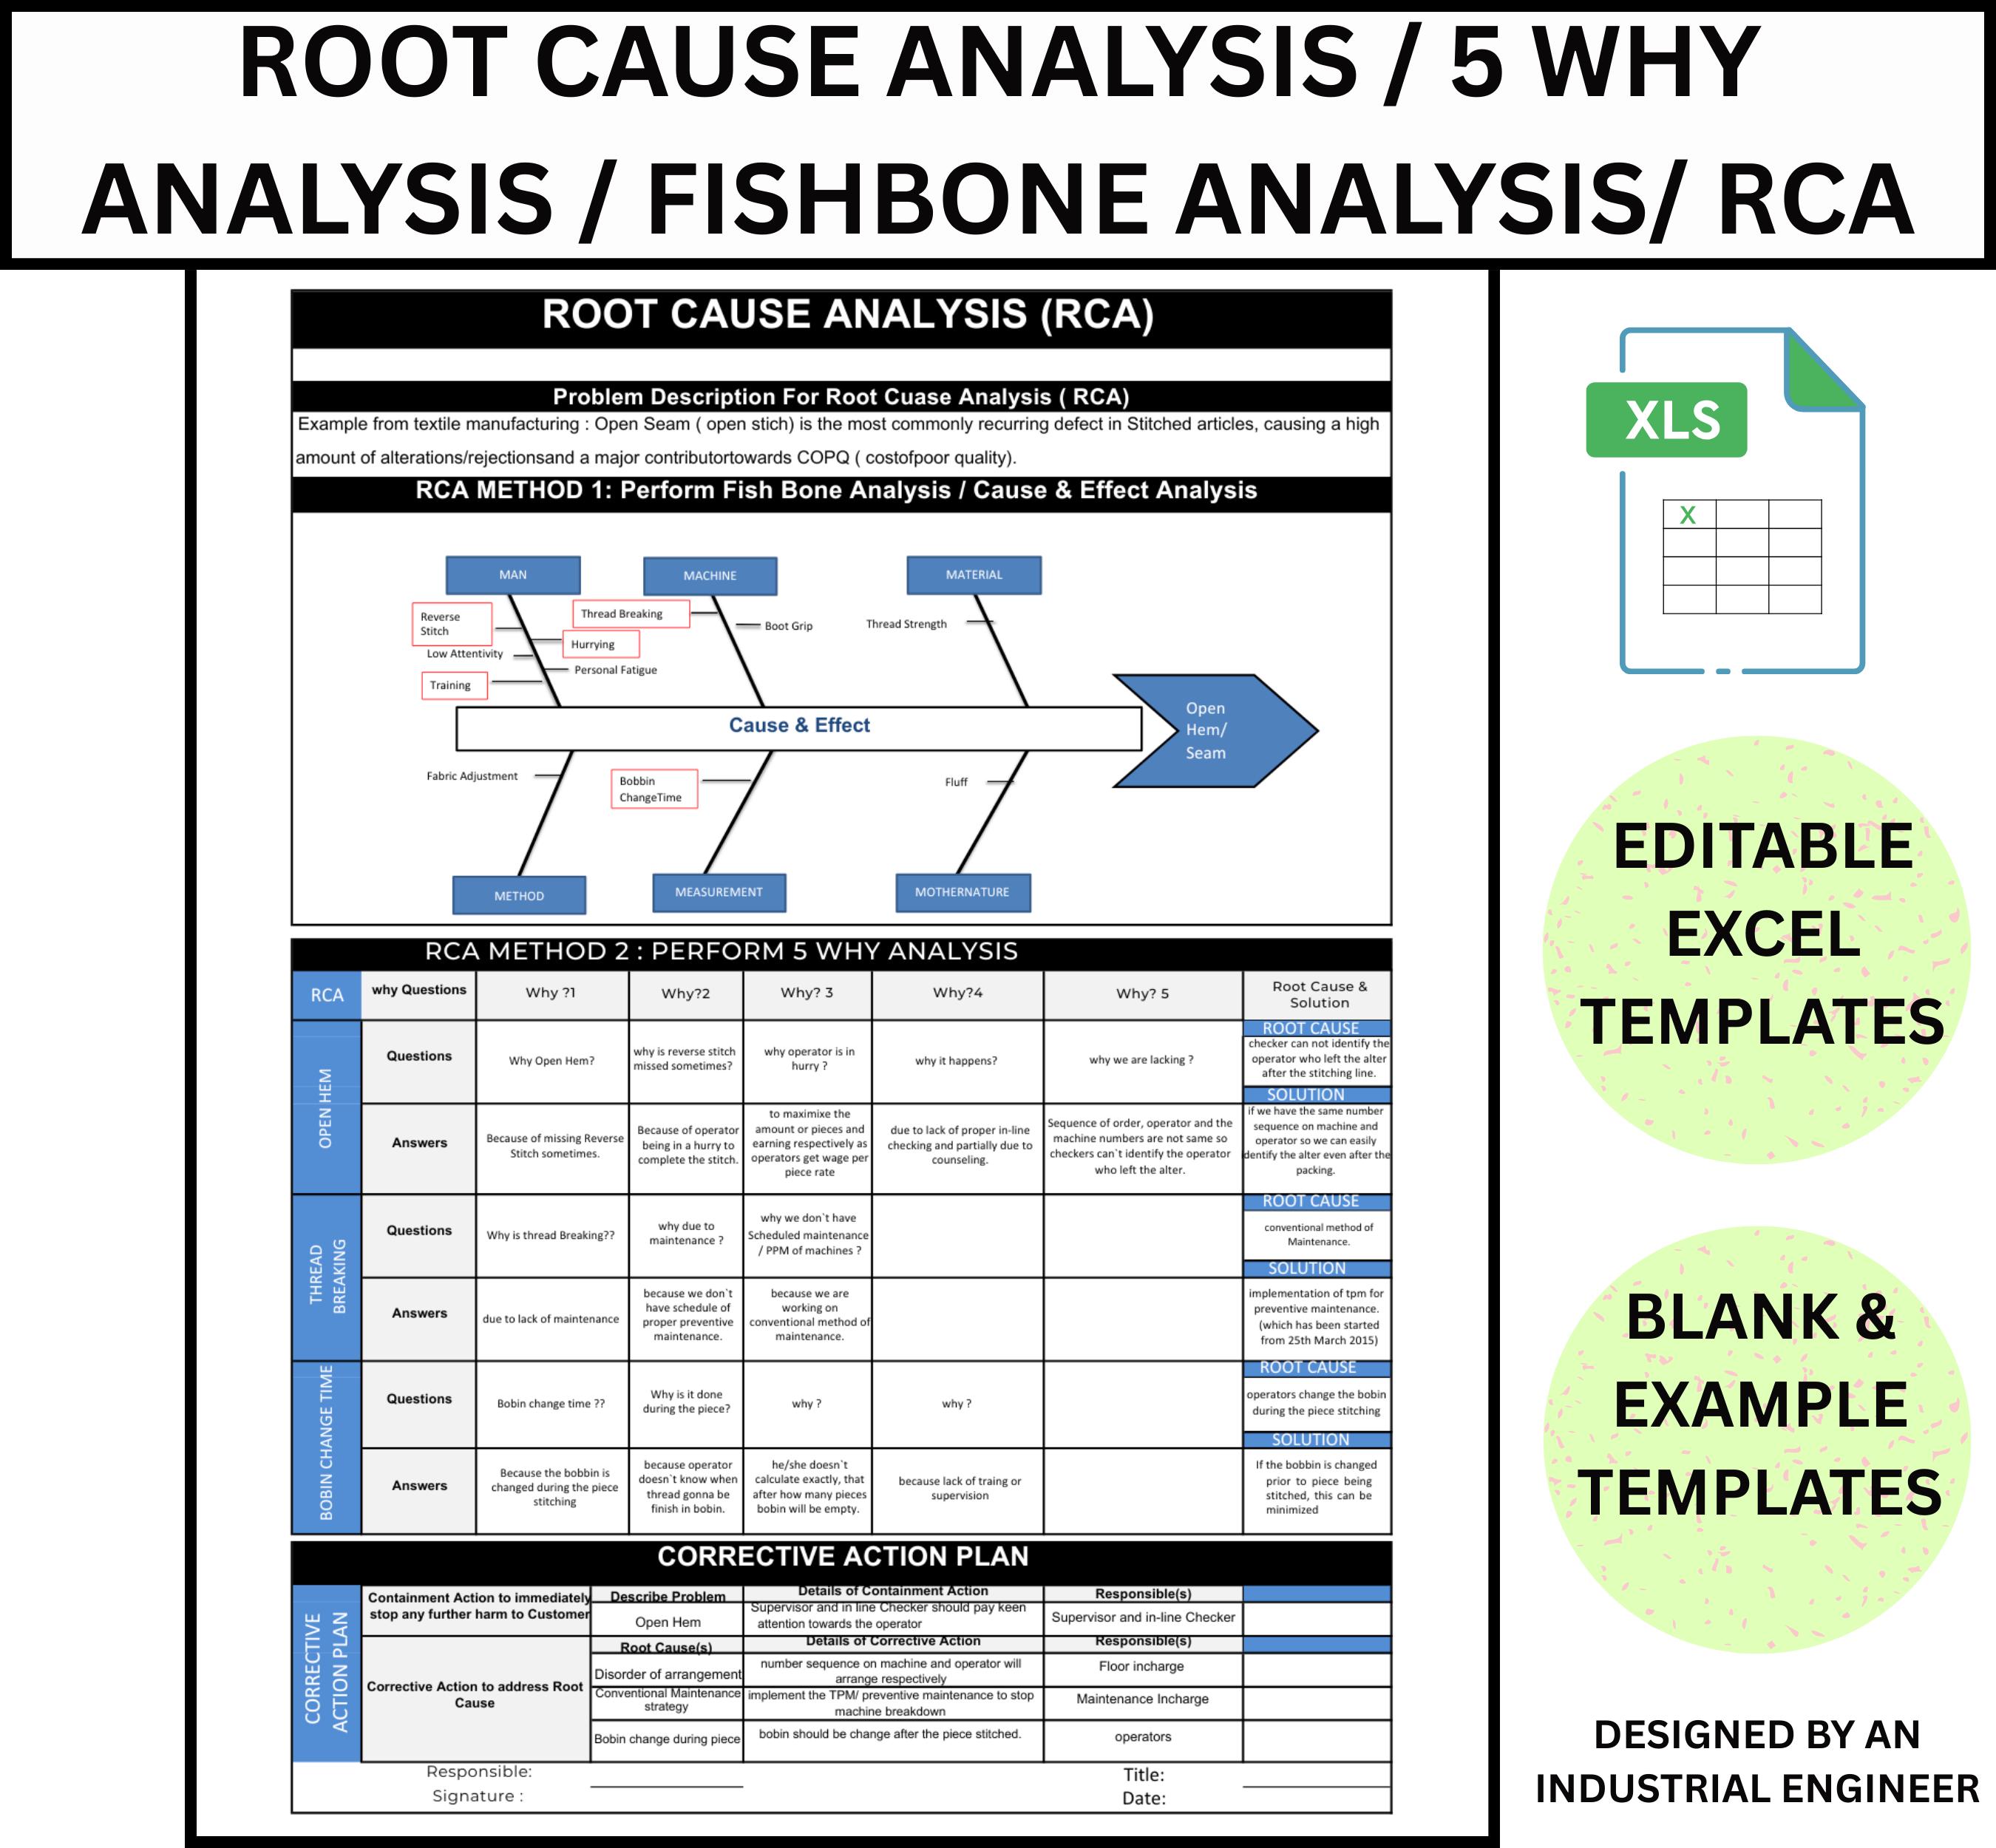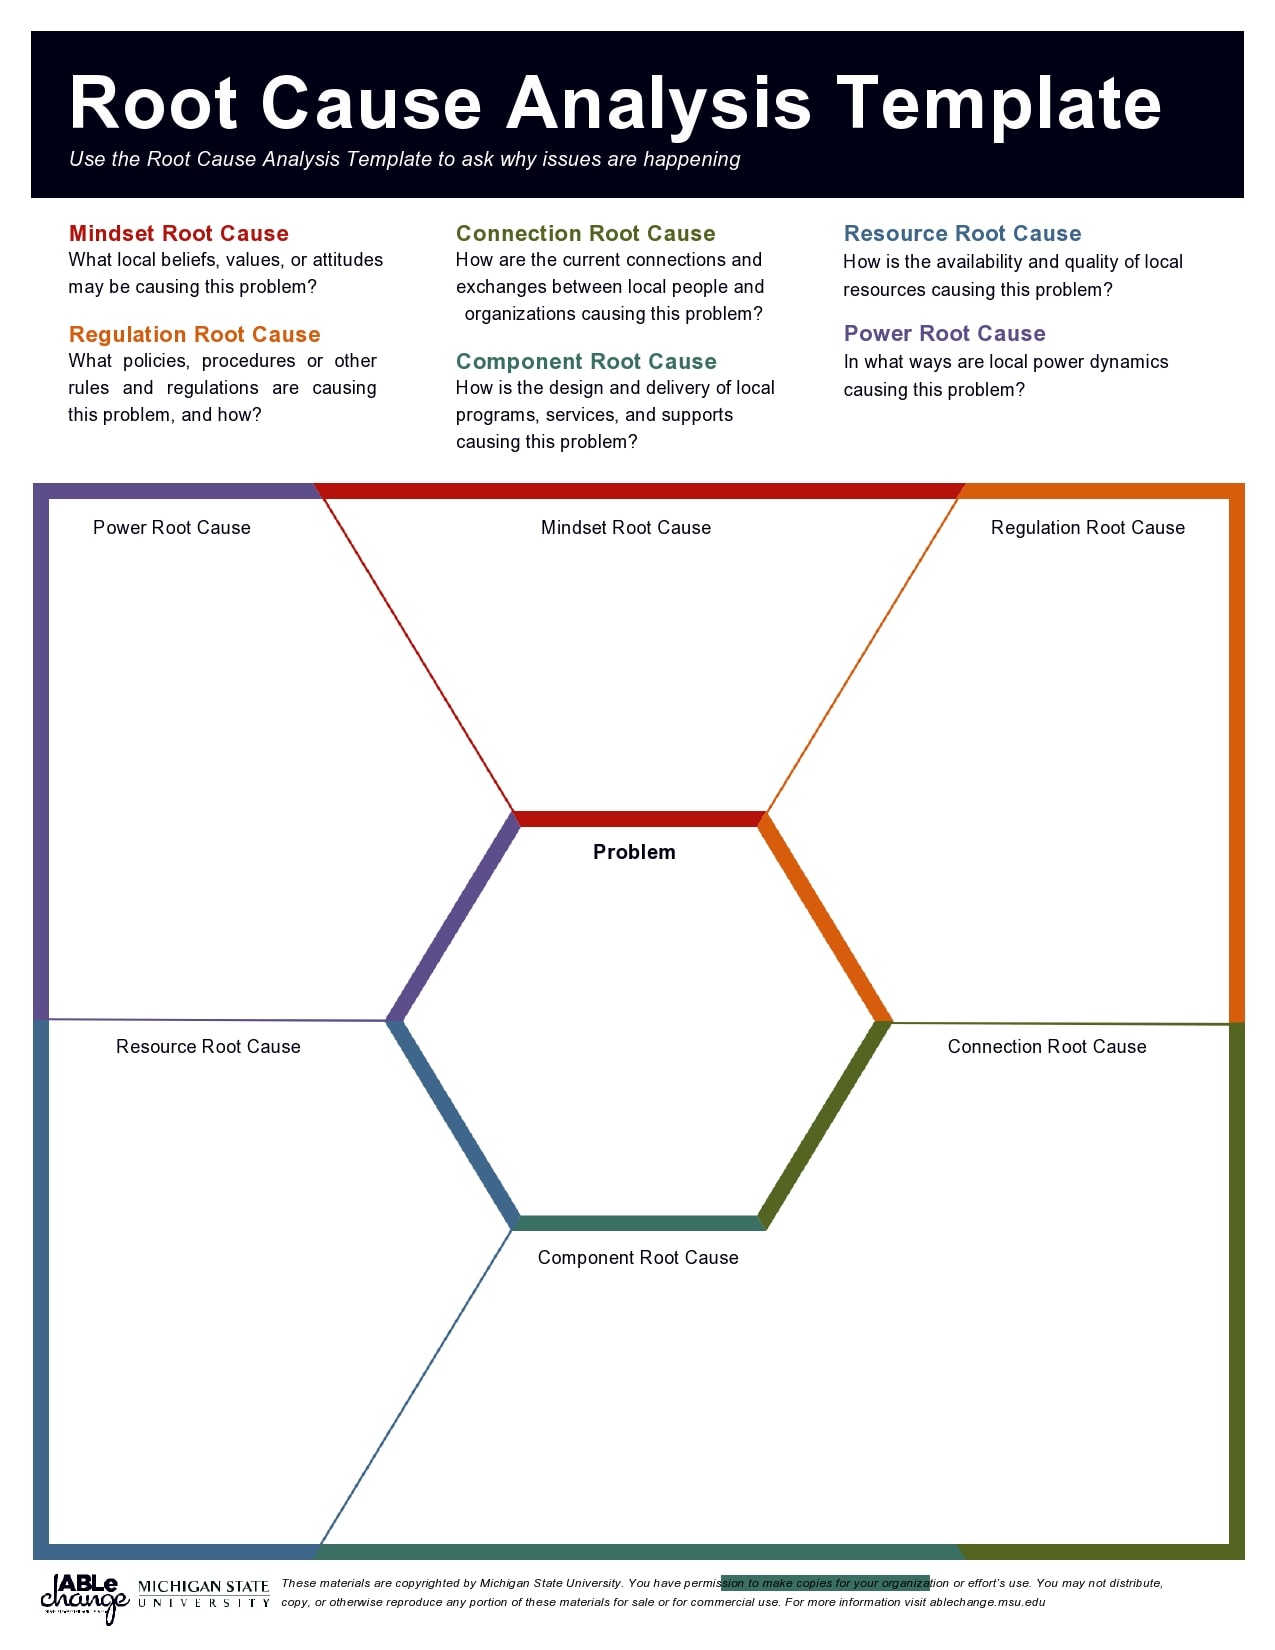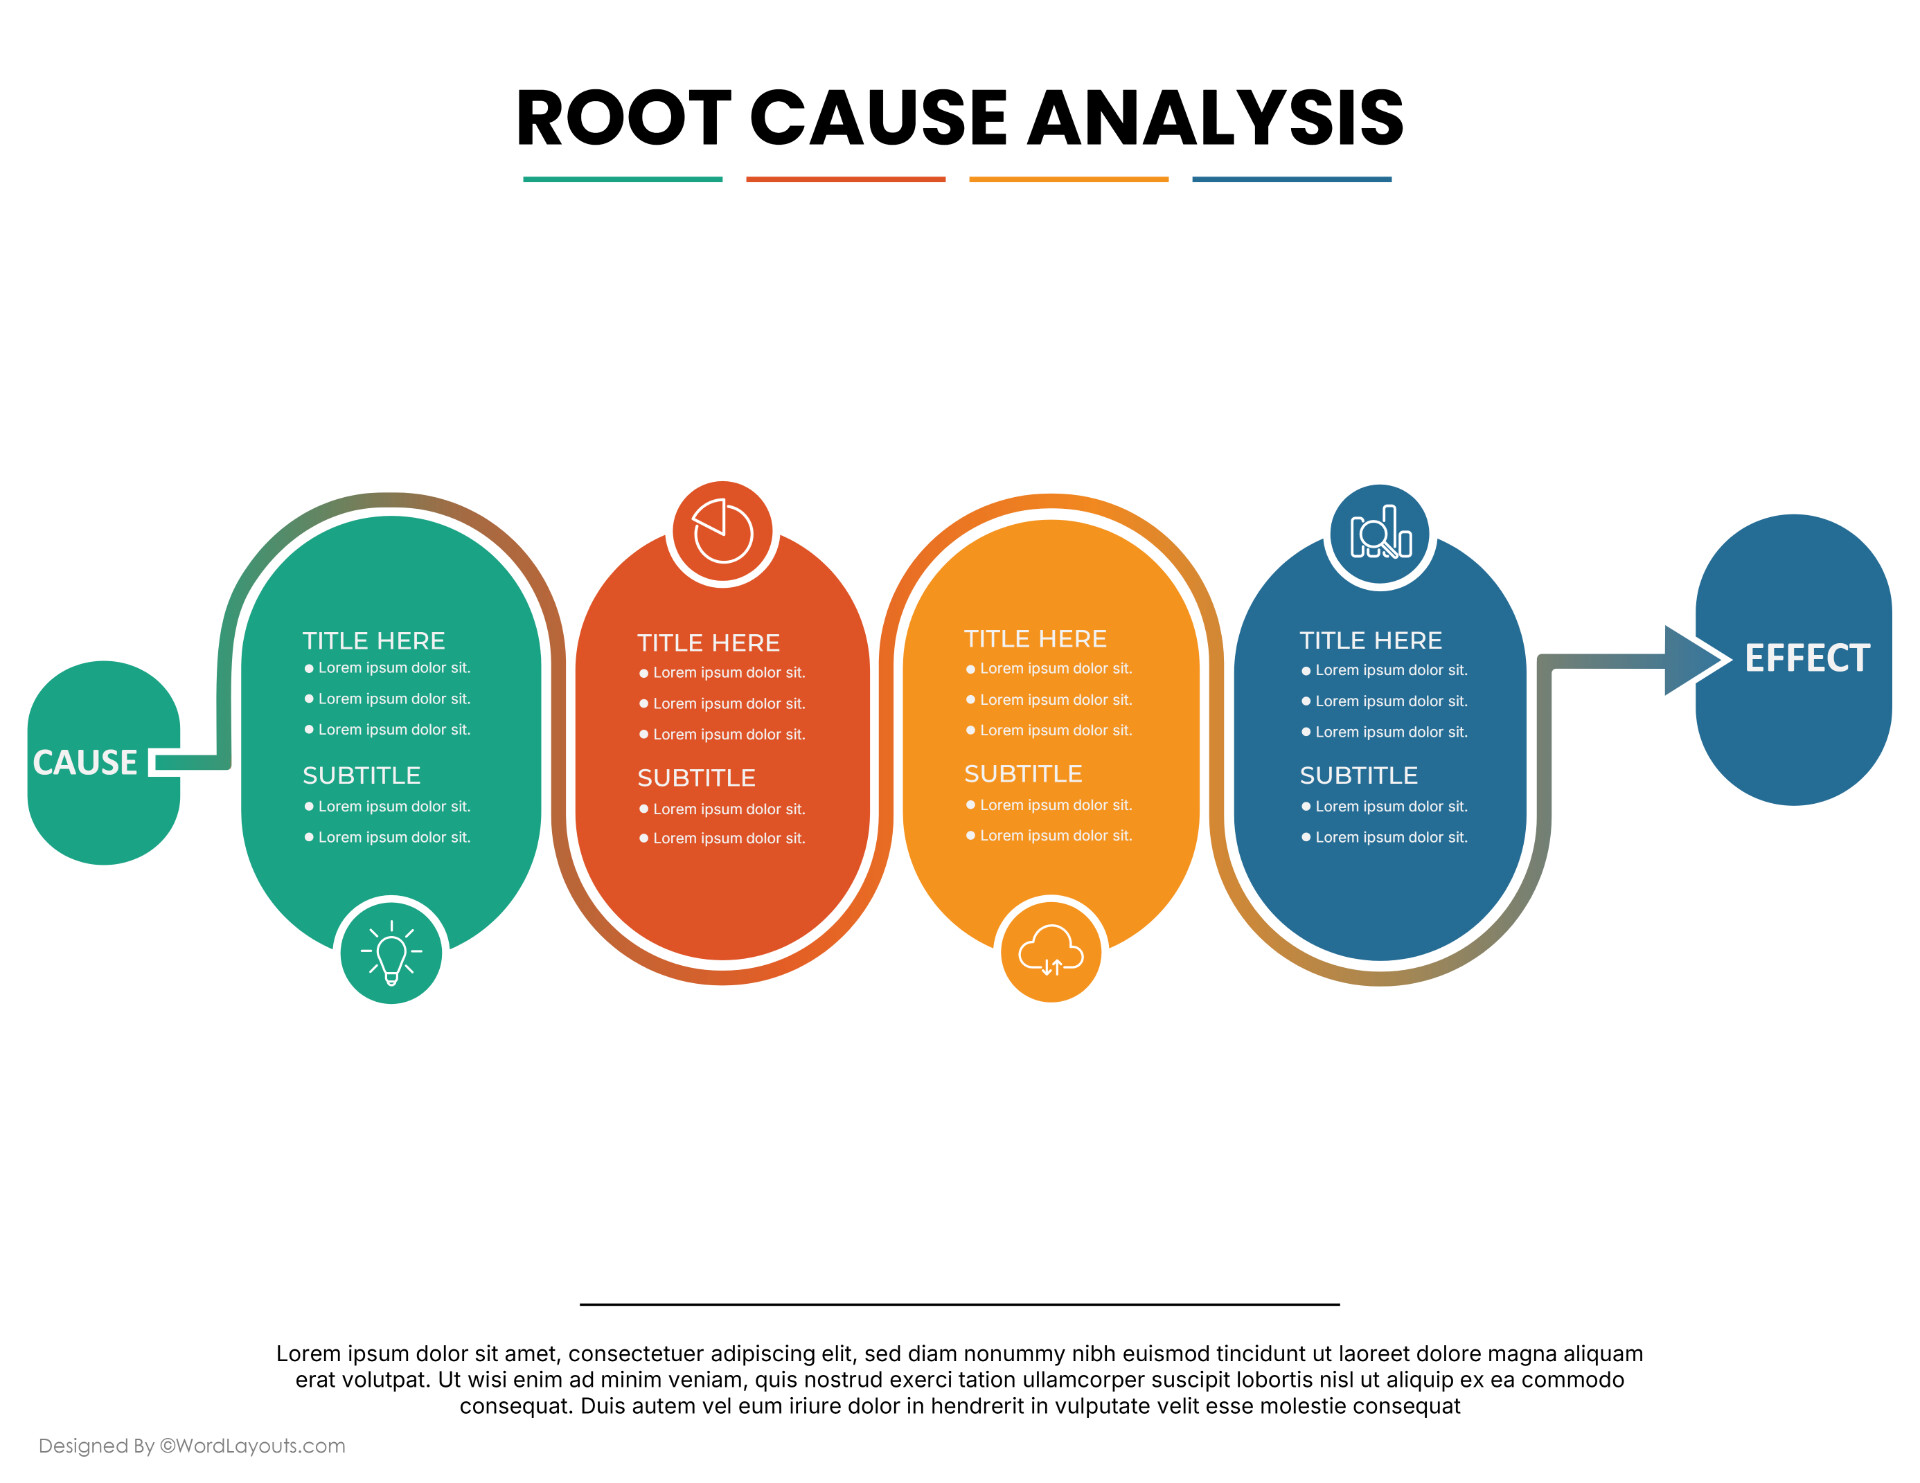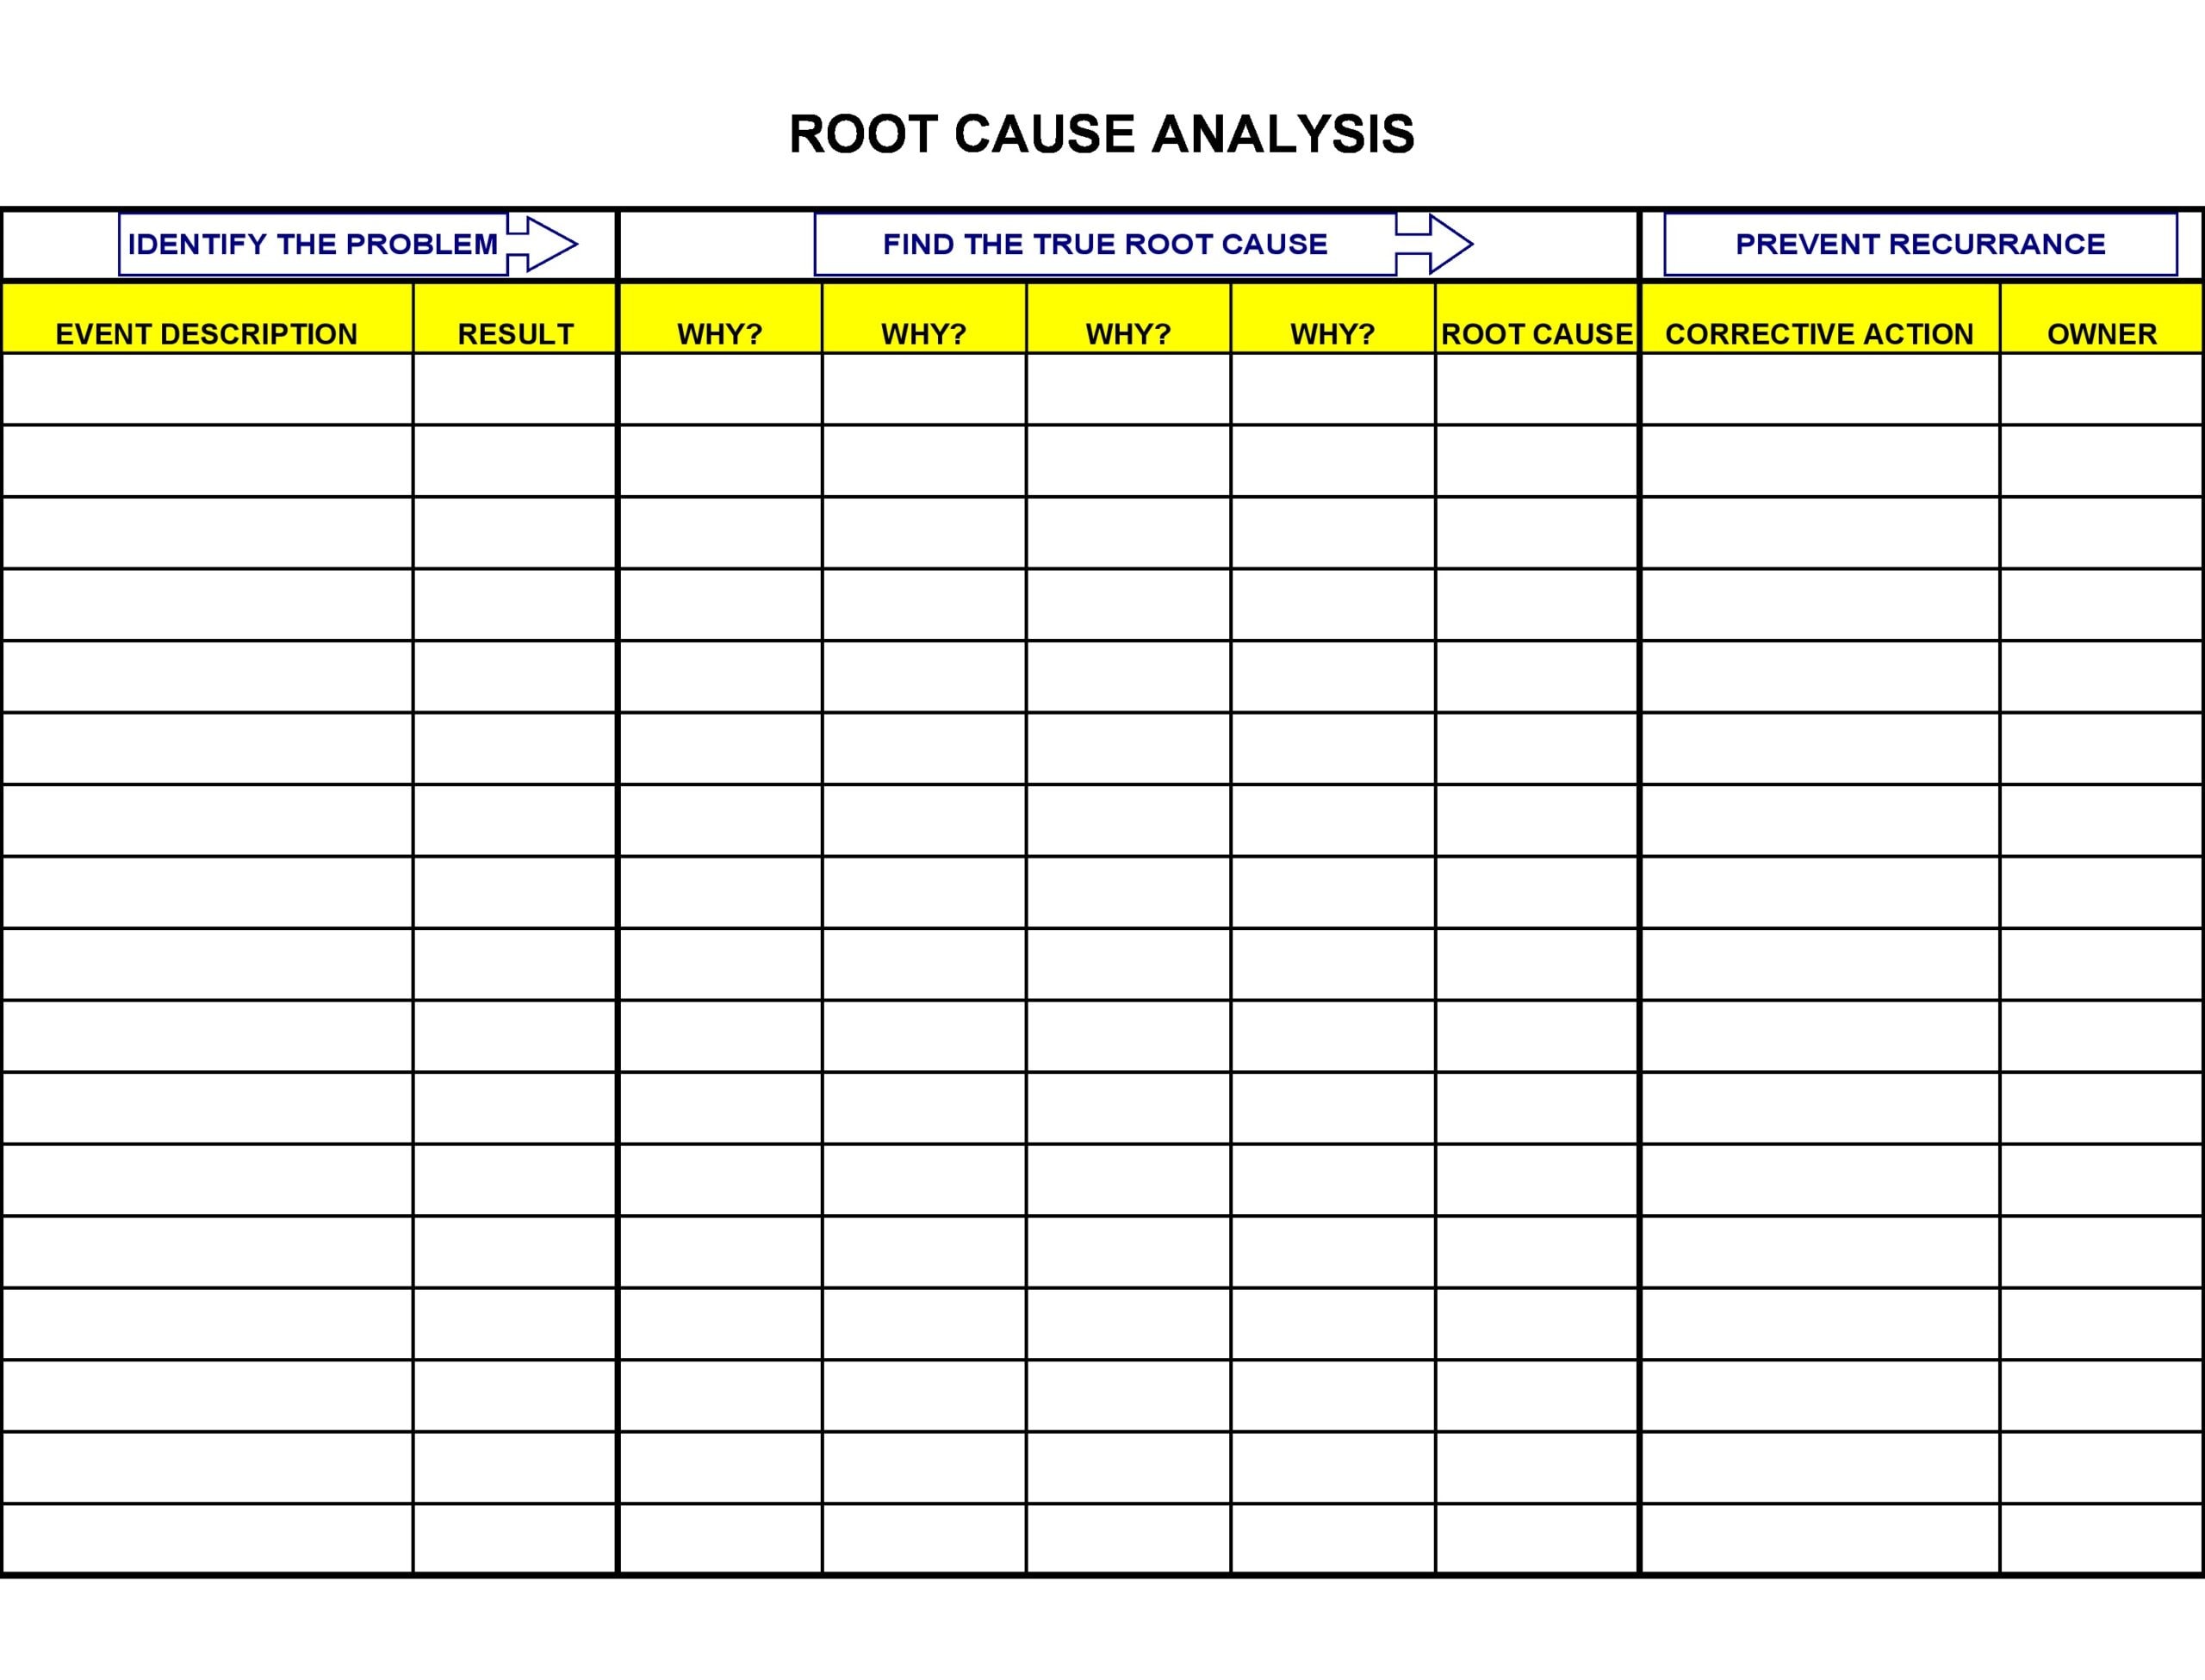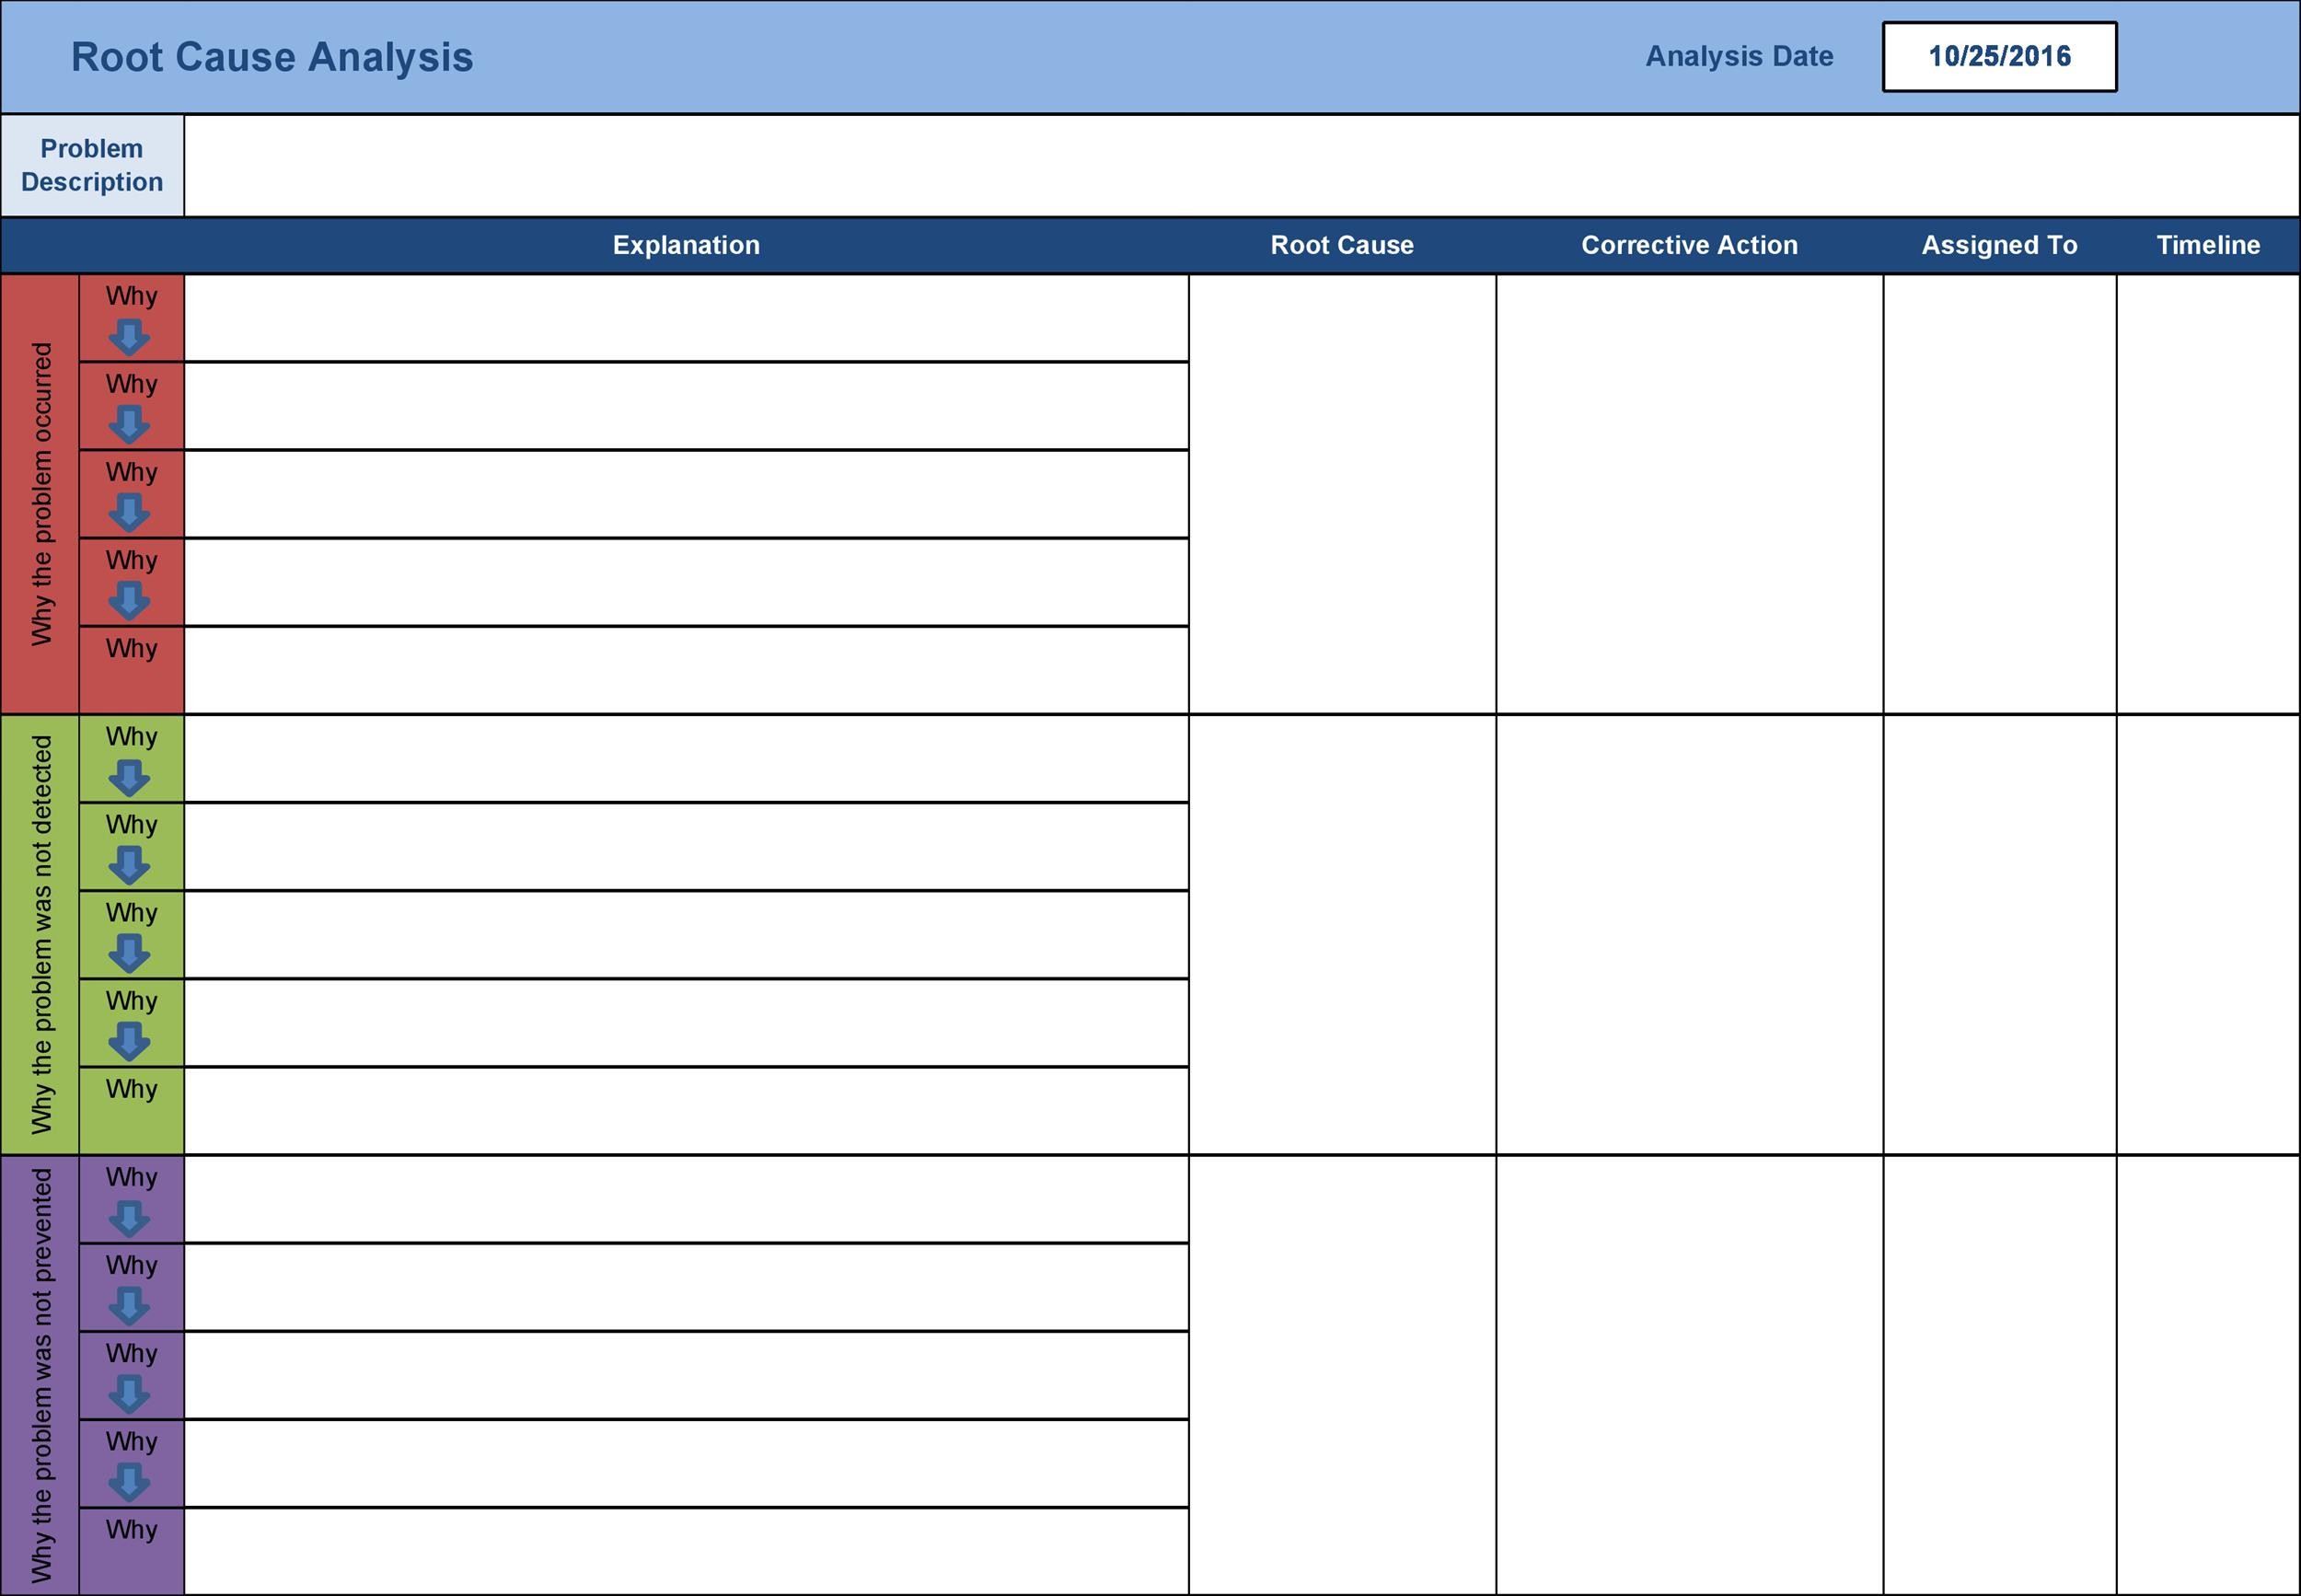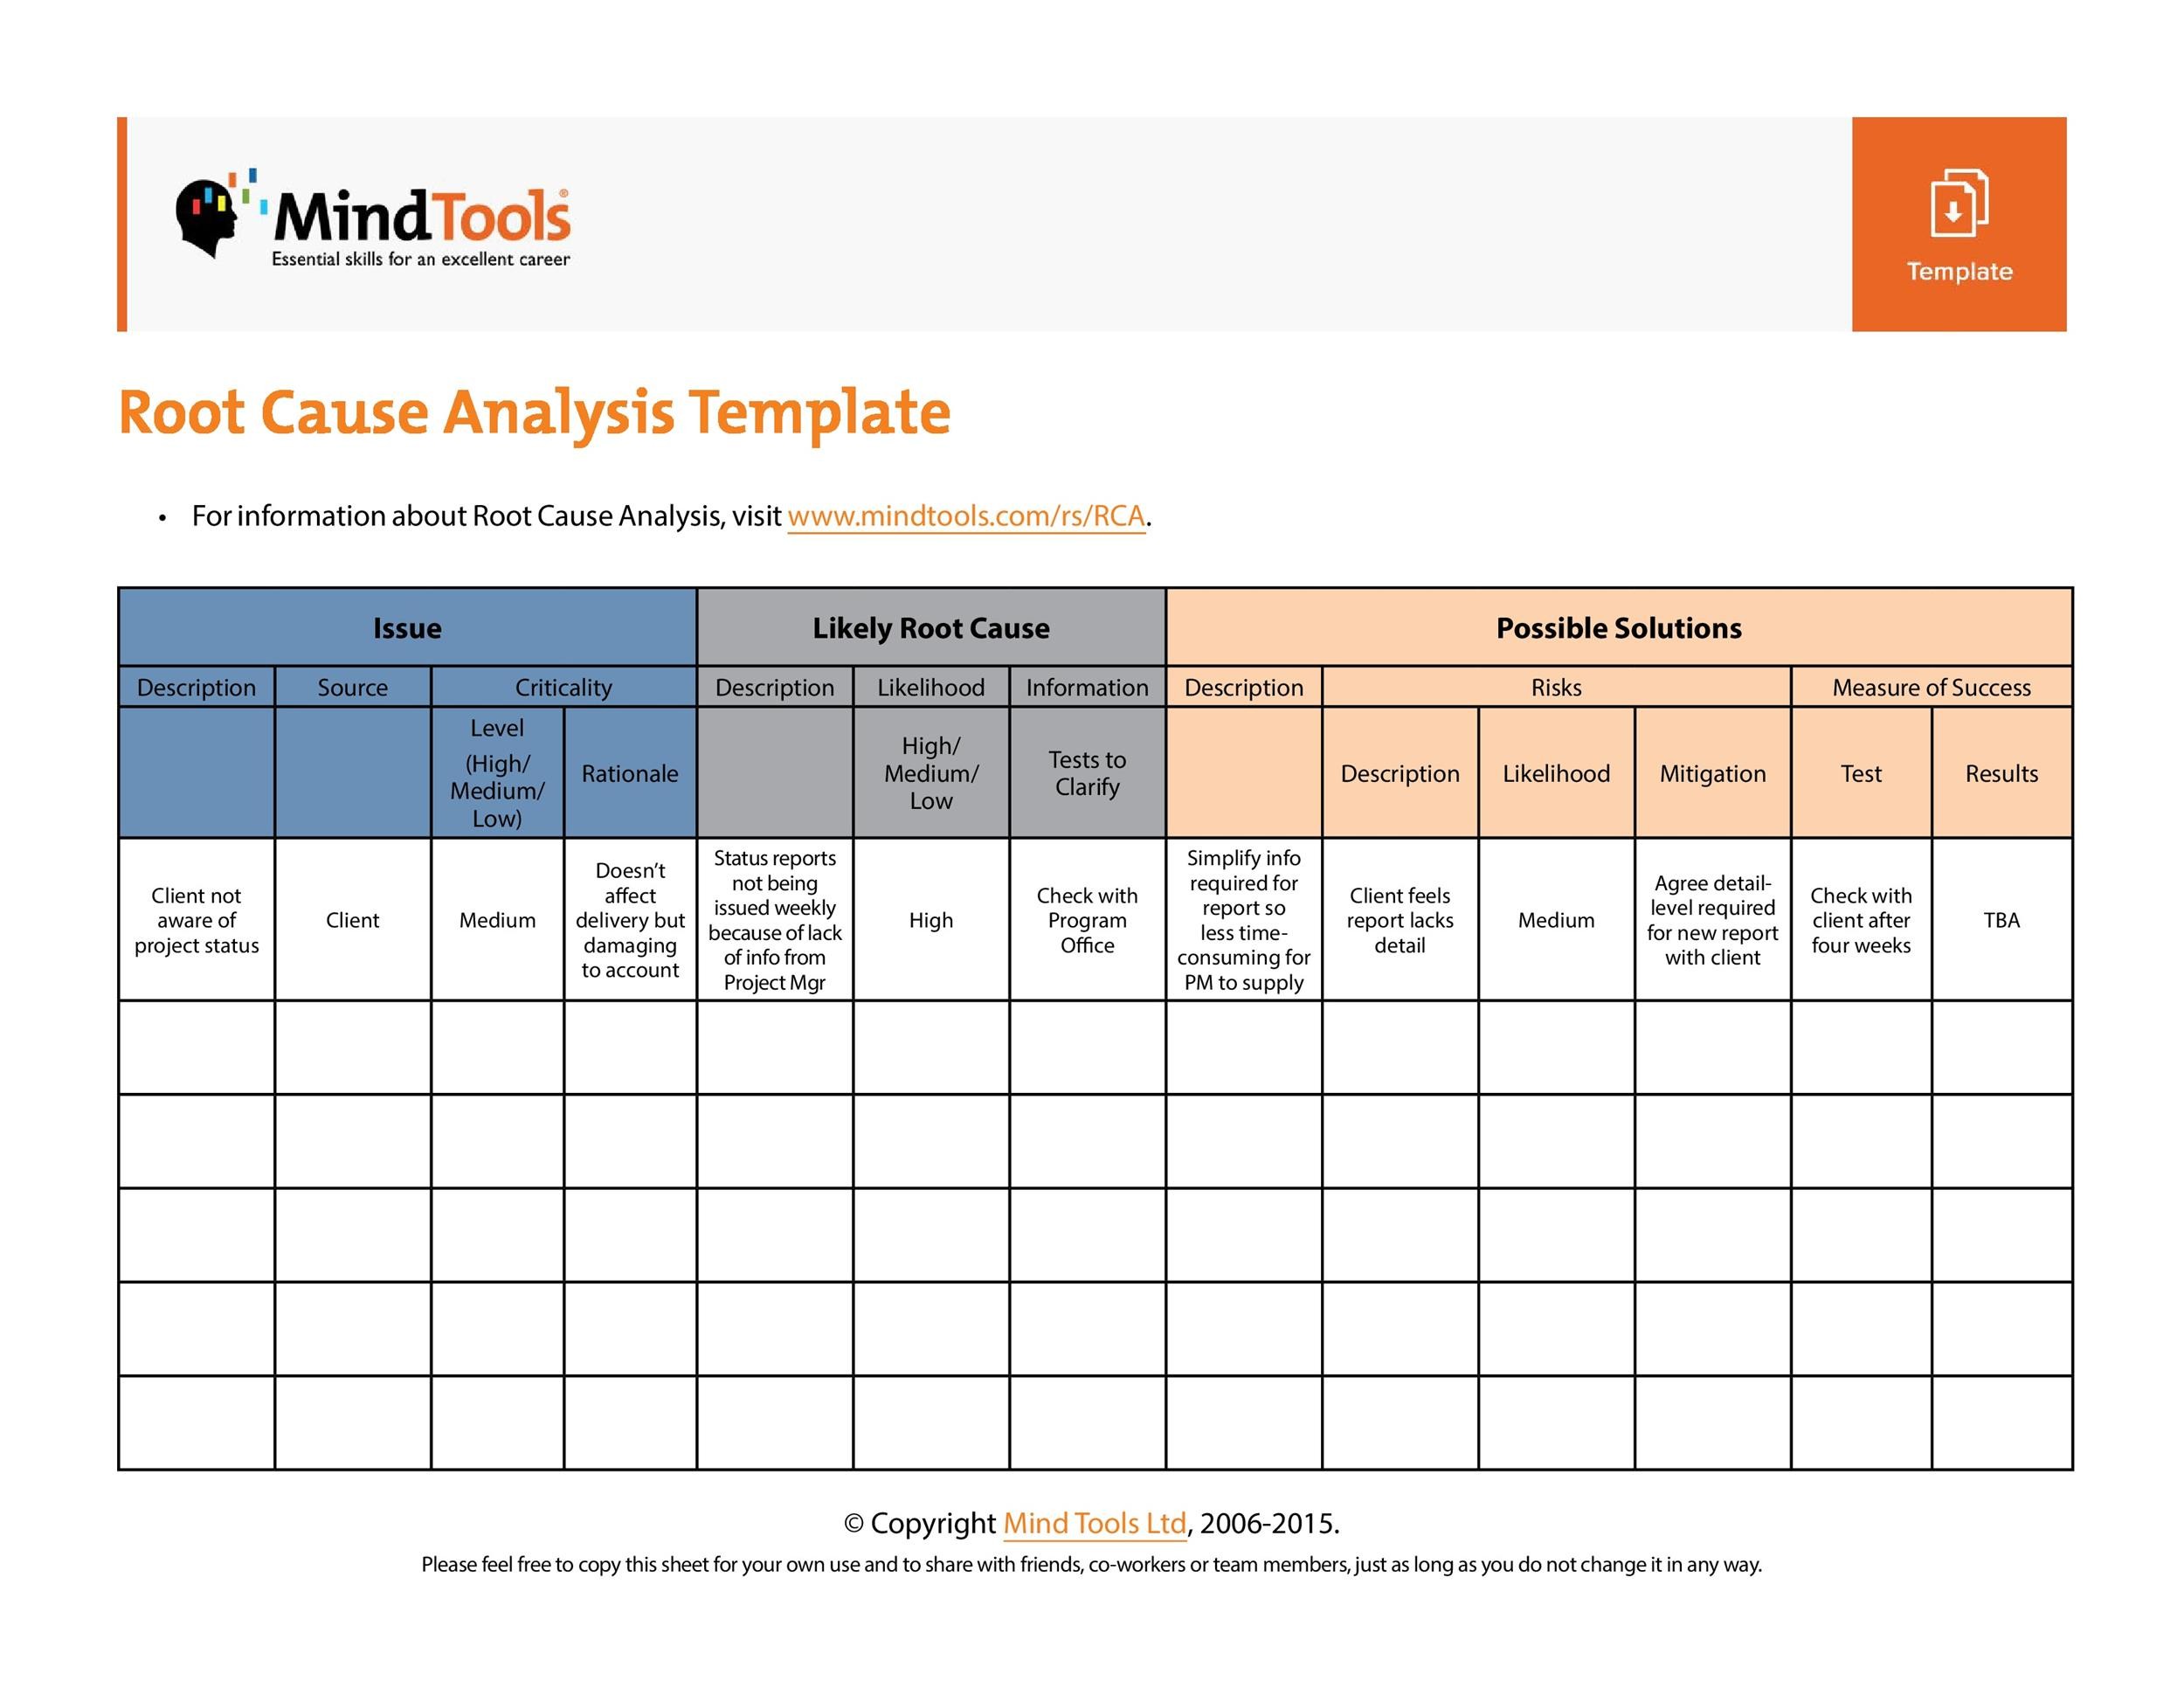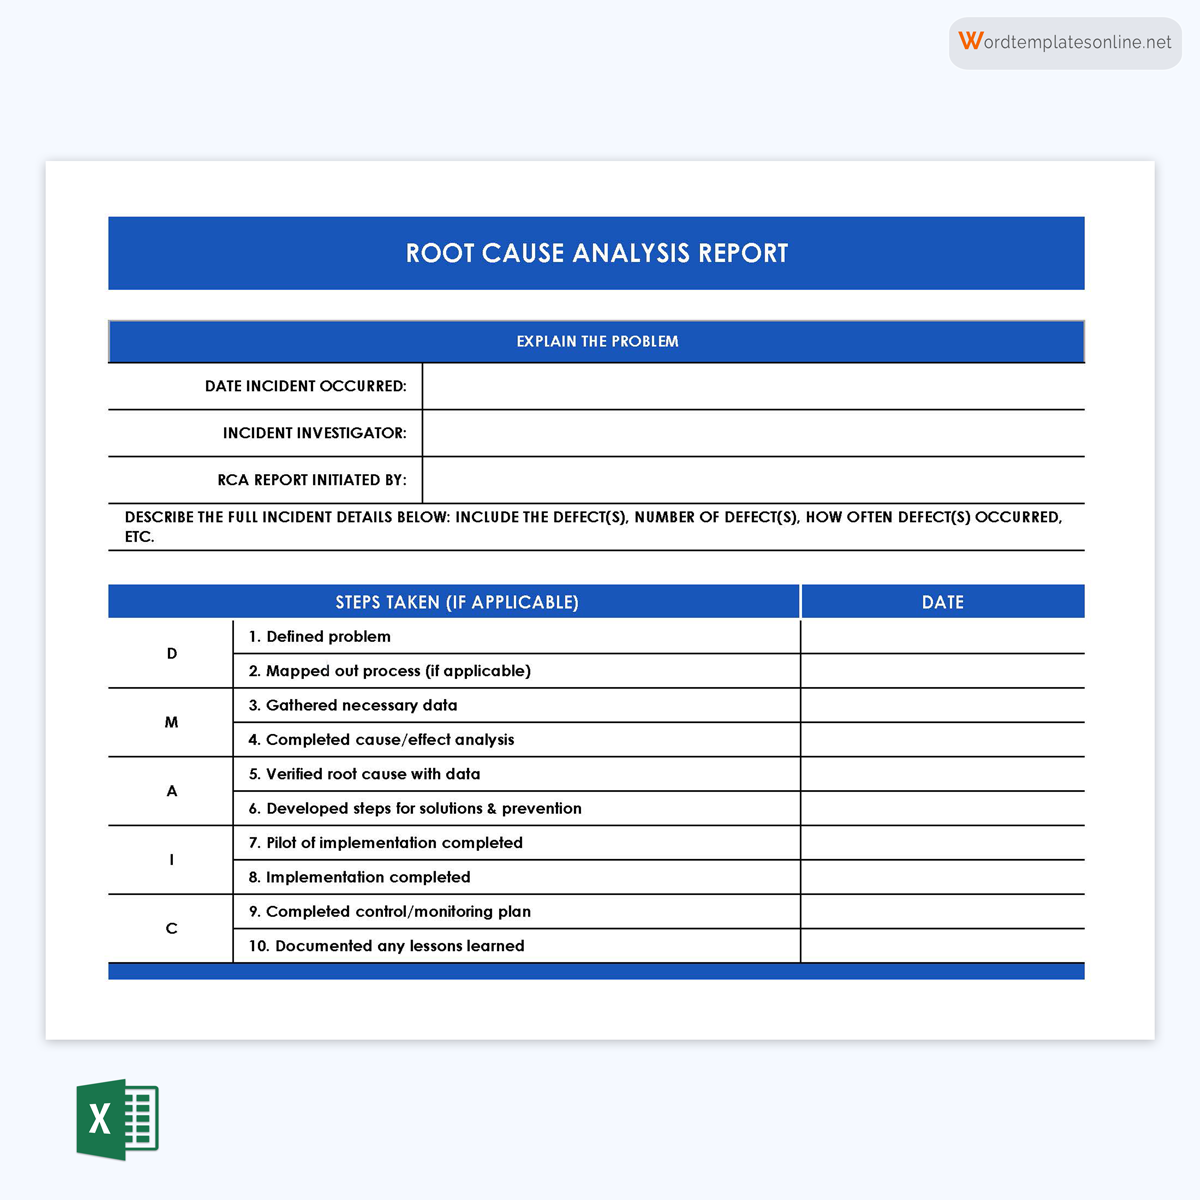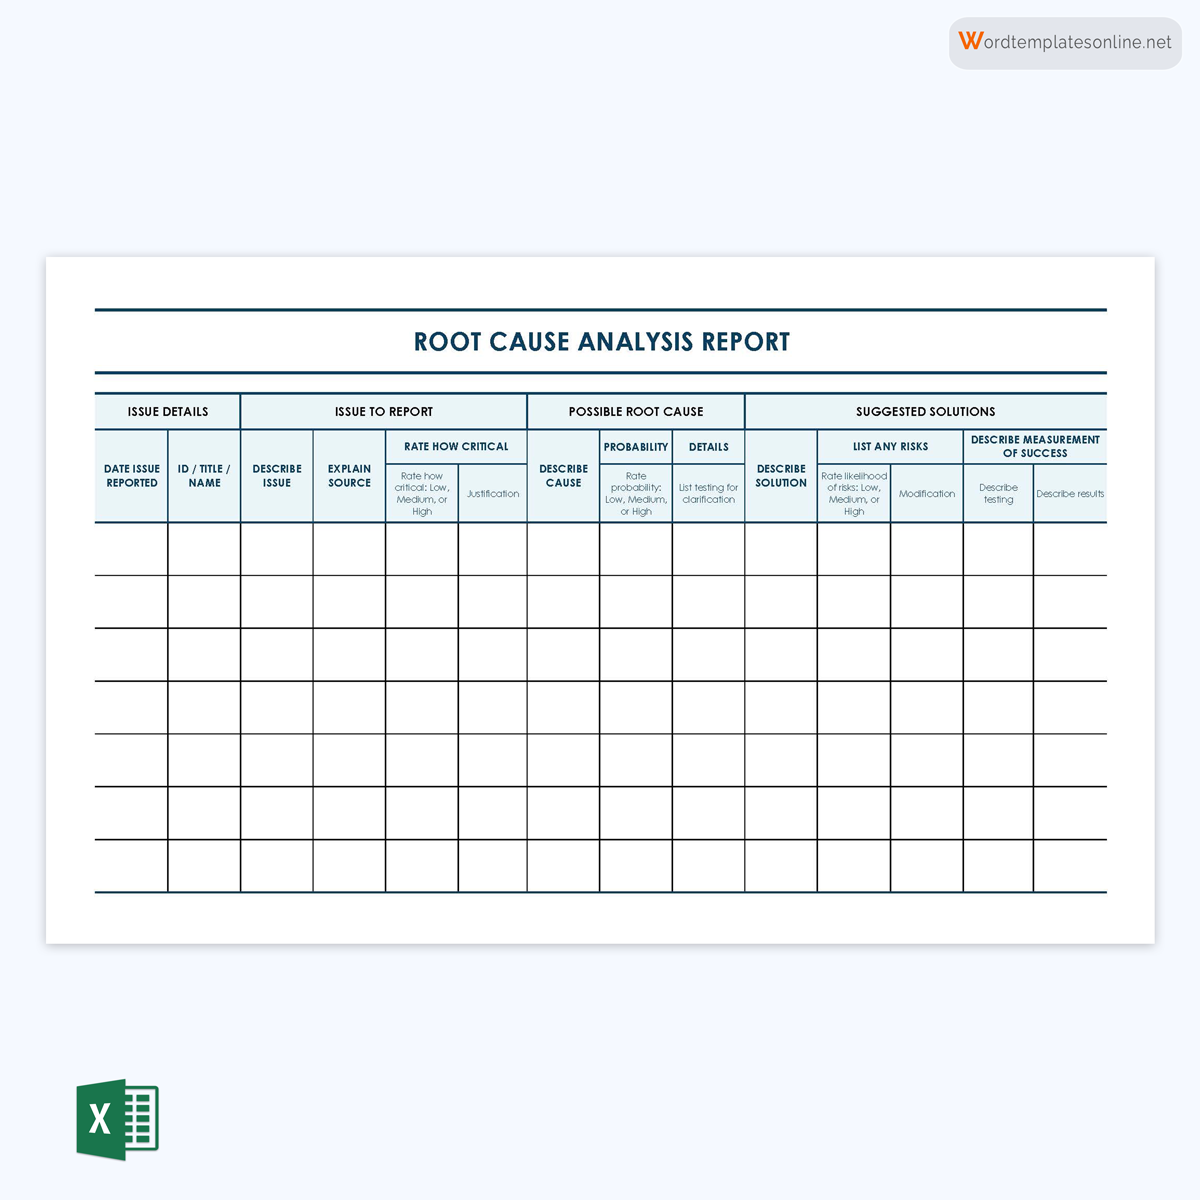
Root Cause Analysis Documentation Template is not just a form; it’s the roadmap that turns a chaotic problem into a structured solution. When I first tackled a recurring equipment failure at the manufacturing plant, the template became my lifeline. It guided me through data collection, analysis, and corrective action, turning frustration into a clear, repeatable process. In this post, I’ll walk you through how to build, use, and master a documentation template that keeps your team aligned, your reports consistent, and your solutions durable.
Why a Dedicated Template Matters
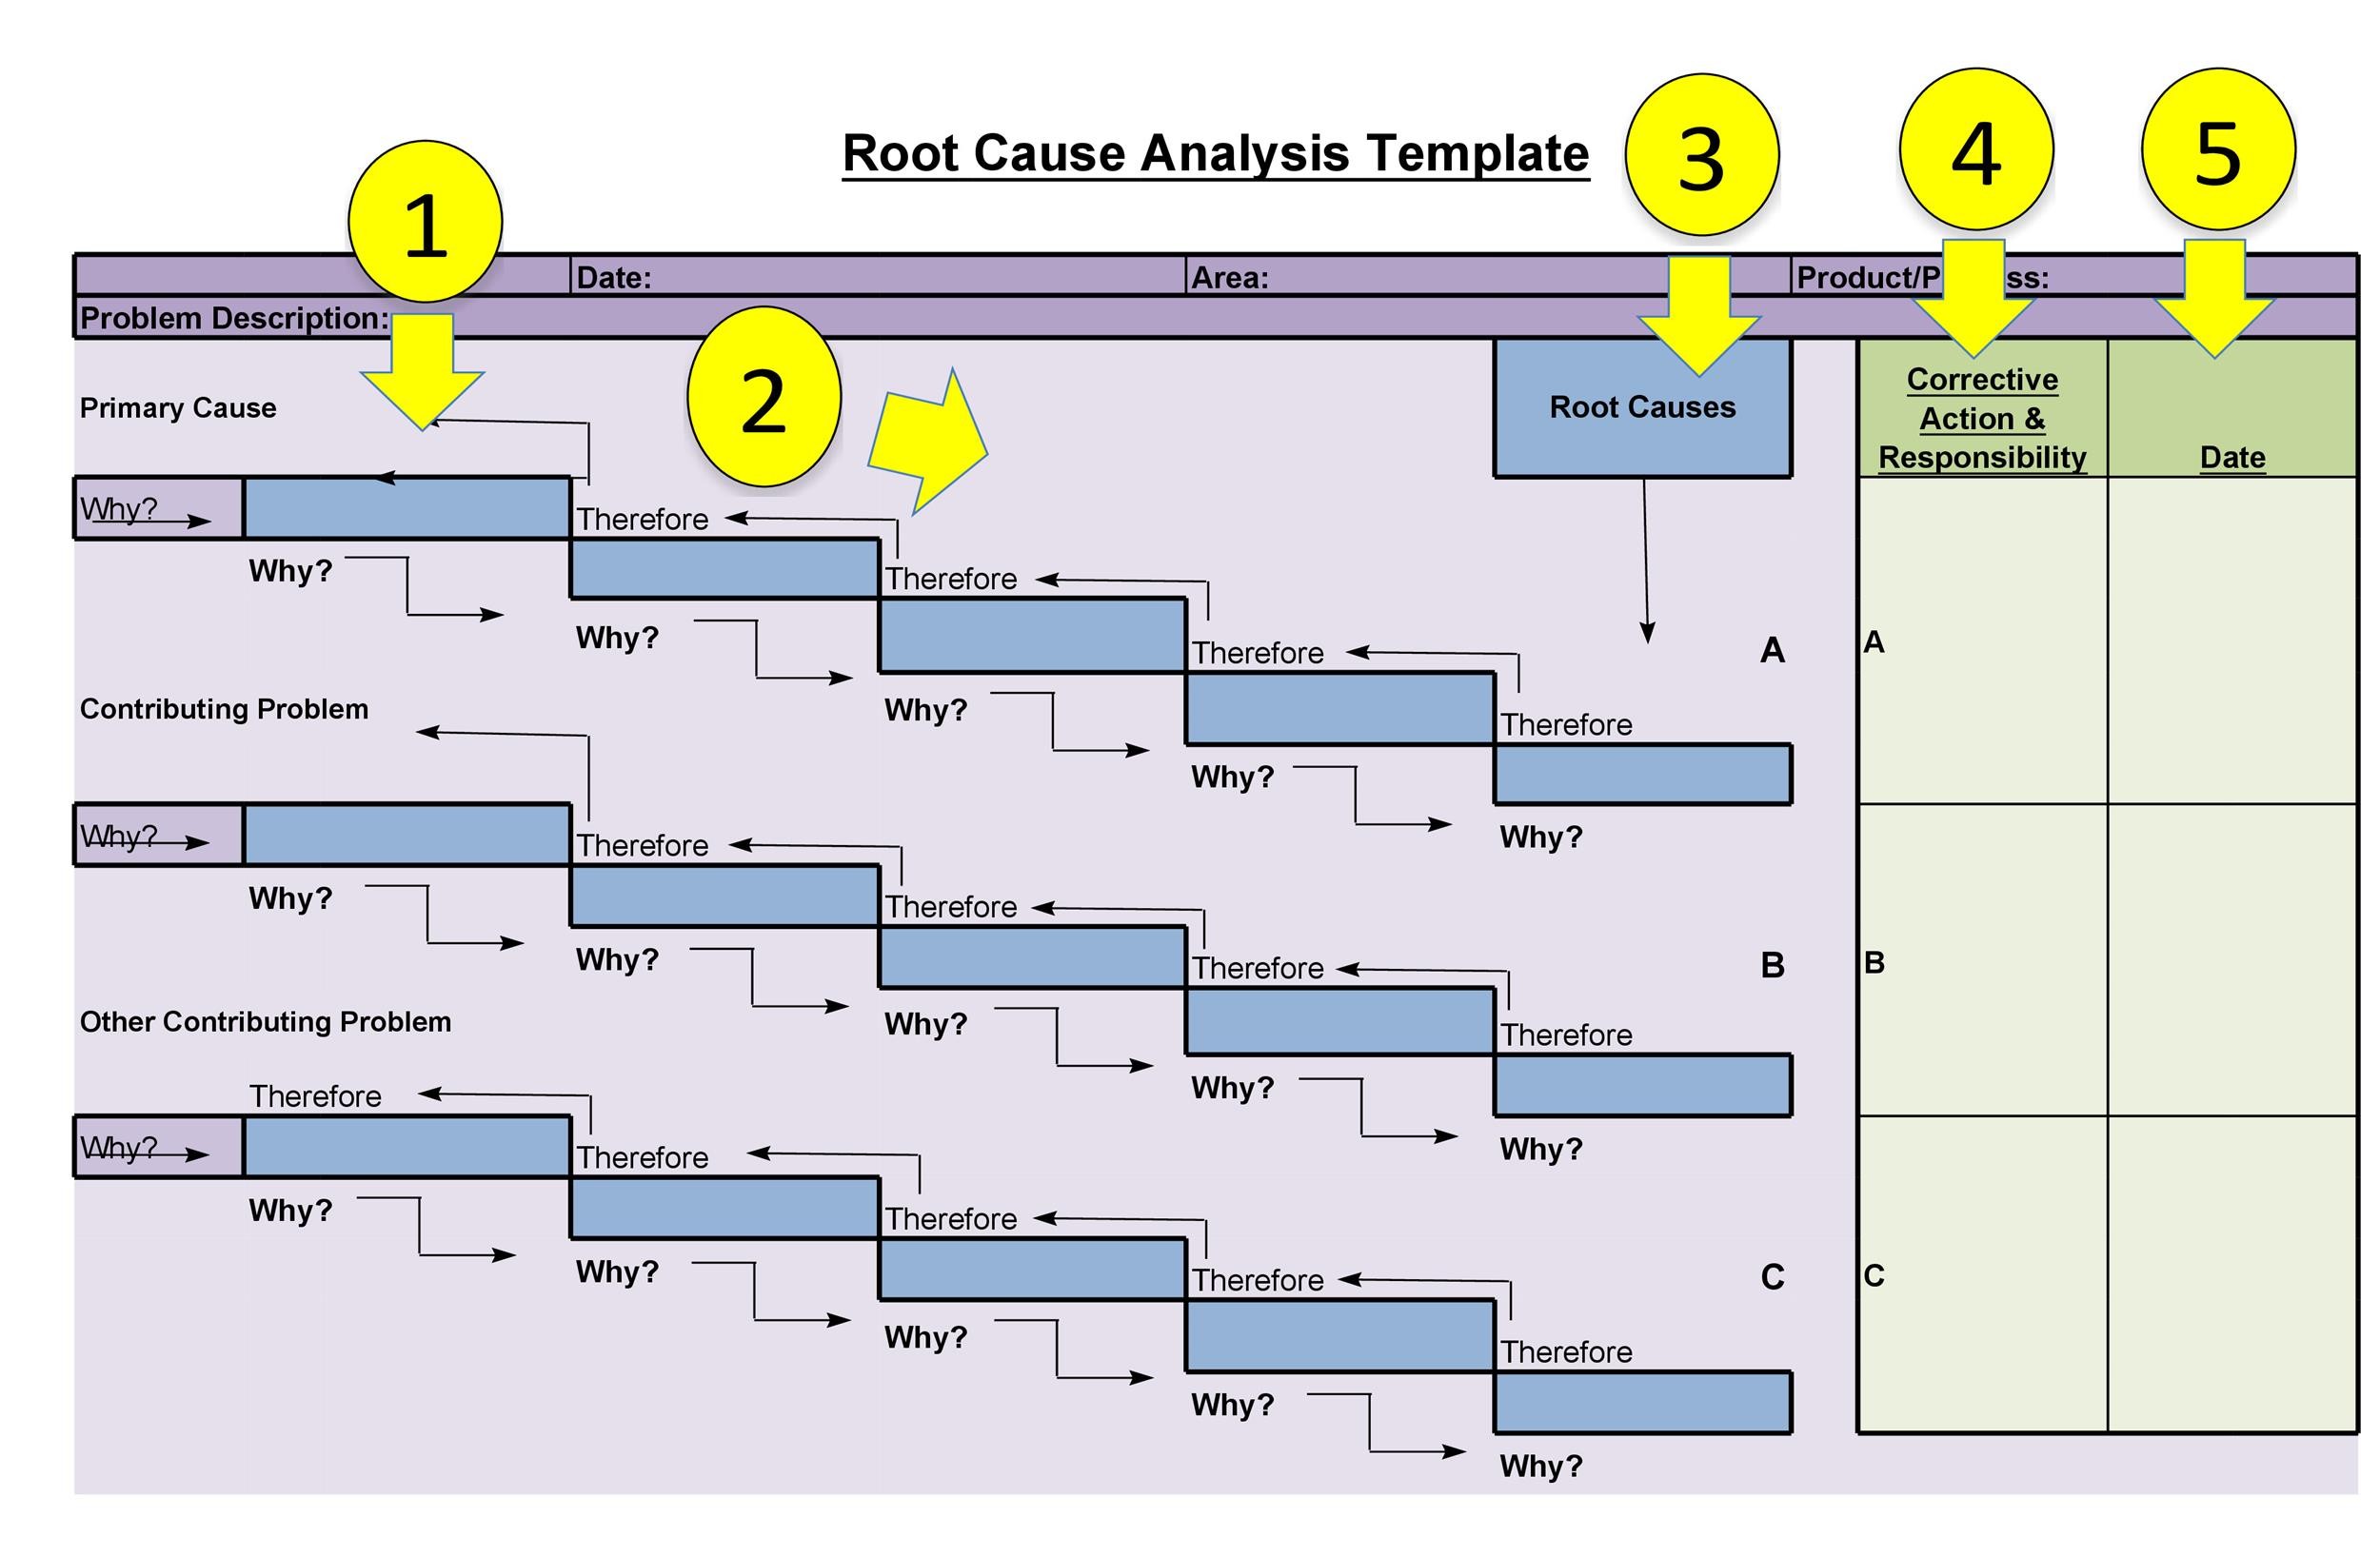
Without a consistent format, root cause investigations drift into a maze of ad‑hoc notes, incomplete evidence, and subjective conclusions. A well‑crafted template guarantees:
- Clarity: Everyone knows where to find what information.
- Completeness: Critical data points are never overlooked.
- Reusability: Past investigations inform new ones, building institutional knowledge.
- Compliance: Regulatory bodies often require documented RCA procedures.
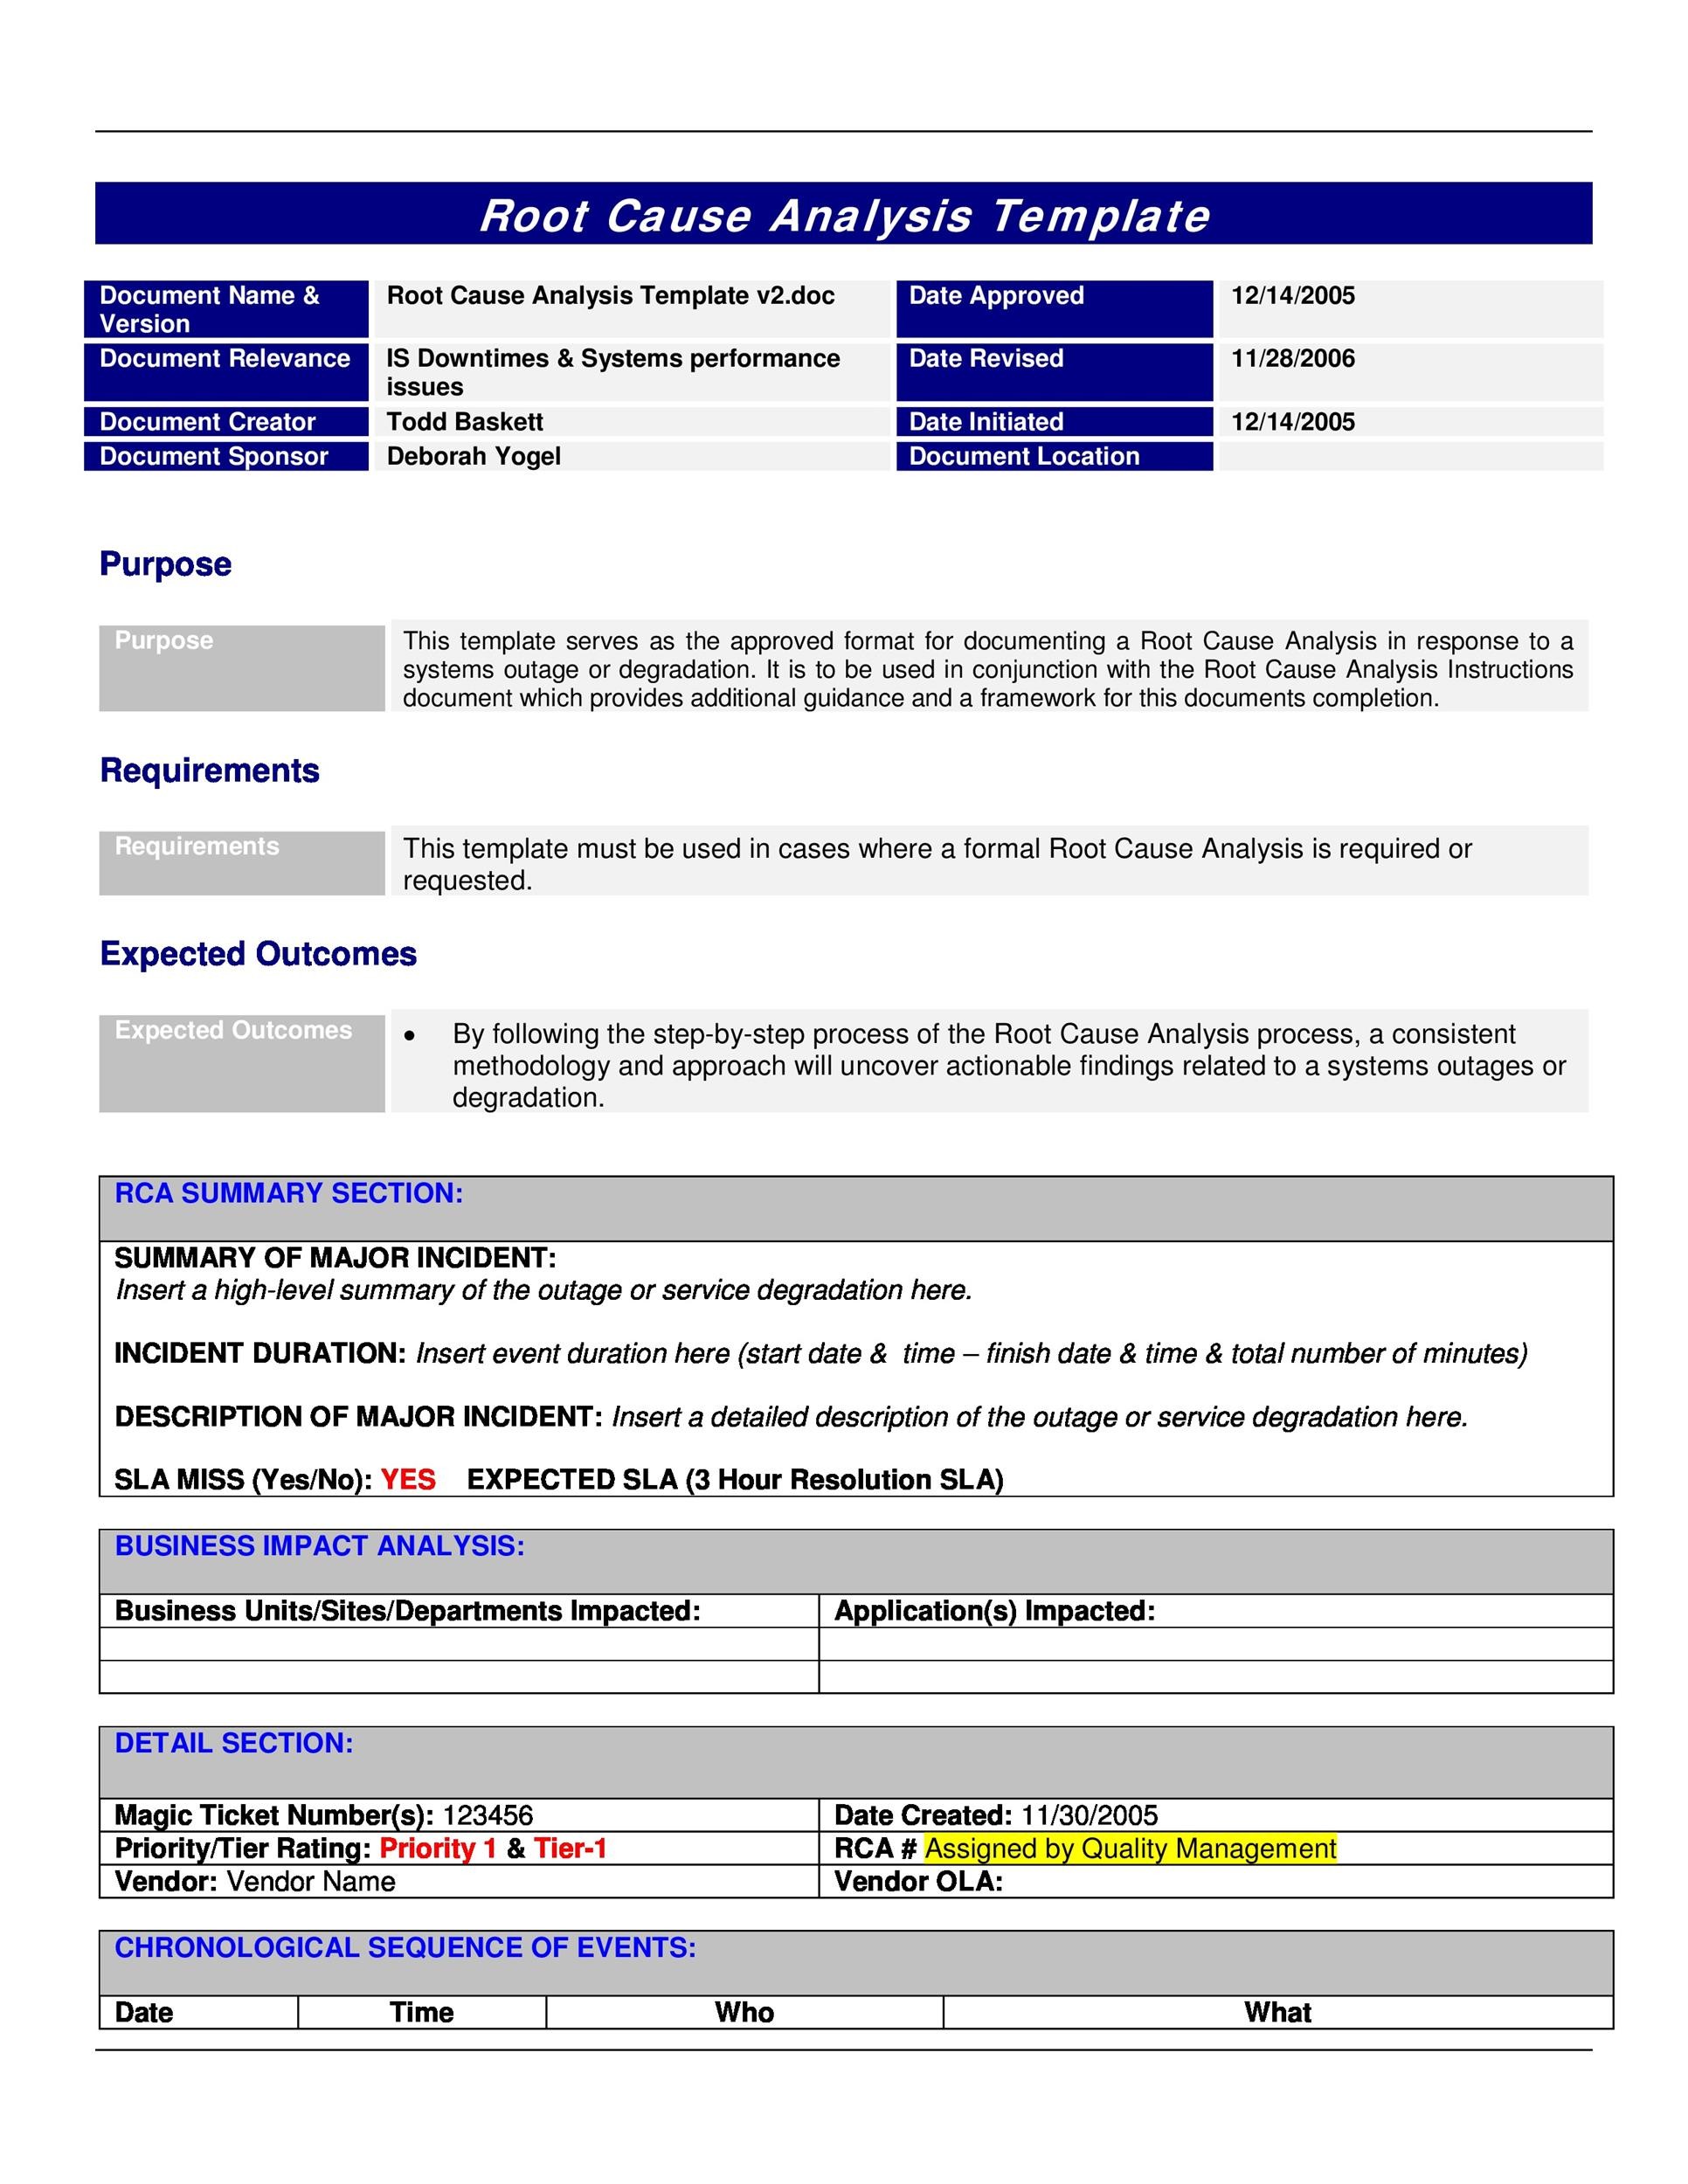
Key Sections of the Template
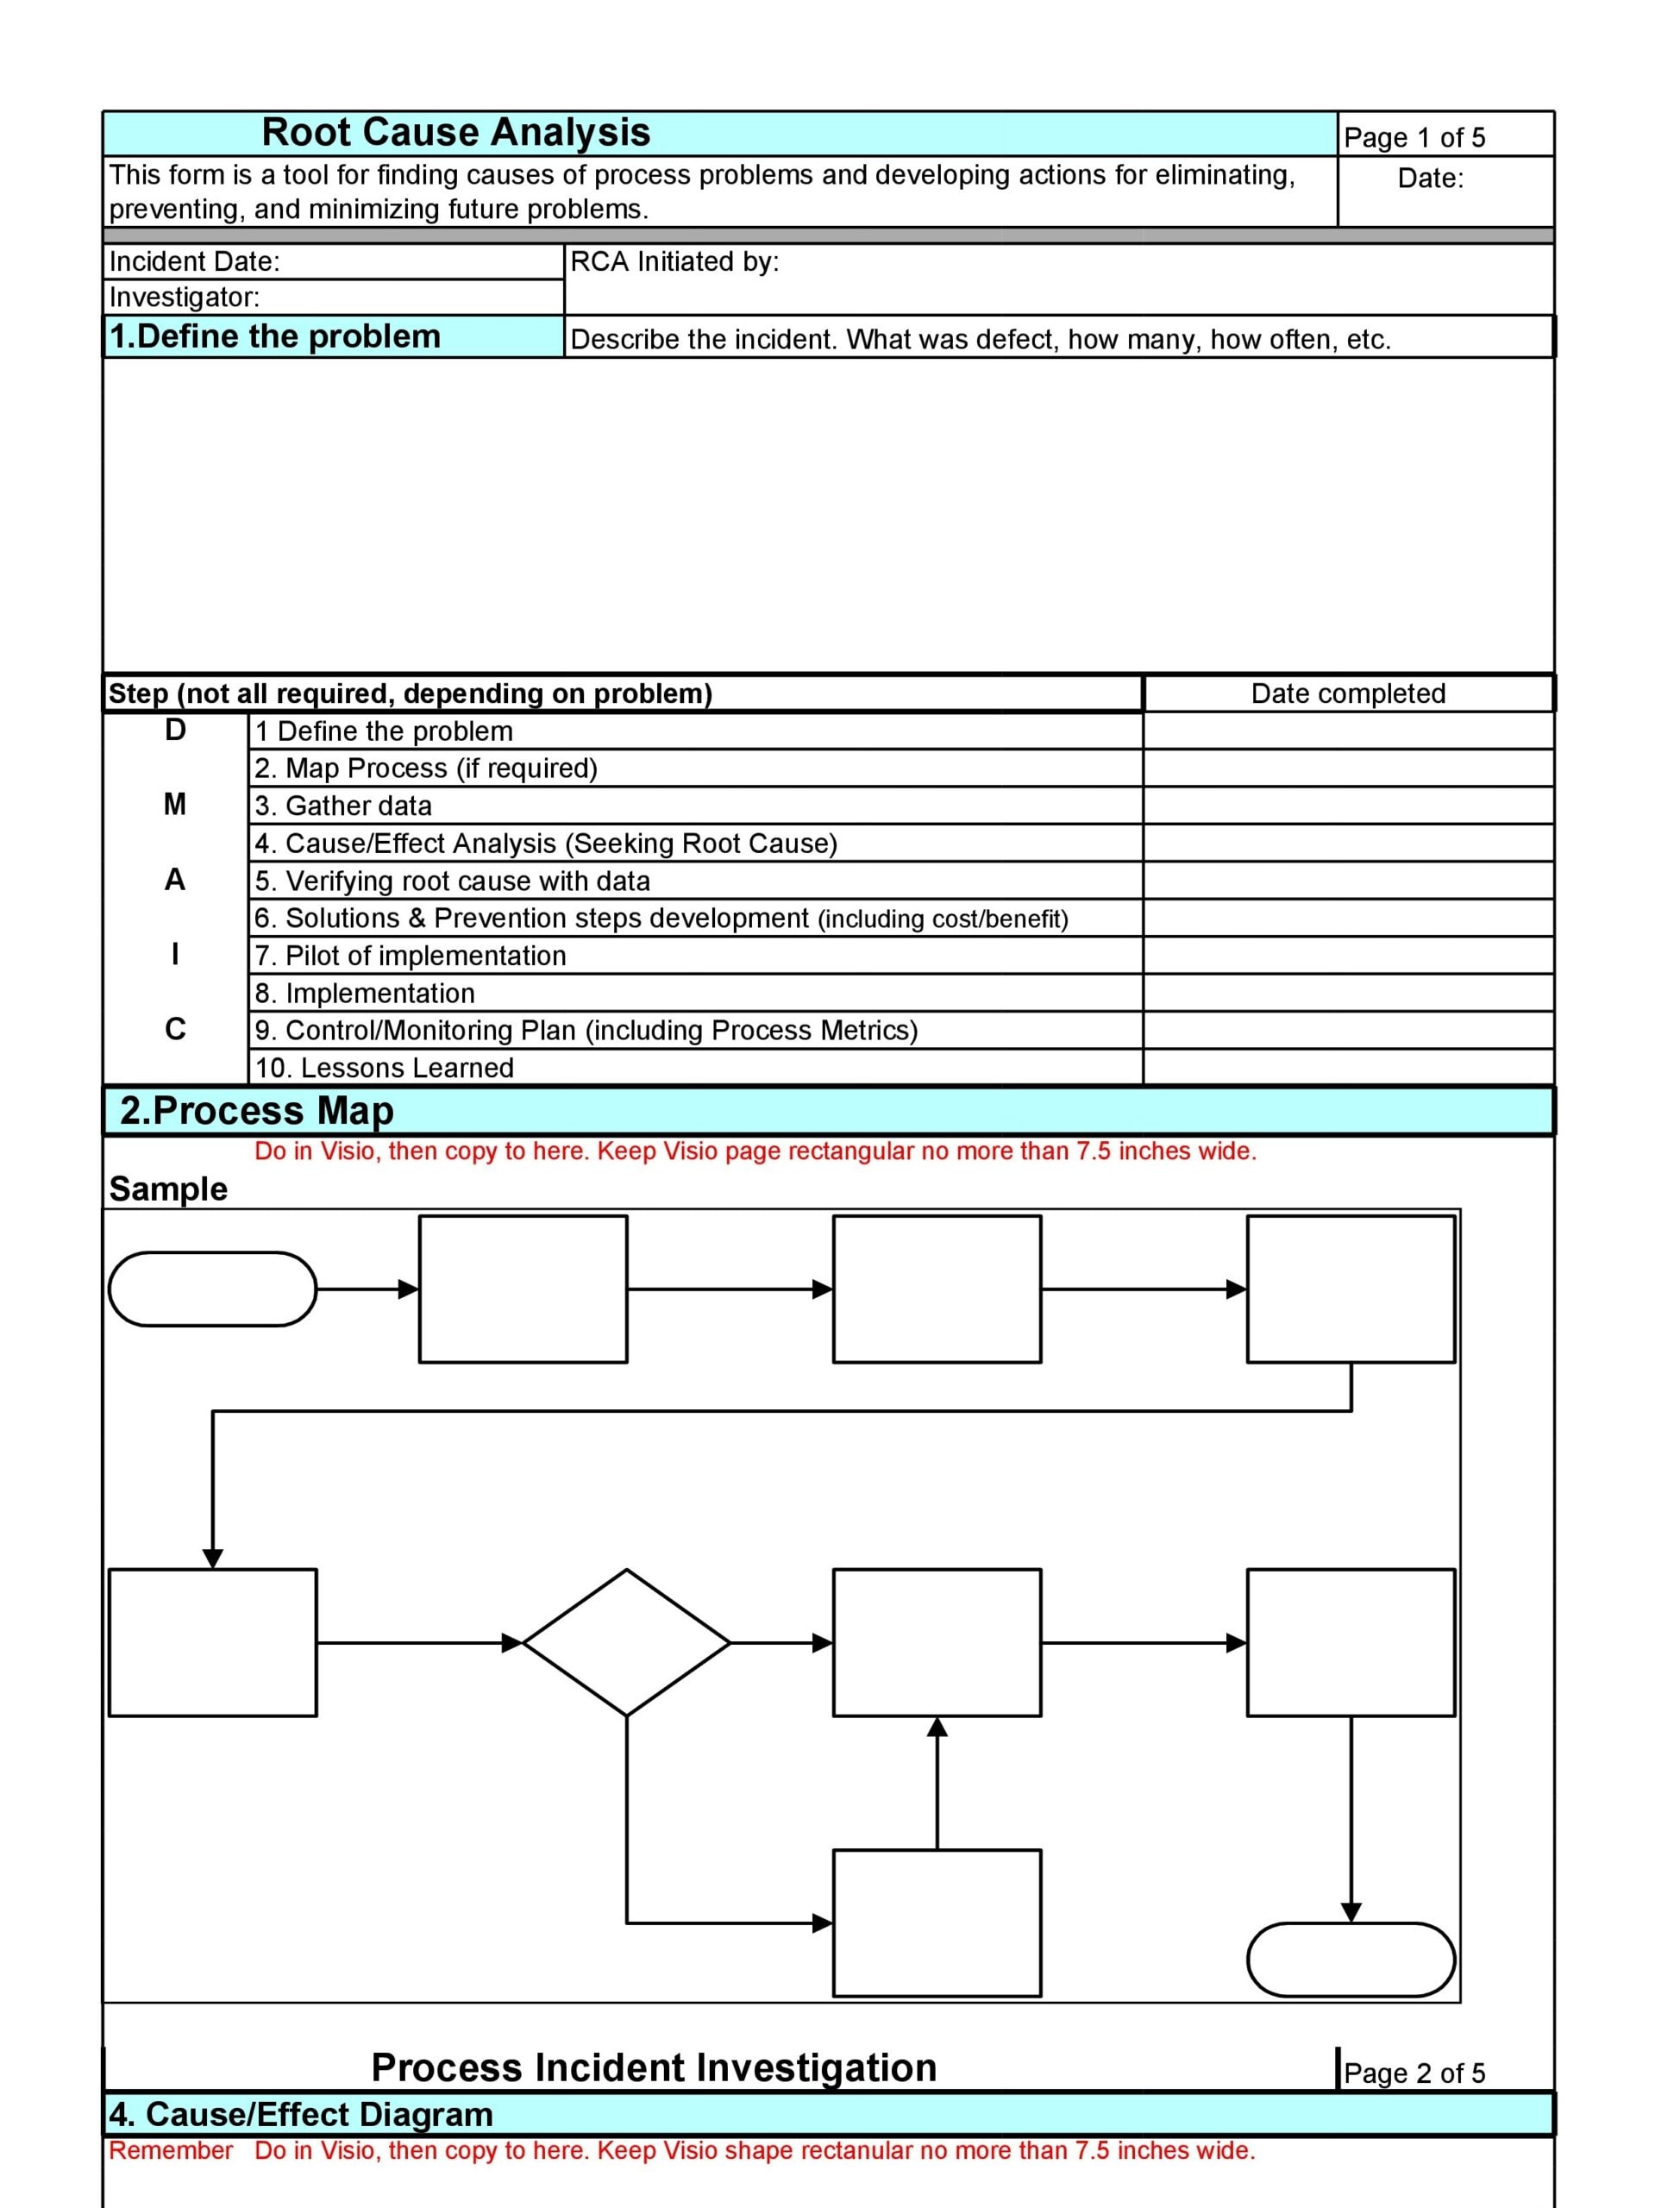
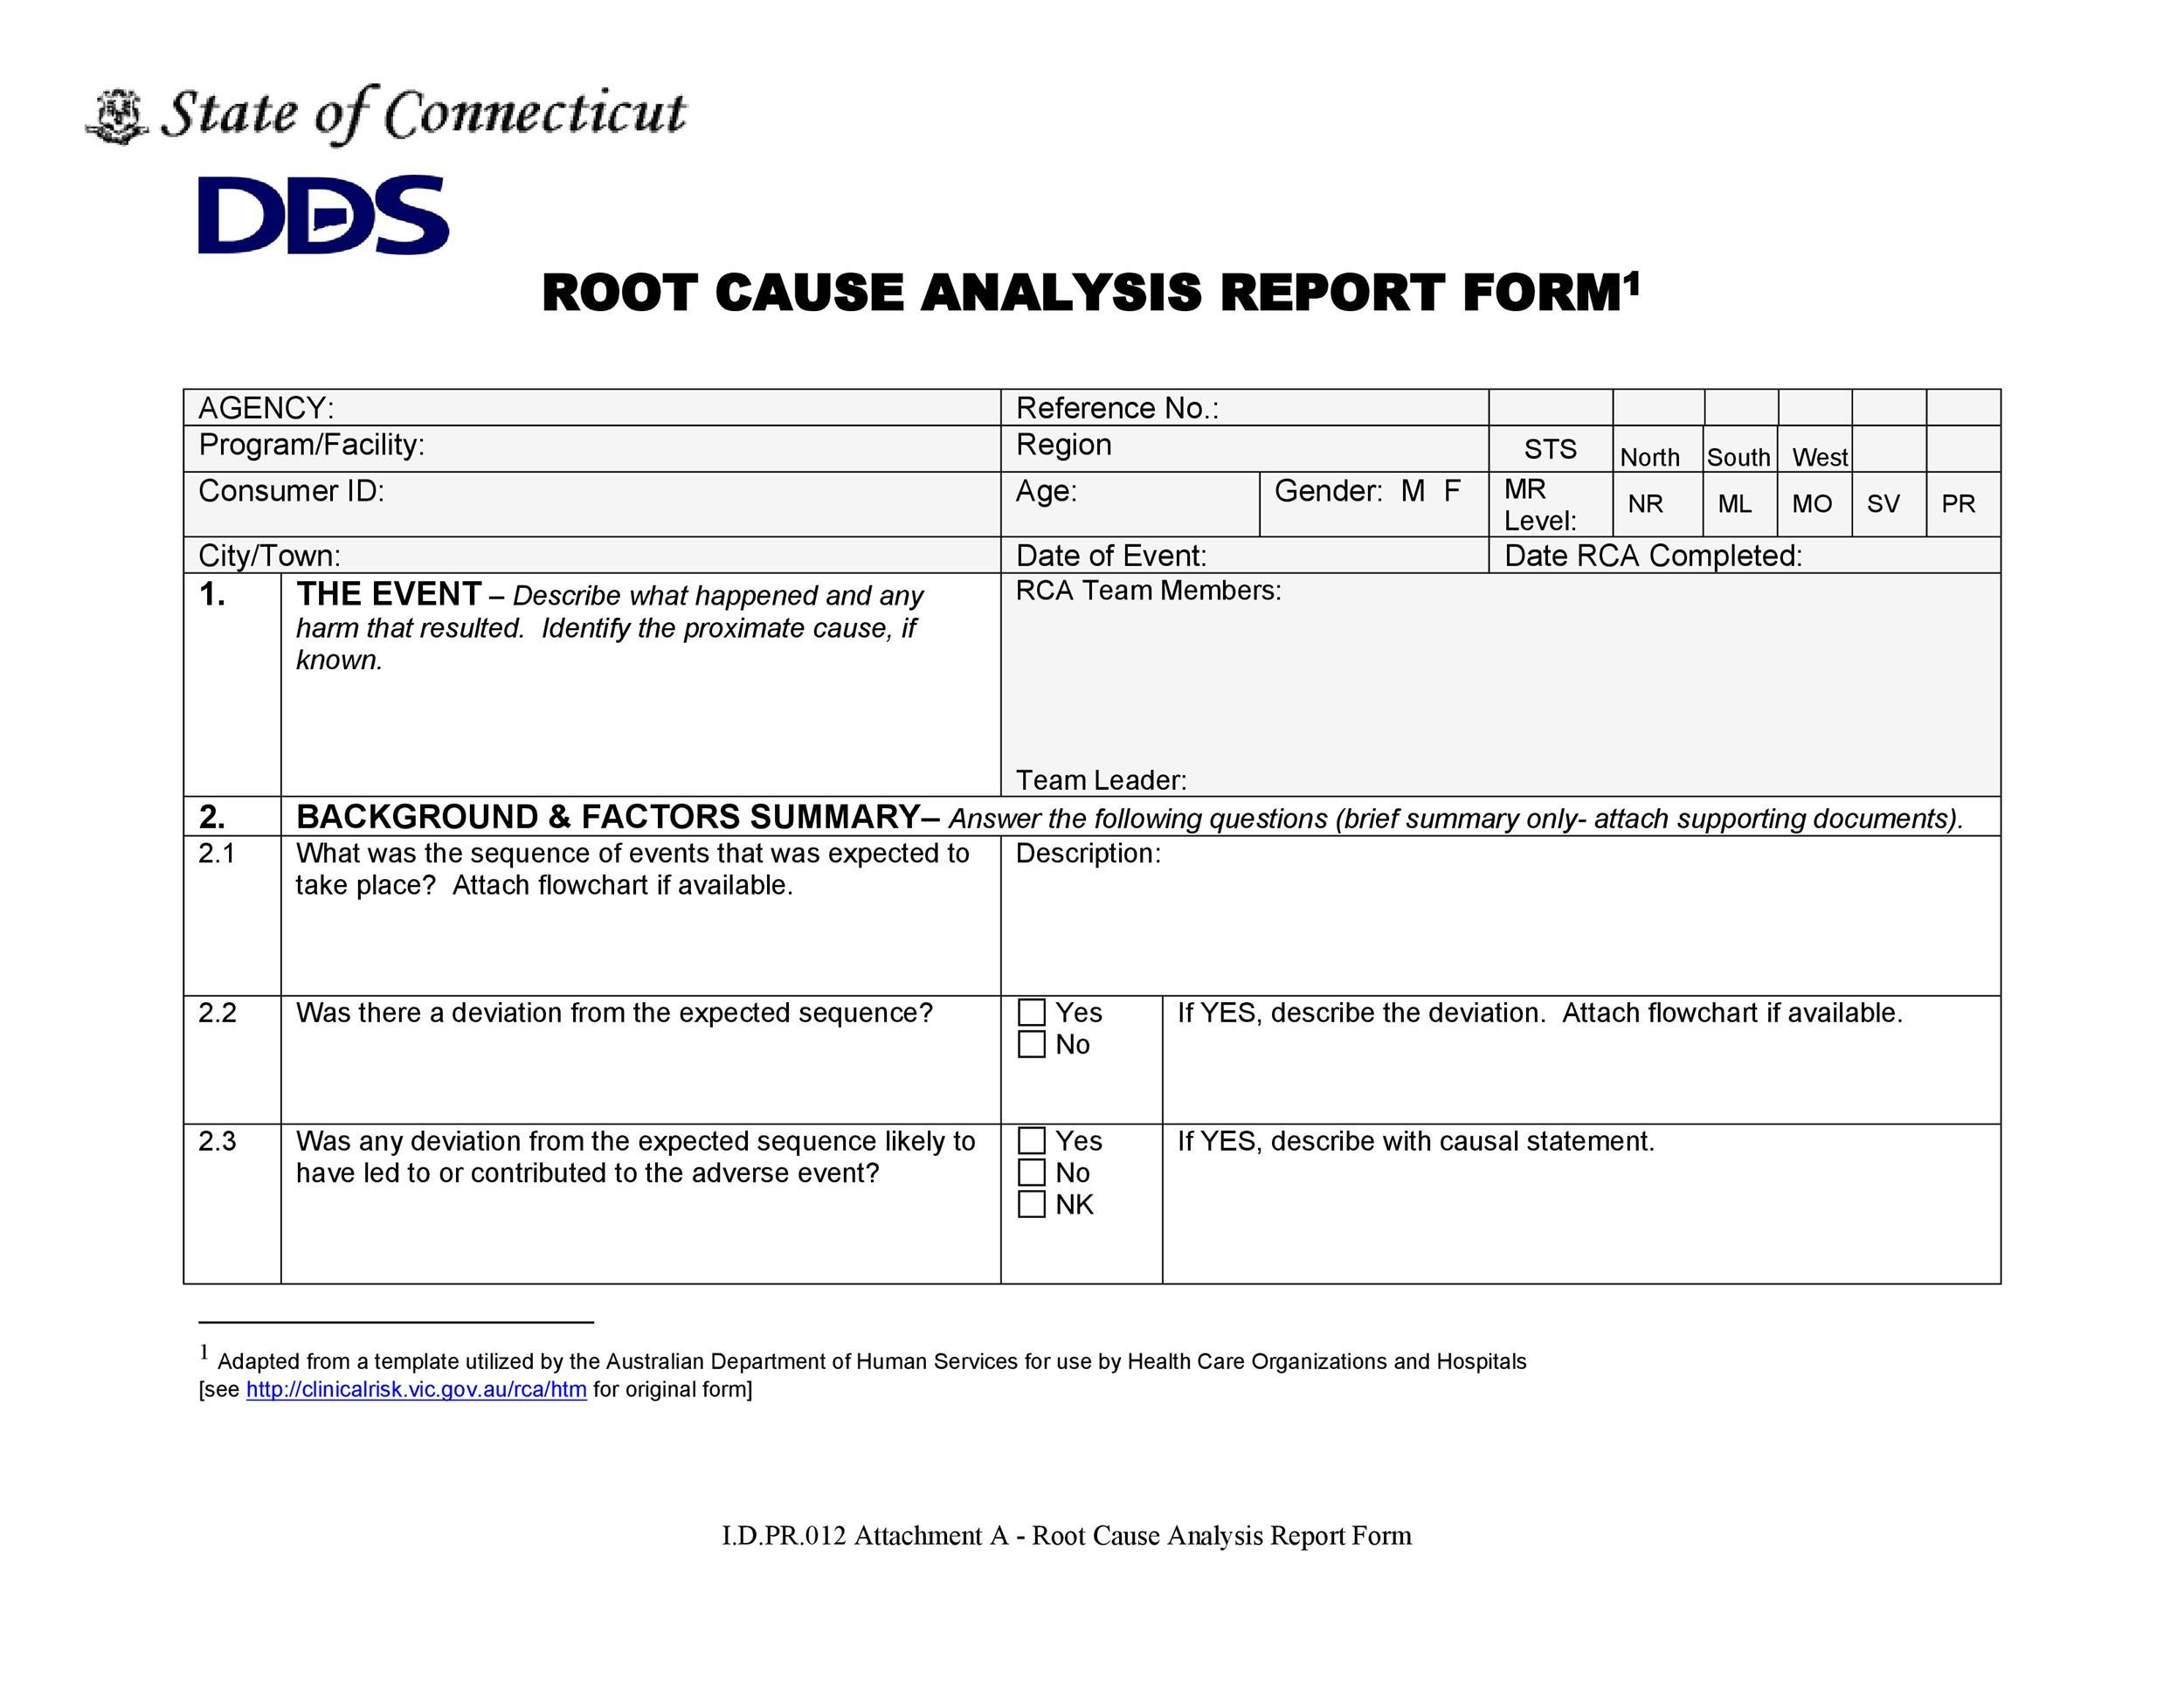
1. Incident Overview
This opening block captures the who, what, when, and where. Keep it concise yet informative.
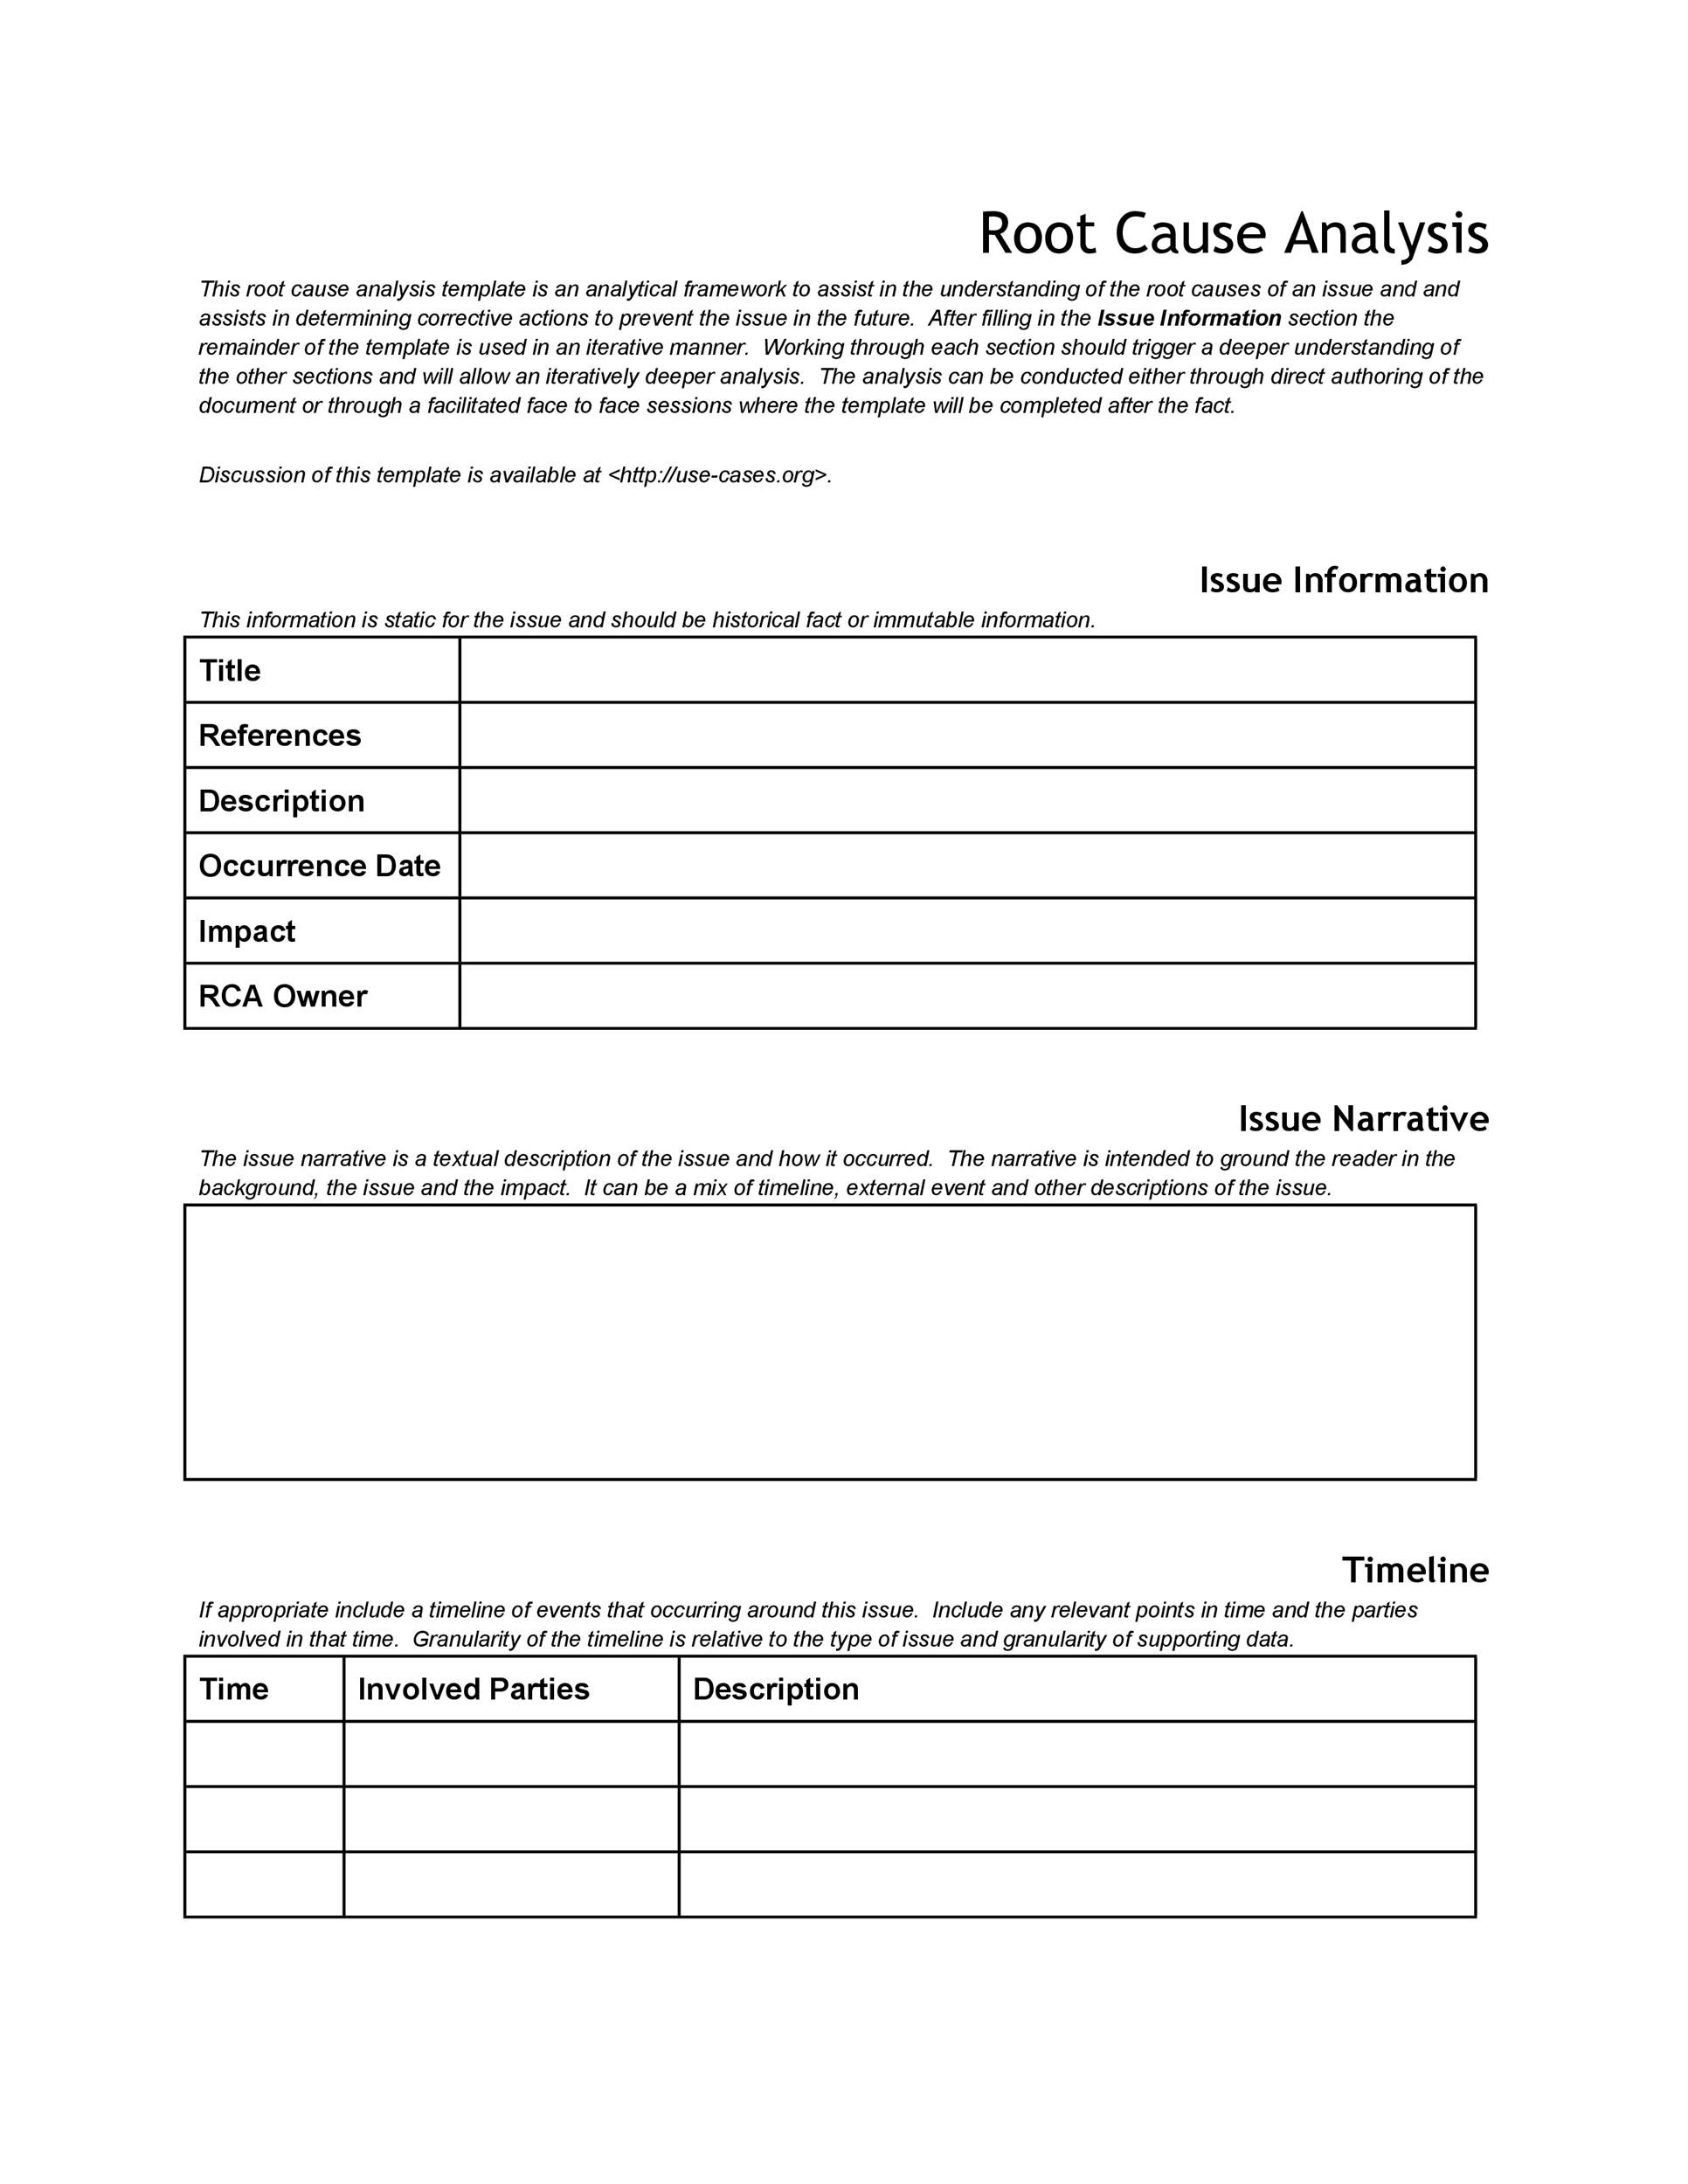
- Incident ID: A unique alphanumeric code.
- Date & Time: Exact timestamps.
- Location: Facility, department, or machine number.
- Reported By: Name and role of the initial reporter.
- Incident Description: A brief narrative of the event.
2. Evidence Collection
Data is the lifeblood of RCA. Structure this section to capture all relevant evidence in a reproducible way.
- Photographs & Videos: Embed clear images of the problem.
- Sensor Readings: Log raw data from machines.
- Maintenance Records: Recent service history.
- Operator Notes: Shift logs or hand‑written observations.
- External Factors: Weather, supply chain disruptions, or third‑party inputs.
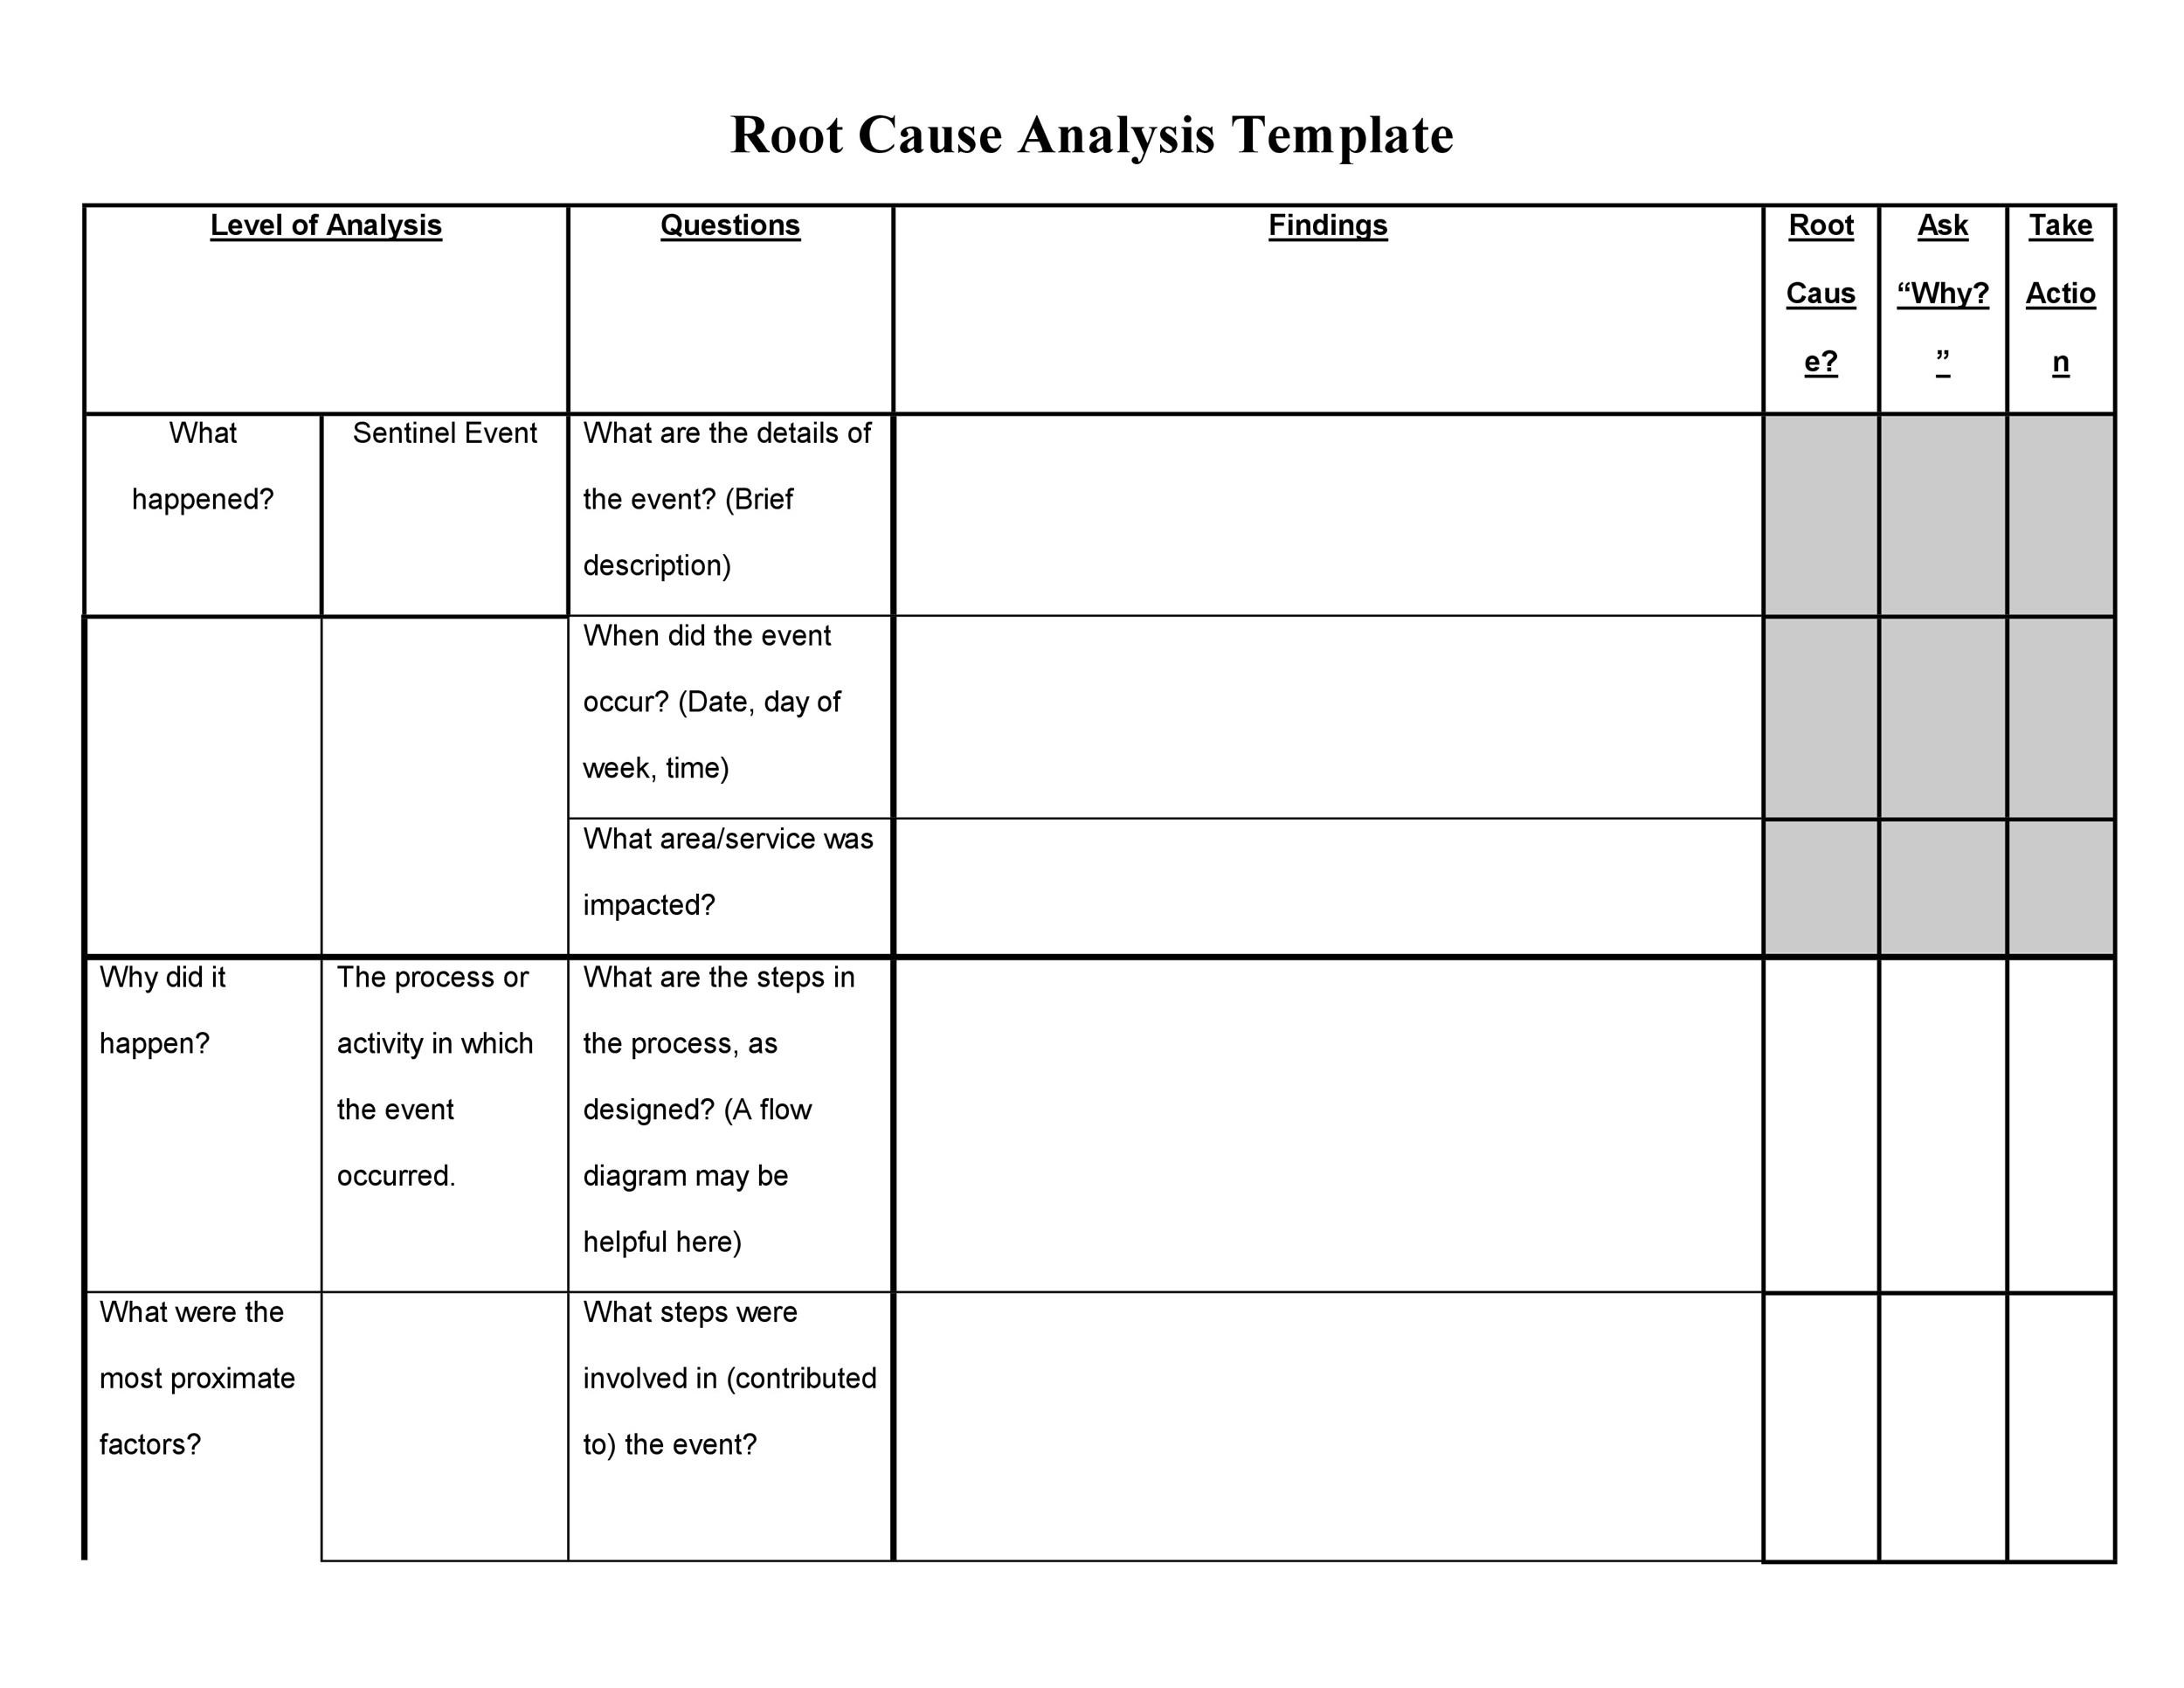
3. Analysis Methodology
Specify the analytical tools you’ll use. Common choices include:
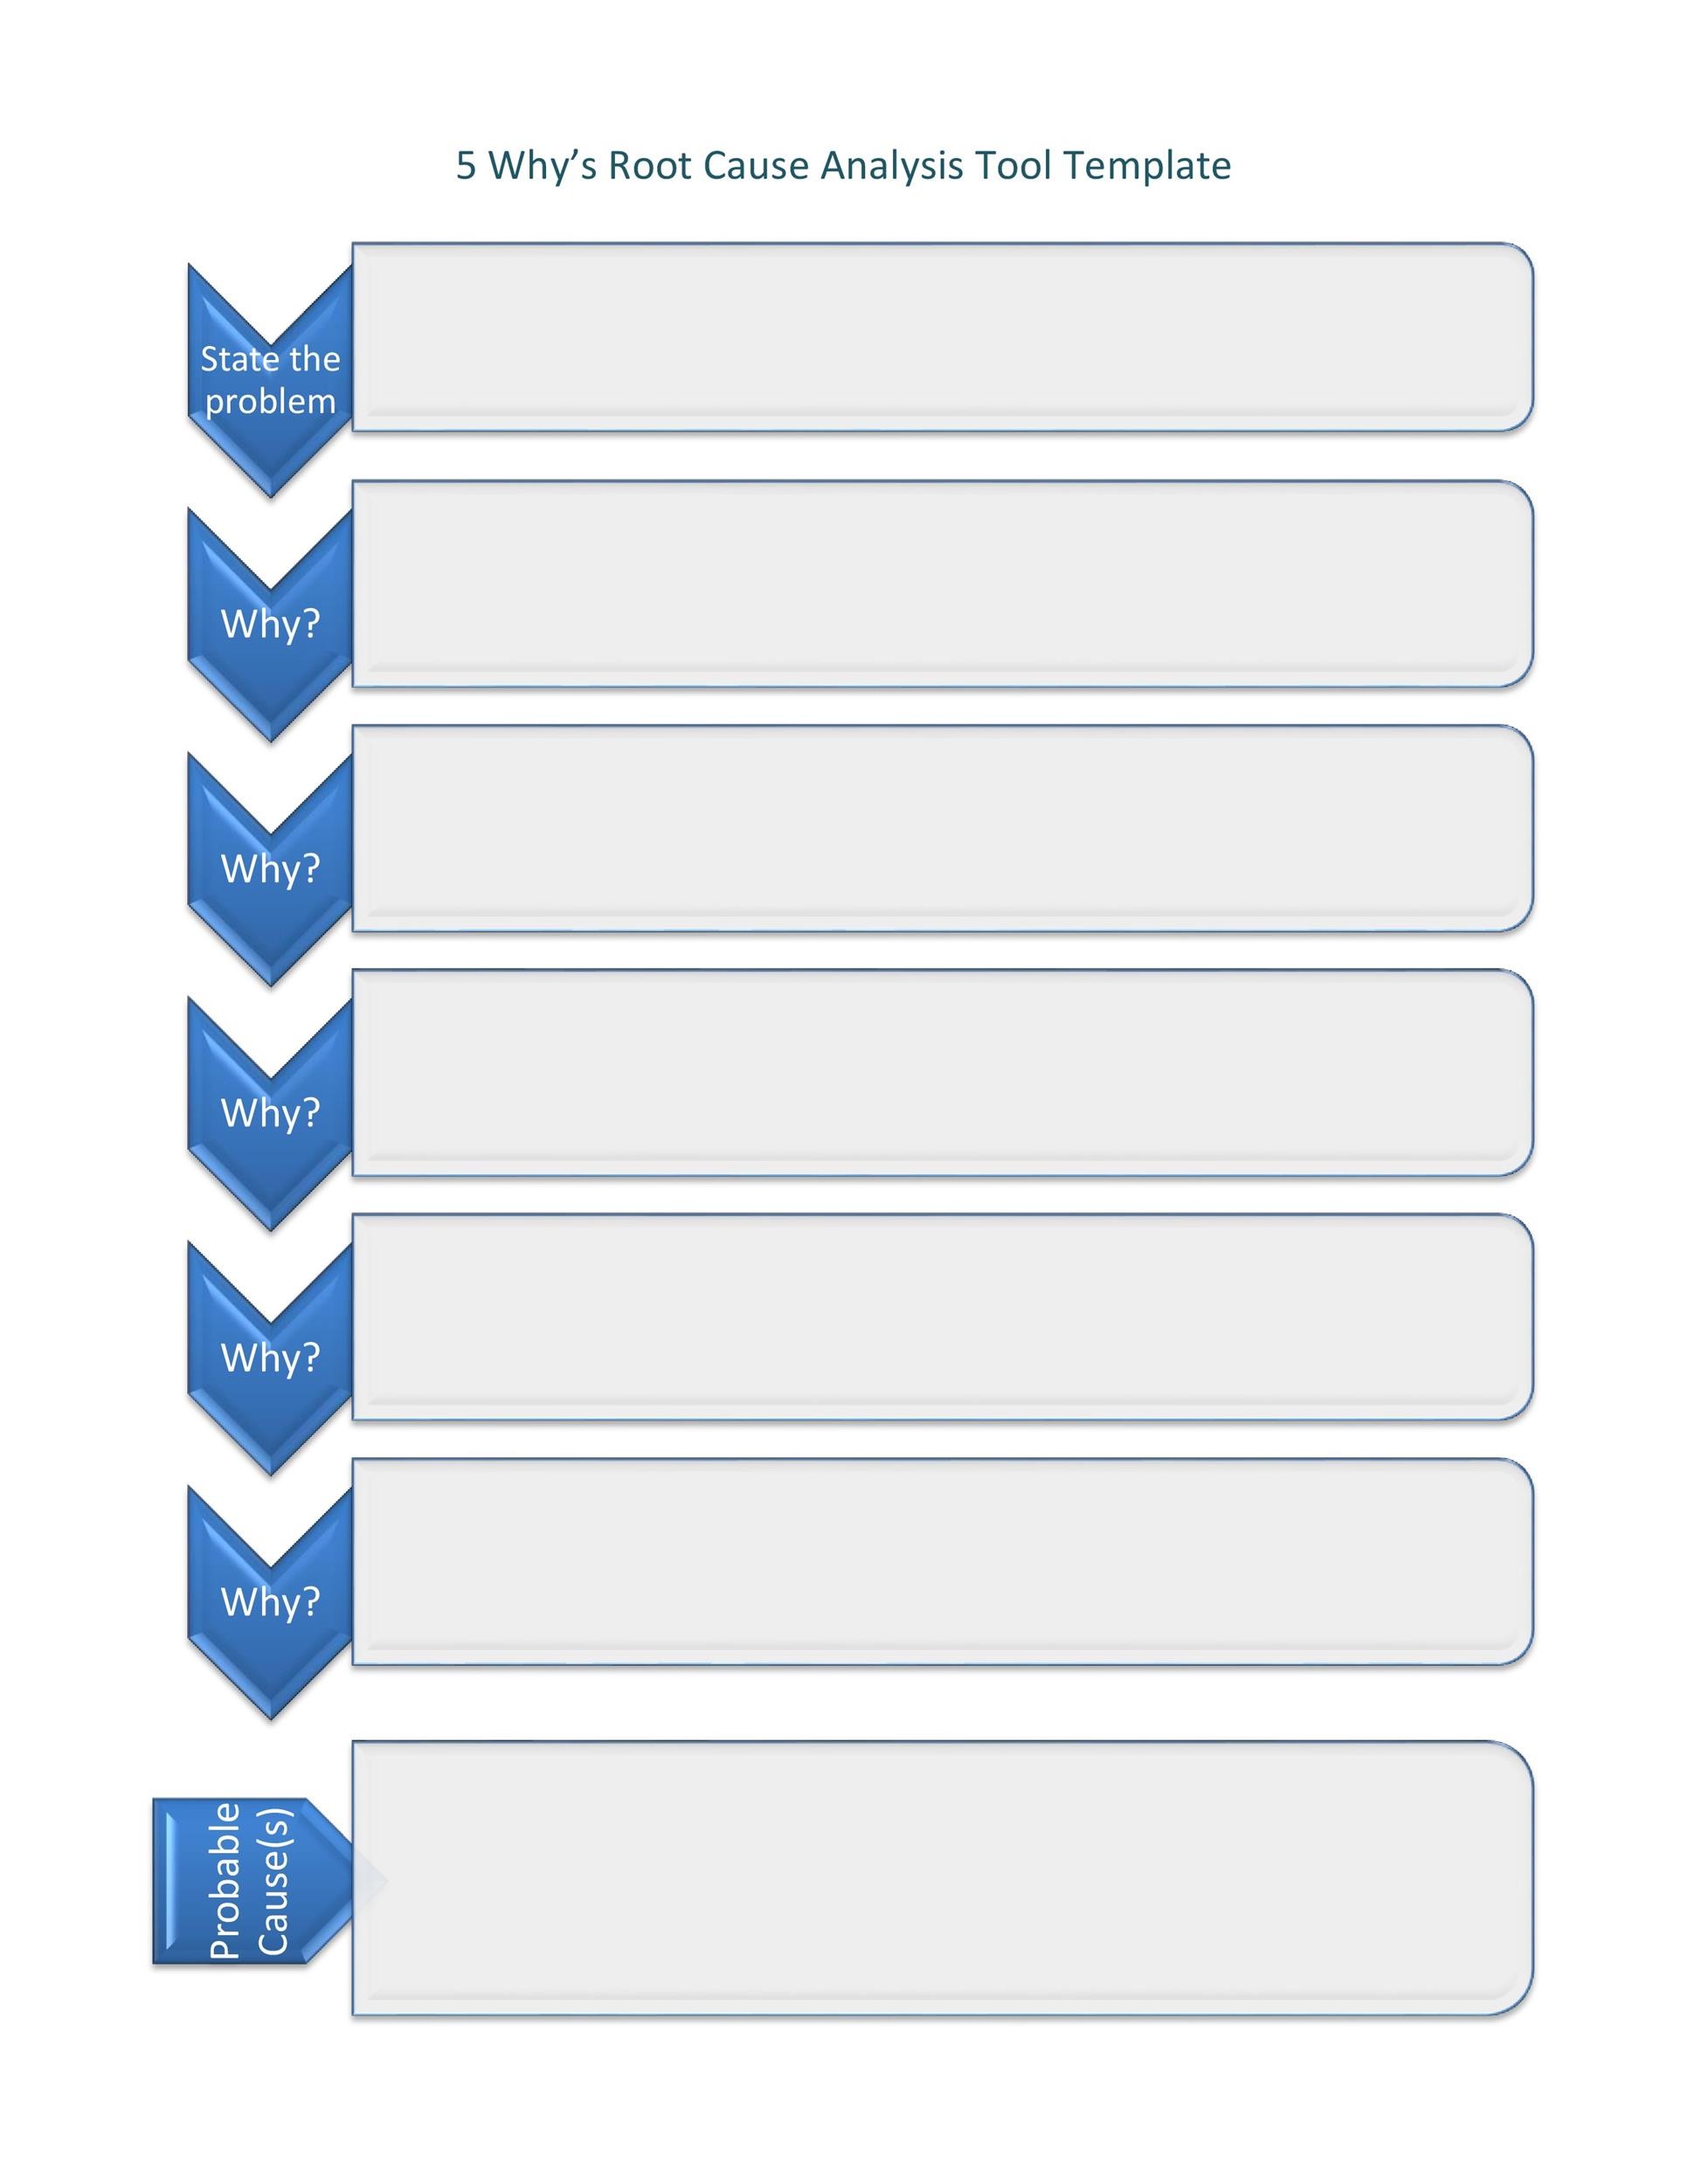
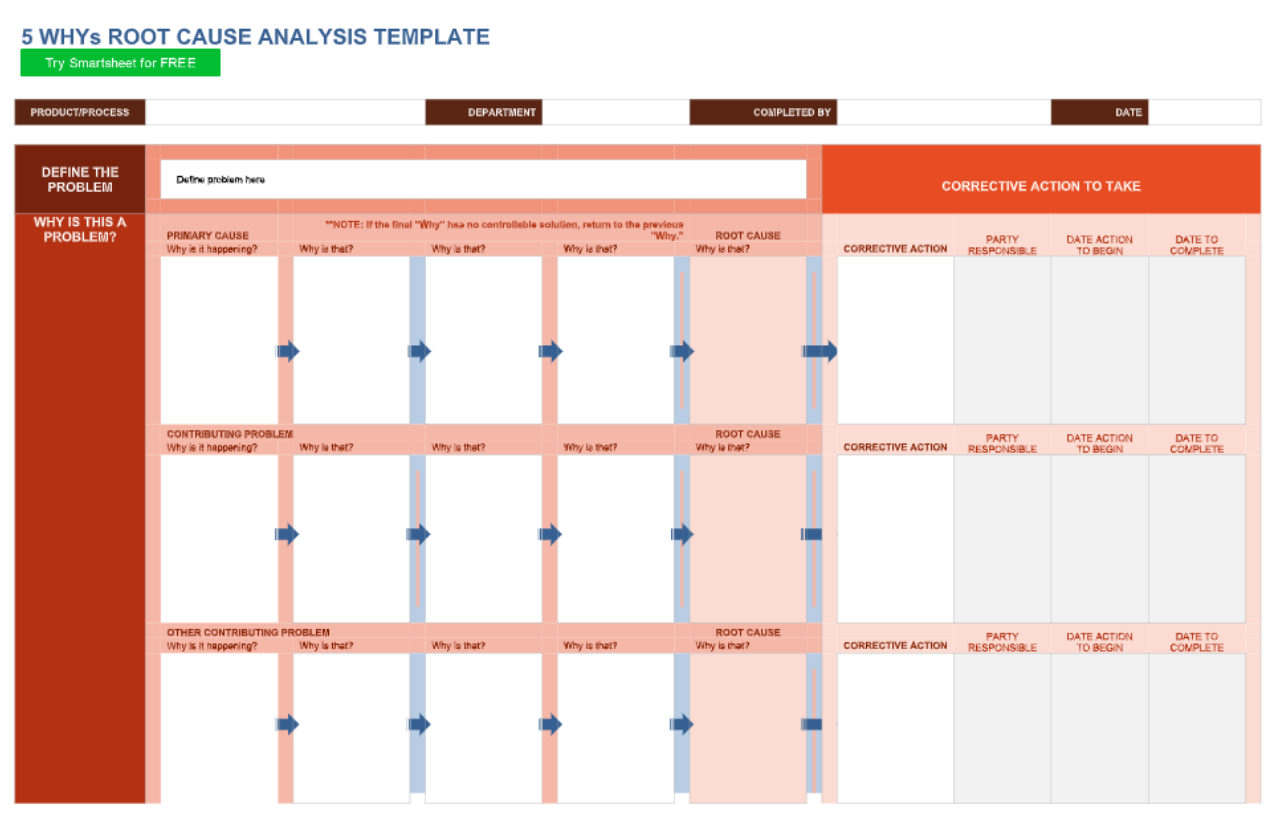
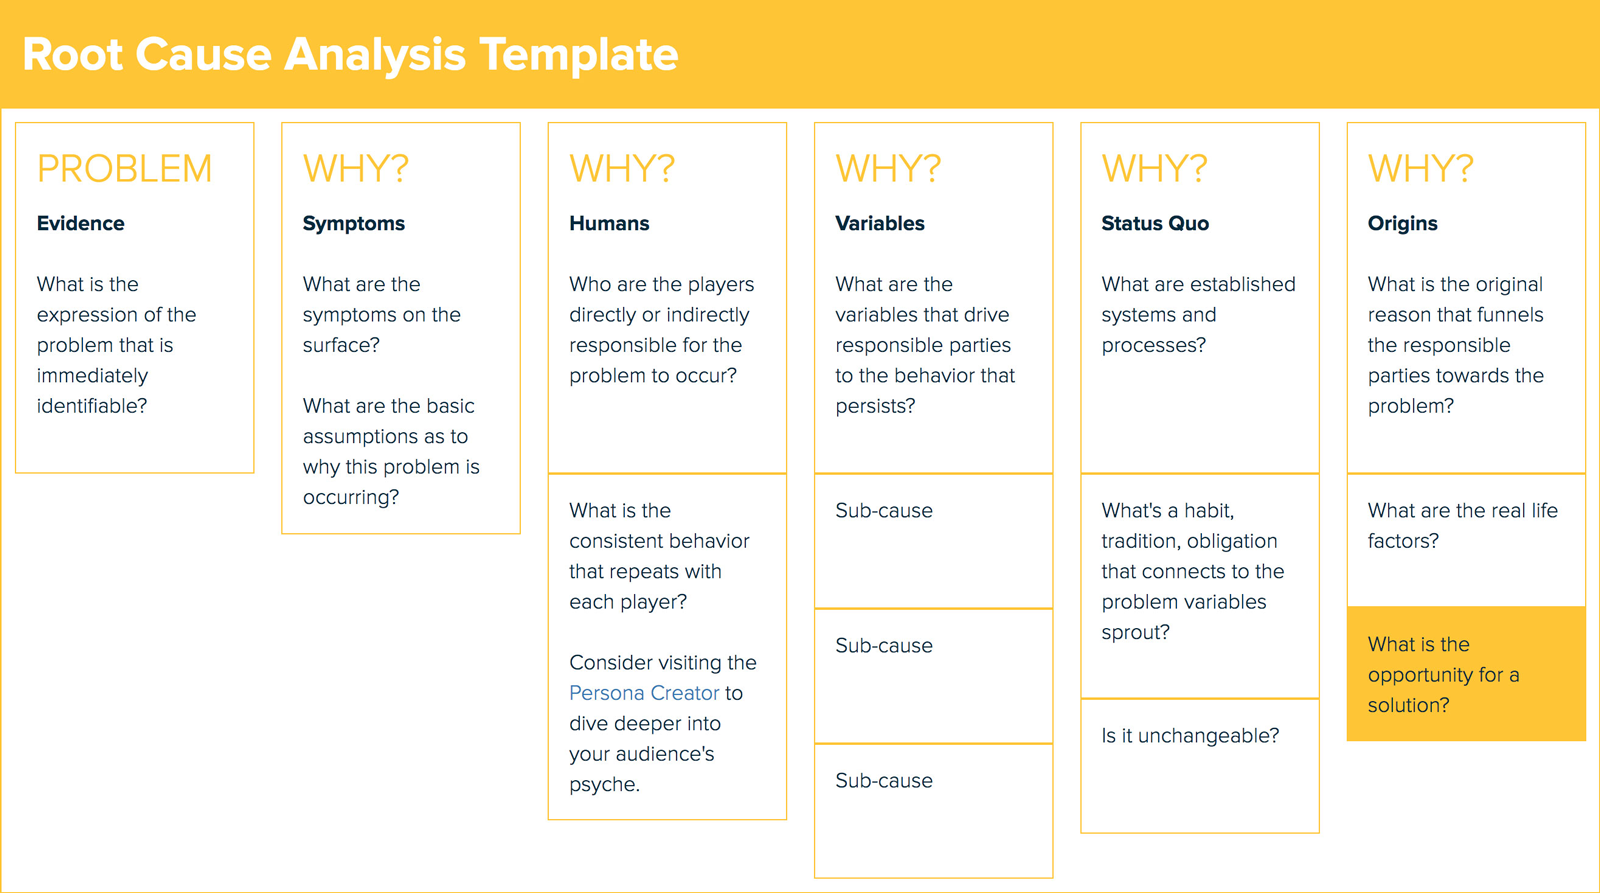
- 5 Whys: Ask “why” repeatedly until the root causes surface.
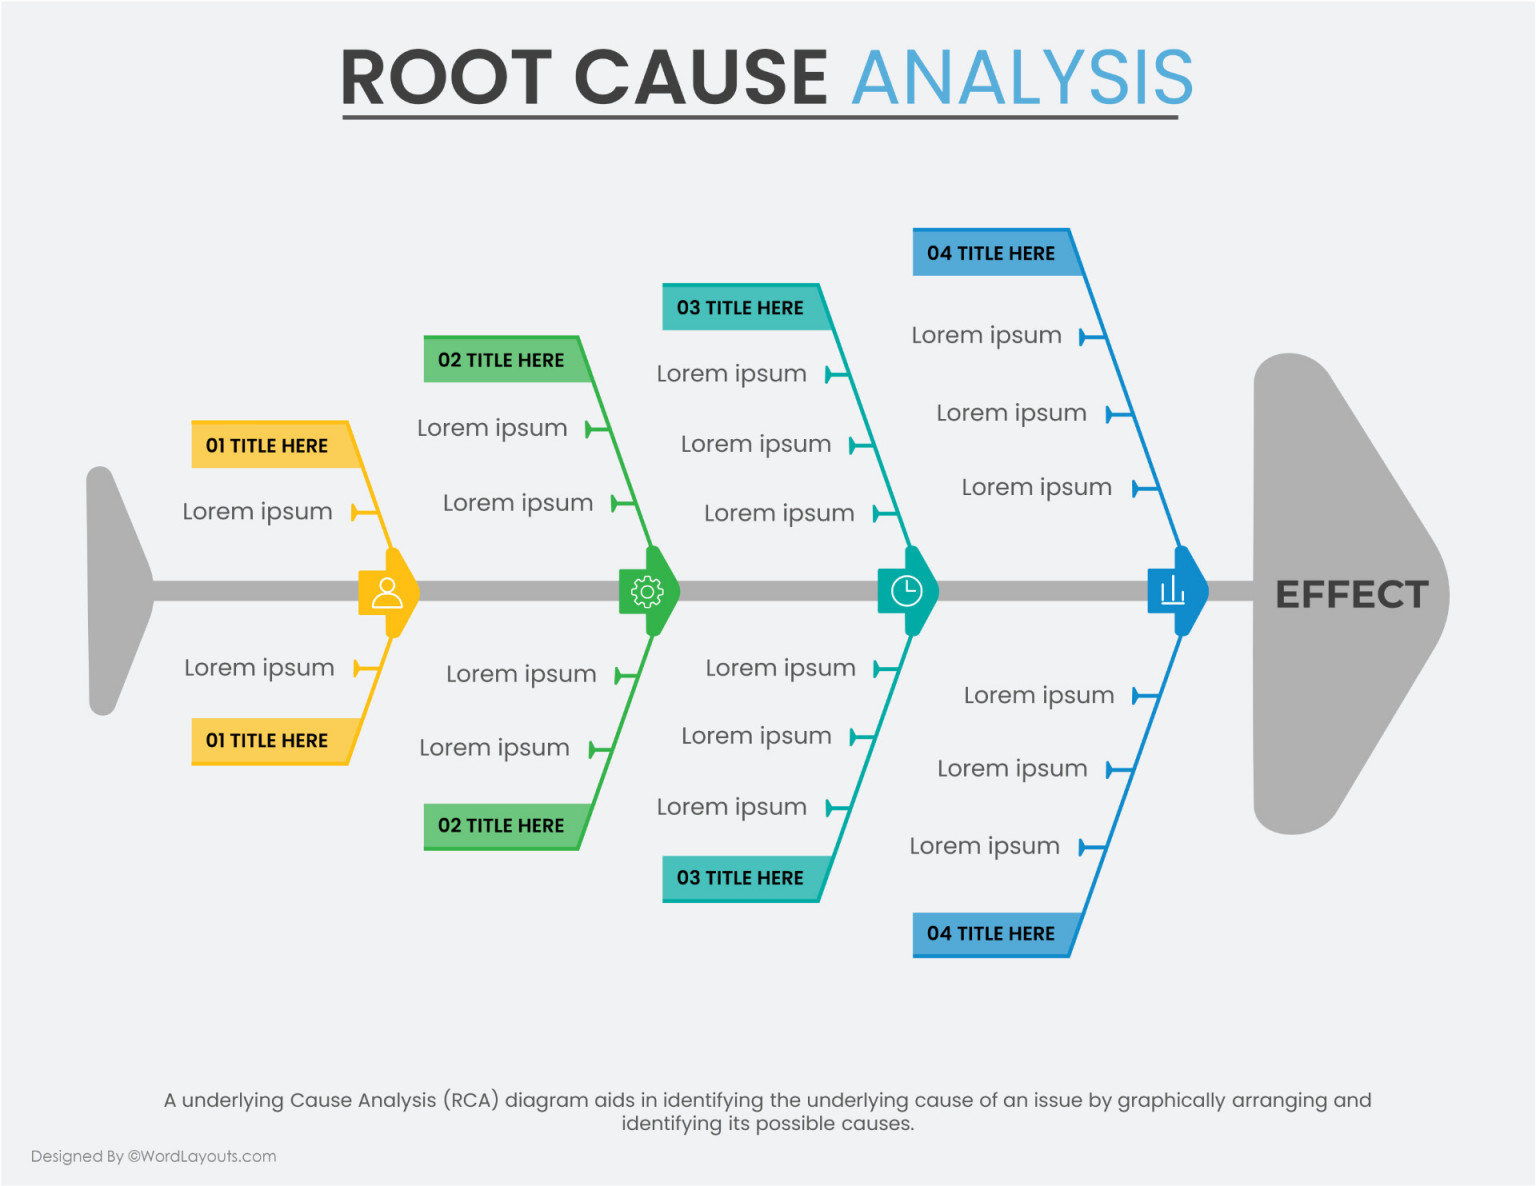
- Fishbone Diagram: Visualize causal factors across categories.
- Failure Mode and Effects Analysis (FMEA): Prioritize risks based on severity, occurrence, and detectability.
- Pareto Analysis: Highlight the 80/20 rule in failure patterns.
4. Root Causes
List each root cause identified, accompanied by evidence. Use bullet points or numbered lists for readability.
- Root Cause #1: Inadequate lubrication schedule. Evidence: Oil level logs show 30 days between changes.
- Root Cause #2: Operator training gap. Evidence: Training records reveal only 12 hours of hands‑on practice.
5. Corrective Actions
For each root cause, detail the action to address it. Include responsible parties, deadlines, and verification methods.
- Action 1: Revise lubrication protocol to 15‑day intervals. Owner: Maintenance Manager. Due Date: 14 days from investigation completion.
- Action 2: Implement quarterly refresher training. Owner: HR/Training Coordinator. Verification: Post‑training competency test scores.
6. Verification & Follow‑Up
Document how you’ll confirm the effectiveness of corrective actions.
- Re‑monitor machine vibration levels for 30 days.
- Conduct a 3‑month audit of lubrication records.
- Survey operators for perceived changes in workflow.
7. Lessons Learned & Continuous Improvement
Capture insights that can inform future investigations and process enhancements. This section turns a single RCA into a learning loop.
- Improved data capture through automated sensor alerts.
- Enhanced collaboration between maintenance and operations teams.
- Updated training curriculum to include hands‑on lubrication practice.
Step‑by‑Step Guide to Using the Template
Step 1: Capture the Incident Quickly
As soon as an event occurs, log the Incident Overview. Time is critical; delays can lead to loss of evidence or fading memories.
Step 2: Gather Evidence Systematically
Deploy a standardized checklist to ensure no data point is missed. Use the Evidence Collection section as a guide.
Step 3: Apply the Analysis Methodology
Select the tool that best fits the problem’s complexity. For a mechanical failure, a Fishbone Diagram often reveals hidden contributors.
Step 4: Identify Root Causes
Separate facts from assumptions. Each root cause must be supported by evidence recorded in the Evidence Collection section.
Step 5: Draft Corrective Actions
Use the Corrective Actions section to write SMART (Specific, Measurable, Achievable, Relevant, Time‑bound) interventions. Assign clear owners to avoid ambiguity.
Step 6: Verify Effectiveness
Schedule follow‑up checks. Document results in the Verification & Follow‑Up section to close the loop.
Step 7: Institutionalize Lessons Learned
Share the Lessons Learned section with relevant stakeholders. Incorporate the insights into standard operating procedures (SOPs) and training modules.
Real‑World Example: A Production Line Overhaul
In a mid‑size automotive parts factory, a sudden halt on Line 4 led to a 48‑hour shutdown. The RCA team used the template to uncover that a faulty sensor had misread temperature, causing an overheat alarm that halted the line. The root cause analysis revealed three key issues:
- Sensor calibration drift. Evidence: Calibration logs from the past 90 days showed no recent adjustments.
- Redundant safety interlock design. Evidence: Design documents indicated a single interlock that could be overridden by a false alarm.
- Operator complacency. Evidence: Shift reports noted that operators had bypassed the sensor alarm during the last week.
Corrective actions included installing a dual‑sensor system, revising the interlock architecture, and conducting a 5‑minute refresher on safety protocols. Verification after three weeks showed no further temperature excursions, and the lessons learned were incorporated into the annual safety audit.
Troubleshooting Common Pitfalls
Incomplete Data
Missing logs or vague notes undermine credibility. Mitigate by automating data capture and encouraging a culture of thorough record‑keeping.
Bias Toward Visible Symptoms
It’s tempting to focus on what’s obvious—like a broken part. Use the analysis methodology section to probe deeper, uncovering systemic failures.
Overly Complex Templates
A template that’s too detailed can discourage use. Strike a balance by including essential fields while allowing optional advanced sections for experienced teams.
Failure to Follow Up
Identifying root causes is only half the battle. Without verification, the problem can recur. Embed a mandatory follow‑up schedule in the template itself.
Customization Tips for Different Industries
Healthcare Settings
When investigating a medical equipment failure, include:
- Patient safety impact assessment.
- Regulatory compliance references (e.g., FDA, HIPAA).
- Interdisciplinary team notes (nurses, biomedical engineers).
Construction & Heavy Equipment
Focus on:
- Site conditions (weather, terrain).
- Tool maintenance logs.
- Operator certification levels.
Information Technology
Key additions:
- System logs and error codes.
- Network topology diagrams.
- Incident response team roles.
Integrating the Template into Your Workflow
Digital vs. Paper
Digital templates, especially within collaborative platforms like SharePoint or Google Docs, allow real‑time updates, version control, and easy sharing. Paper versions can be useful in environments with limited digital access, but they pose risks of loss or damage.
Training Your Team
Conduct a kickoff workshop where each member practices filling out a mock incident using the template. This hands‑on experience reduces resistance when the real thing hits.
Embedding in Continuous Improvement Programs
Link each RCA document to your organization’s Kaizen or Six Sigma initiatives. The lessons learned feed directly into improvement projects, closing the loop between analysis and action.
Conclusion
The Root Cause Analysis Documentation Template is more than a bureaucratic requirement—it’s a catalyst for culture change. By providing a consistent, transparent framework, it empowers teams to dissect problems methodically, implement lasting solutions, and celebrate wins that are data‑driven, not anecdotal. As you adapt this template to your specific context, remember the core principles: capture accurately, analyze objectively, act decisively, and verify rigorously. When these steps become routine, the cycle of continuous improvement will move from aspiration to habit, turning every incident into an opportunity for growth.