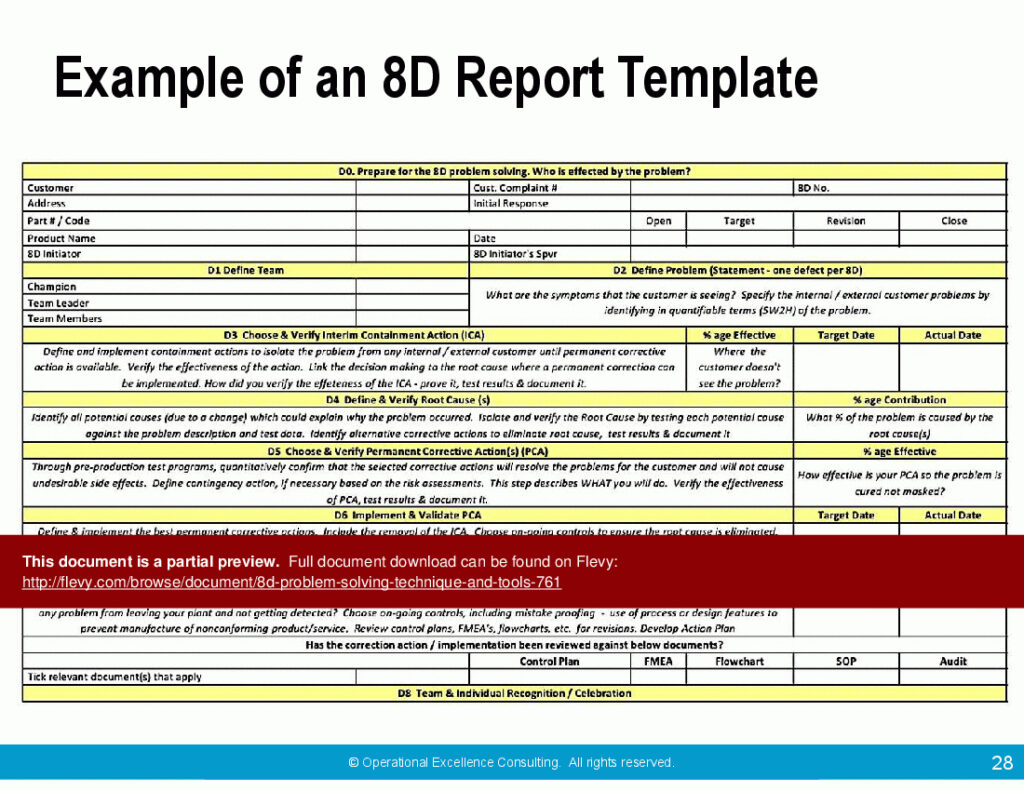
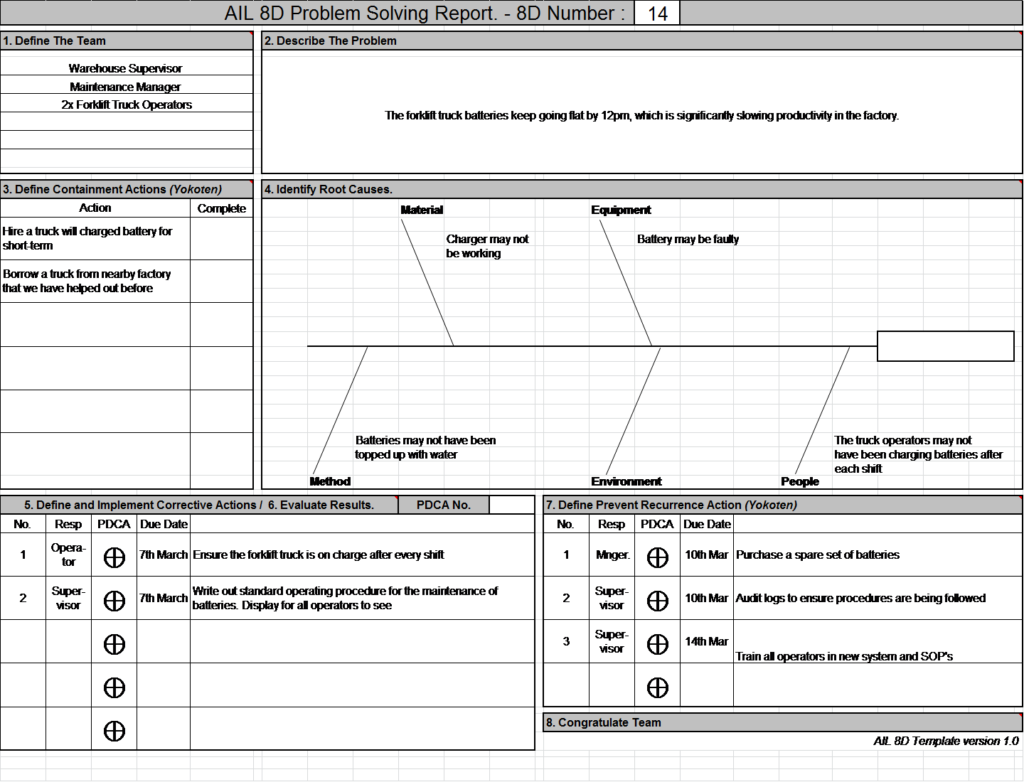
8d Failure Analysis Report Template has become the backbone of systematic problem solving for manufacturers, service providers, and quality engineers who need to turn recurring issues into one‑time fixes. Whether you’re battling a stubborn defect on a production line or trying to prevent warranty claims from spiraling out of control, a well‑designed 8D report guides you through eight disciplined steps that uncover root causes, lock down containment, and embed lasting corrective actions. In this article we’ll explore the origins of the 8D method, break down every section of a high‑impact template, walk through a step‑by‑step filling process, and share real‑world examples that illustrate how the framework drives measurable improvements. By the end, you’ll have a clear roadmap for deploying an 8D Failure Analysis Report Template that boosts efficiency, aligns cross‑functional teams, and safeguards product quality.
What Is the 8D Method?
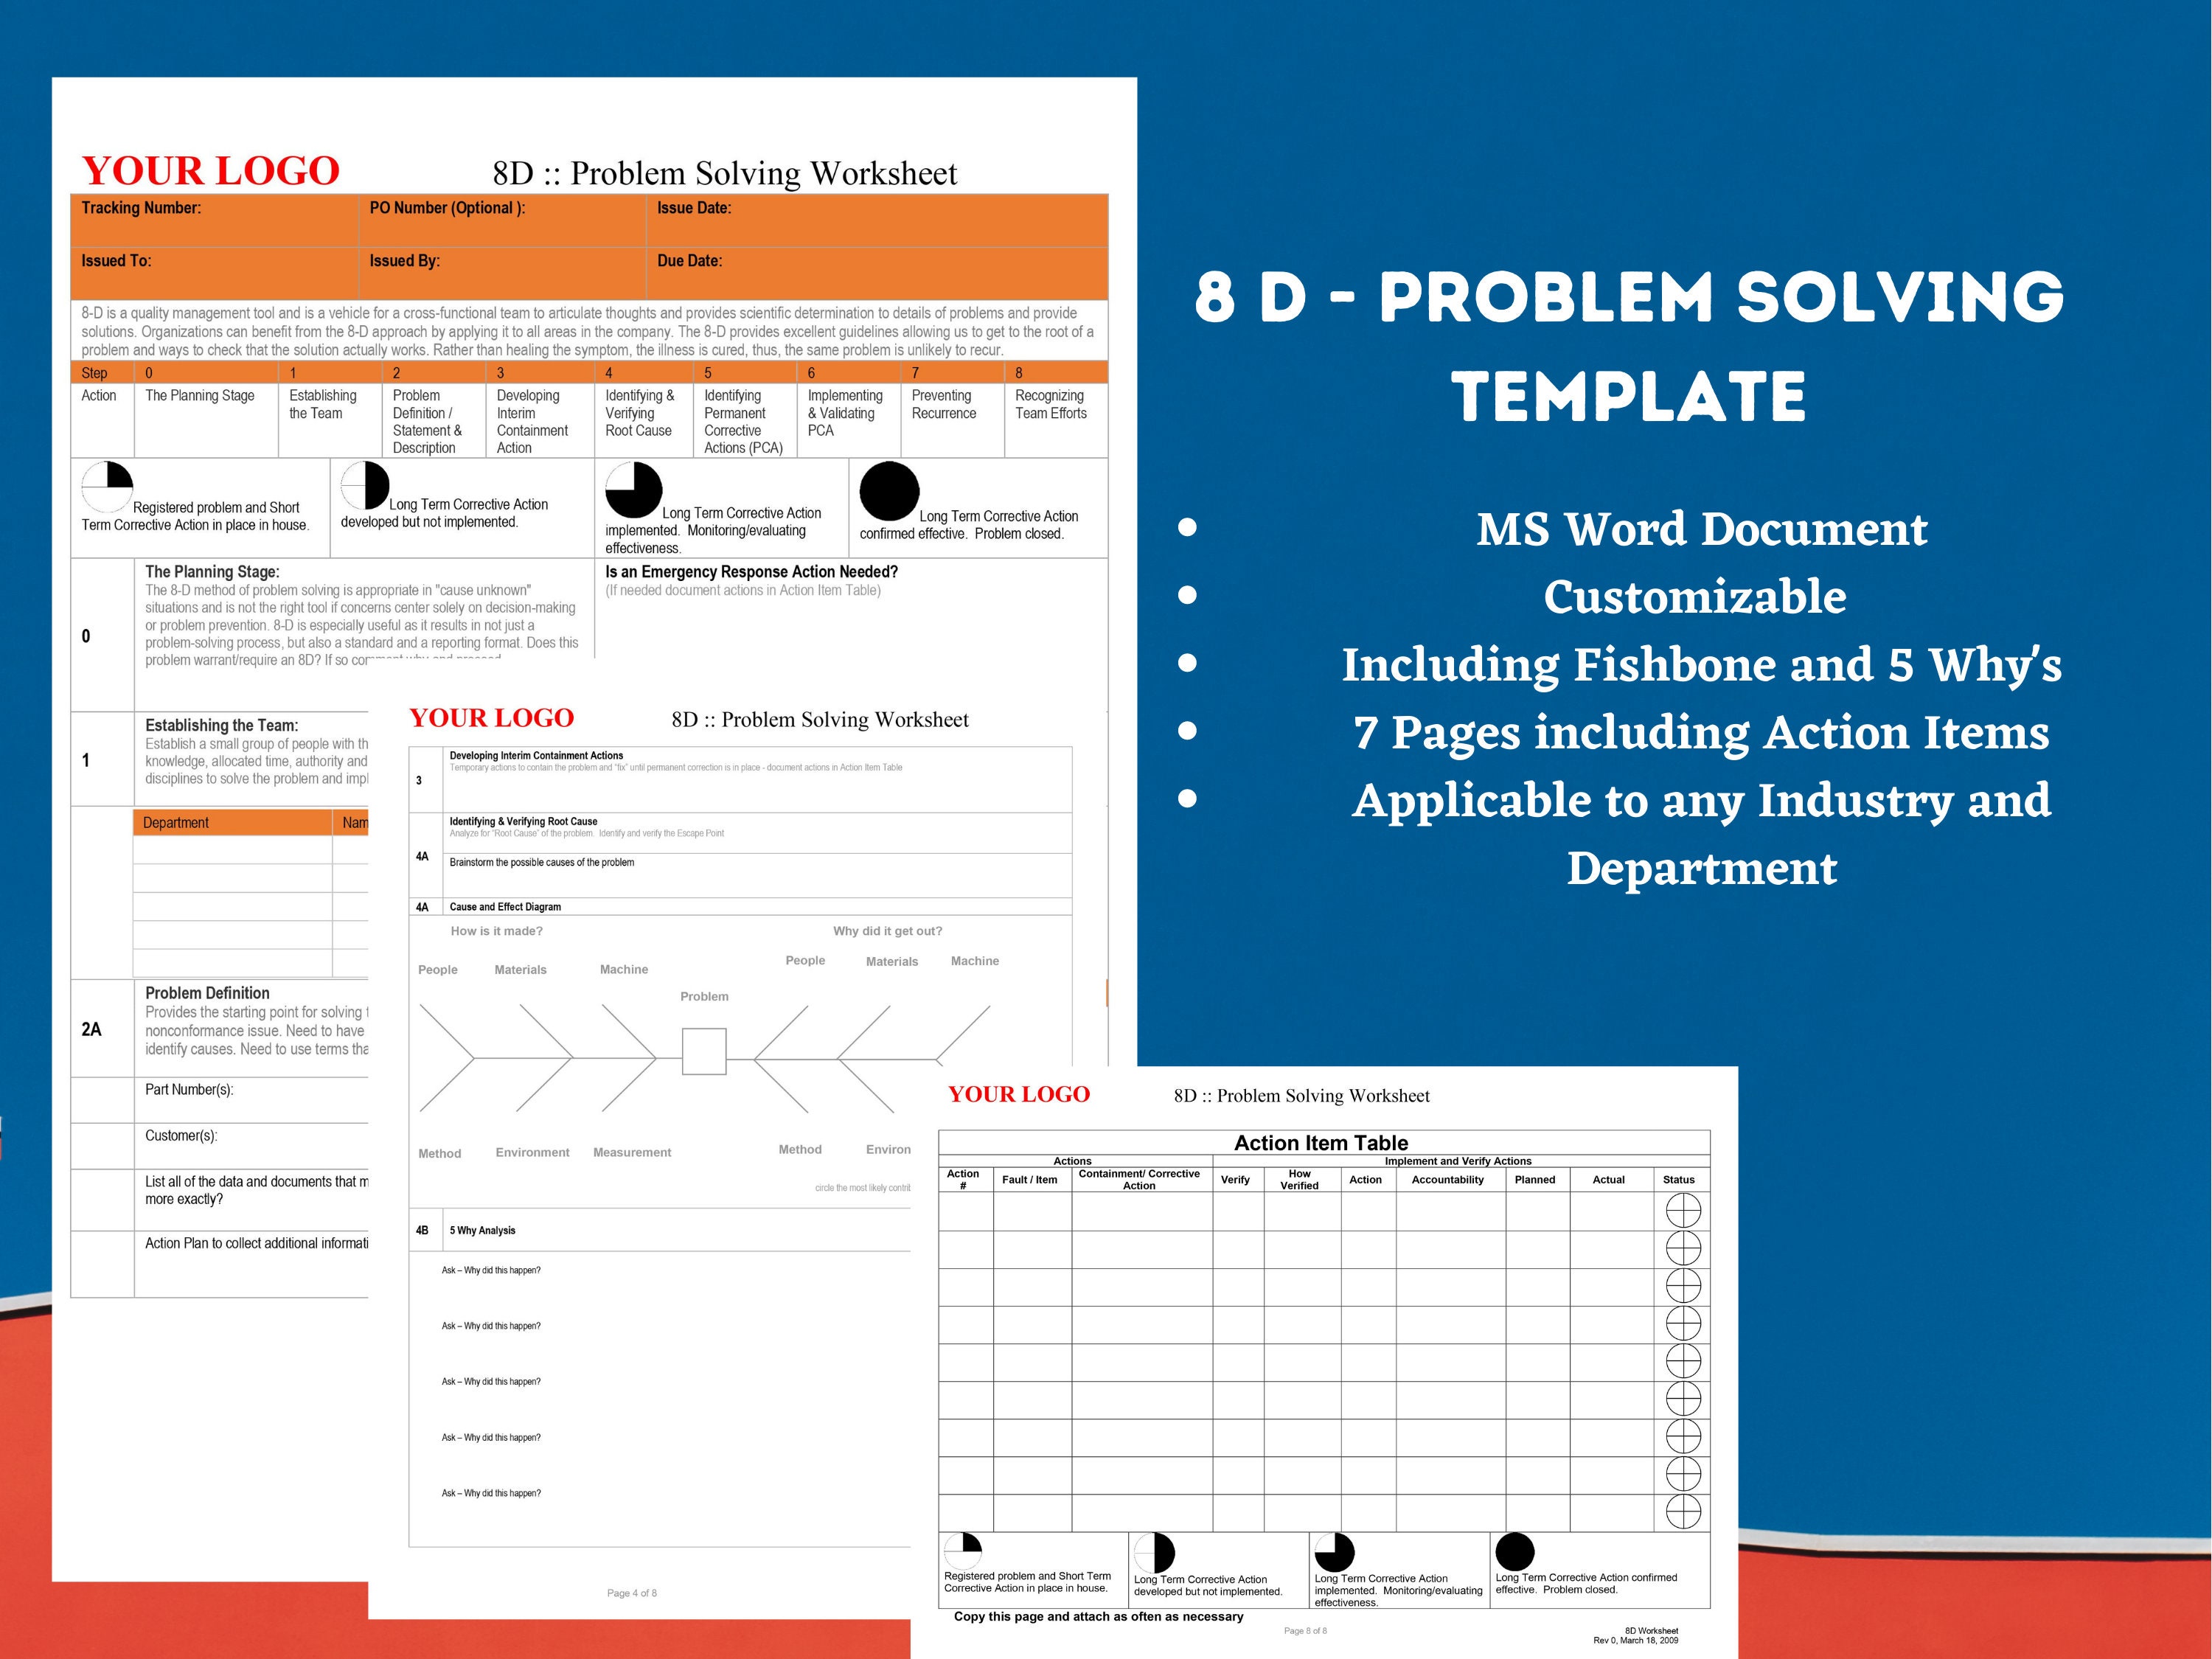
Origin and Purpose
The “8‑discipline” (8D) problem‑solving approach was originally crafted by the automotive industry in the late 1980s, primarily to address the massive quality challenges faced by suppliers to major car manufacturers. Its purpose is simple yet powerful: provide a repeatable, data‑driven process that captures every facet of a problem—from initial detection to long‑term prevention—so that teams can resolve issues quickly while preventing recurrence.
Core Principles
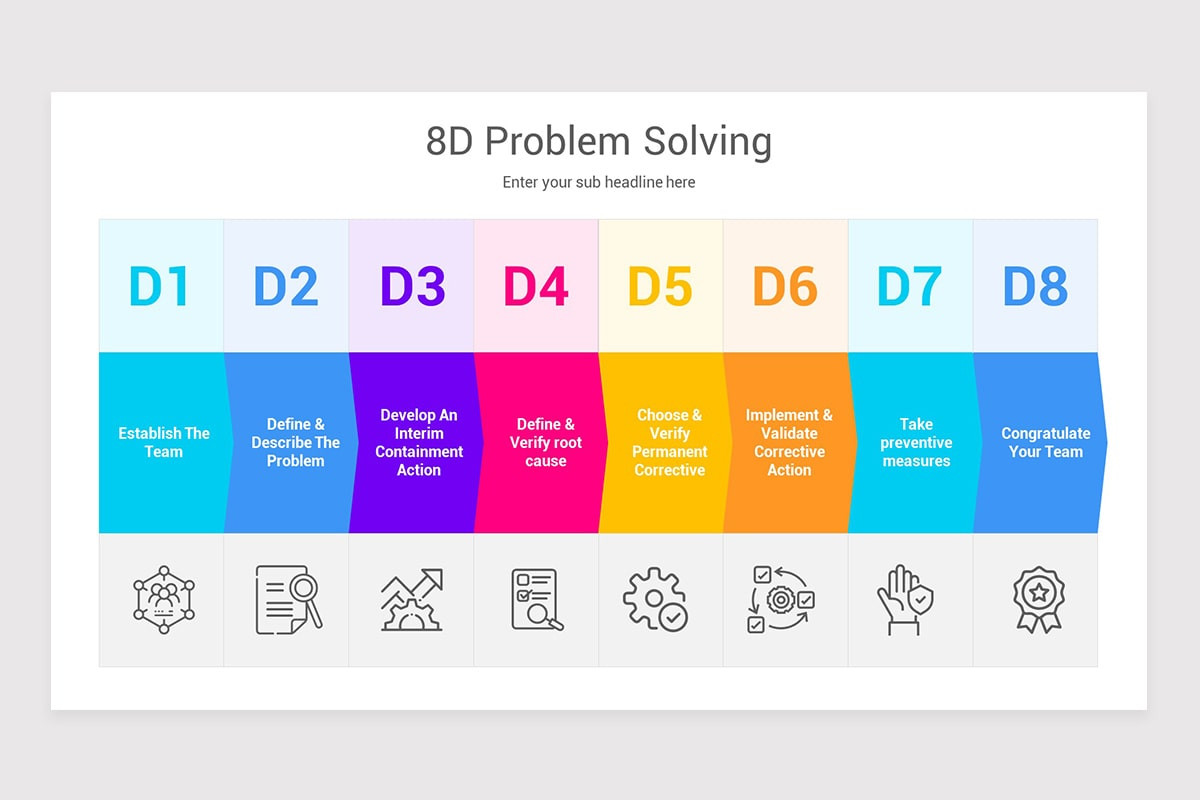
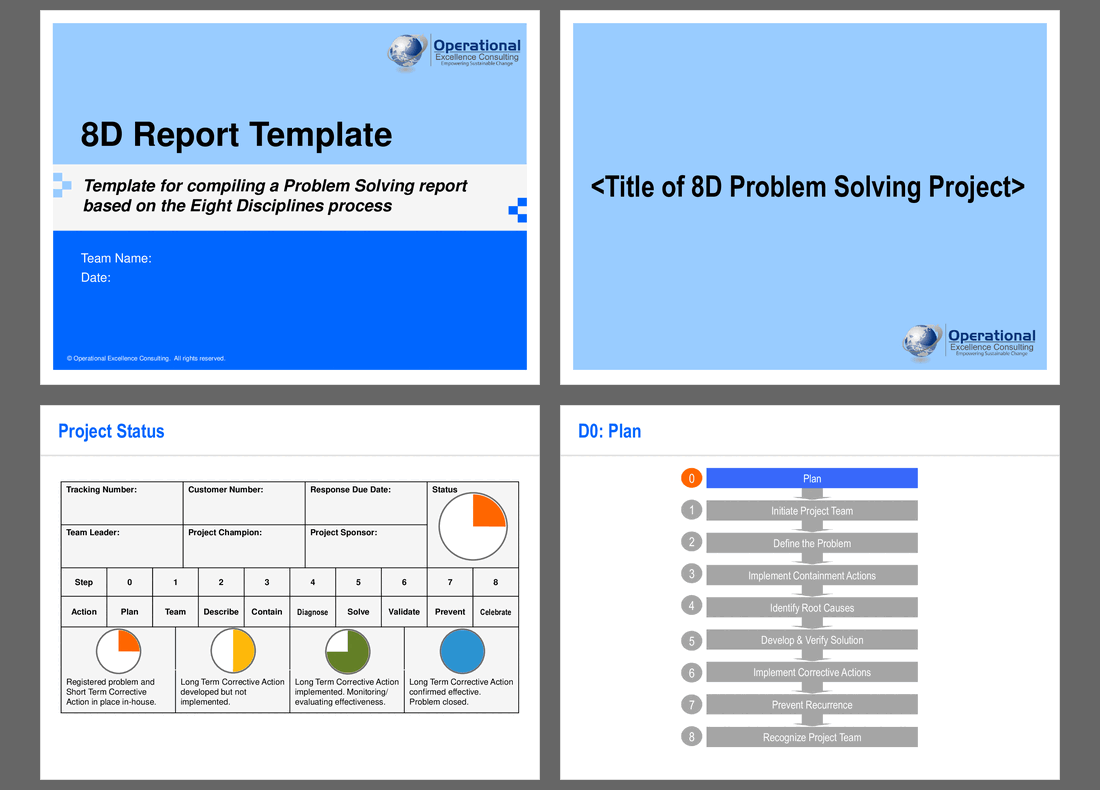
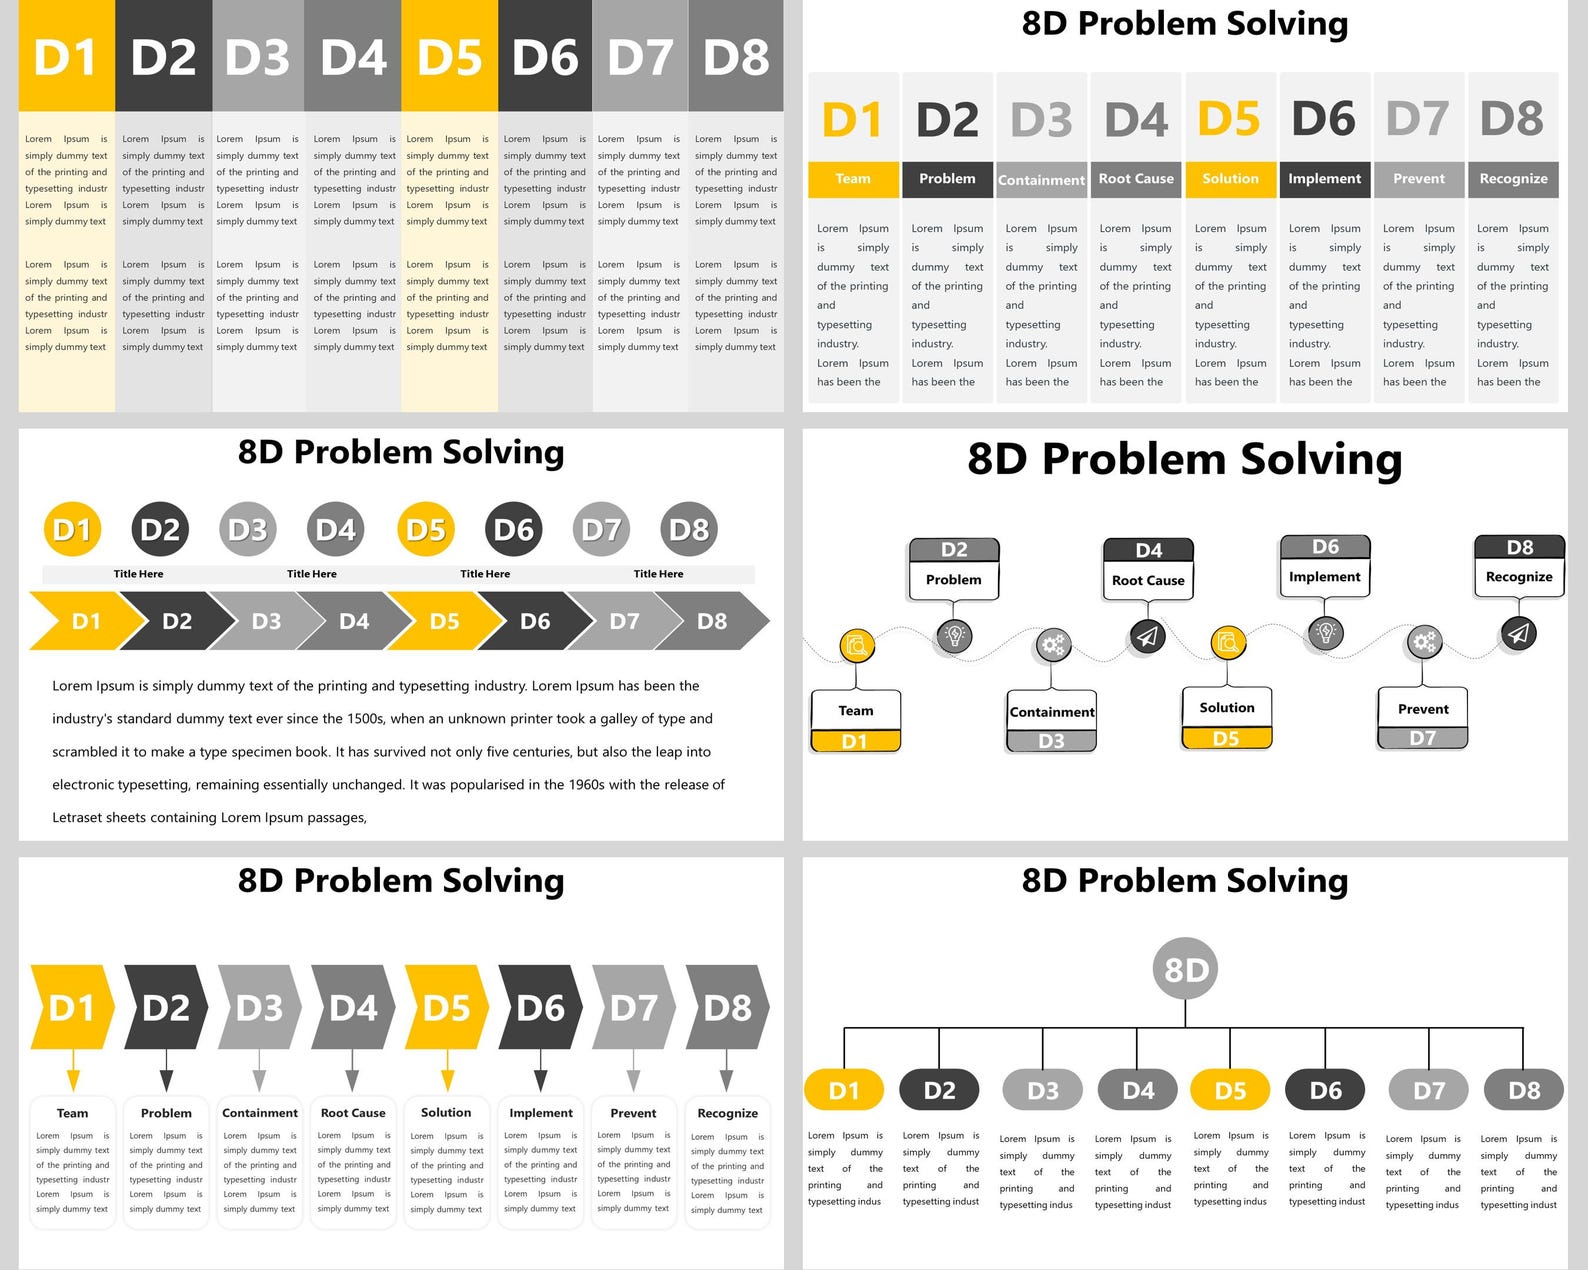
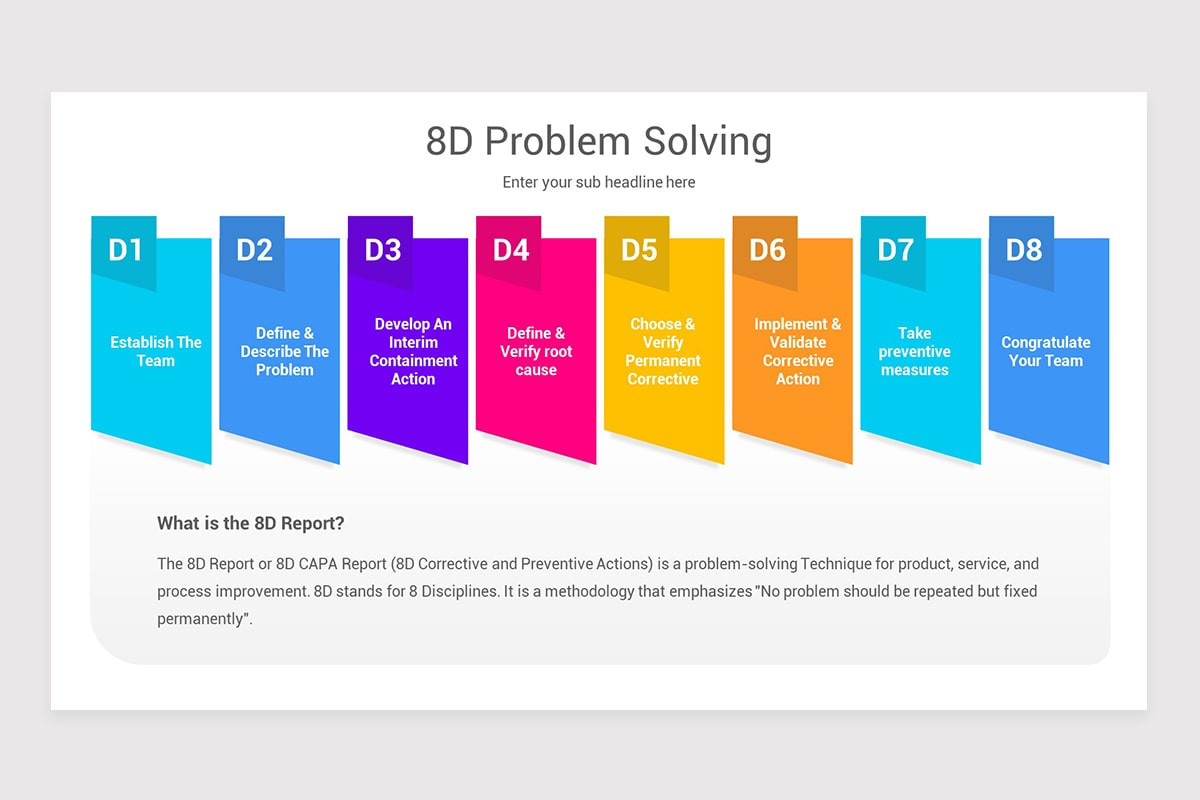
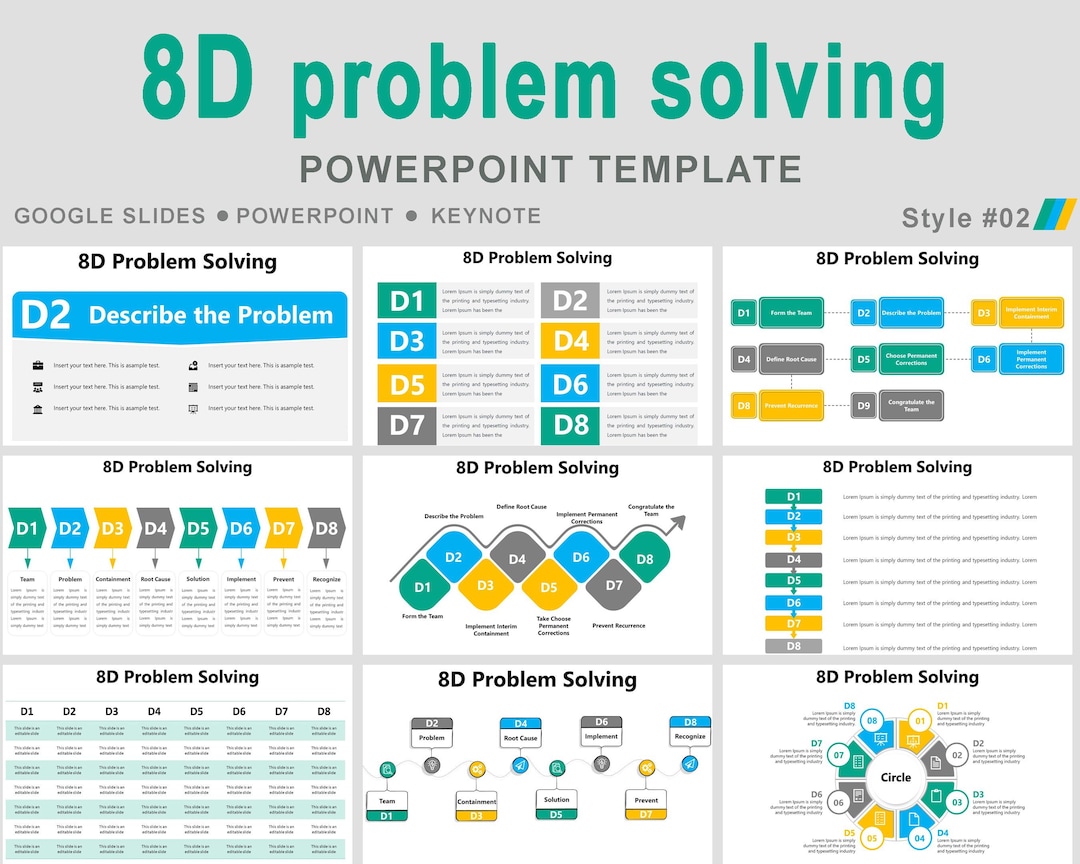
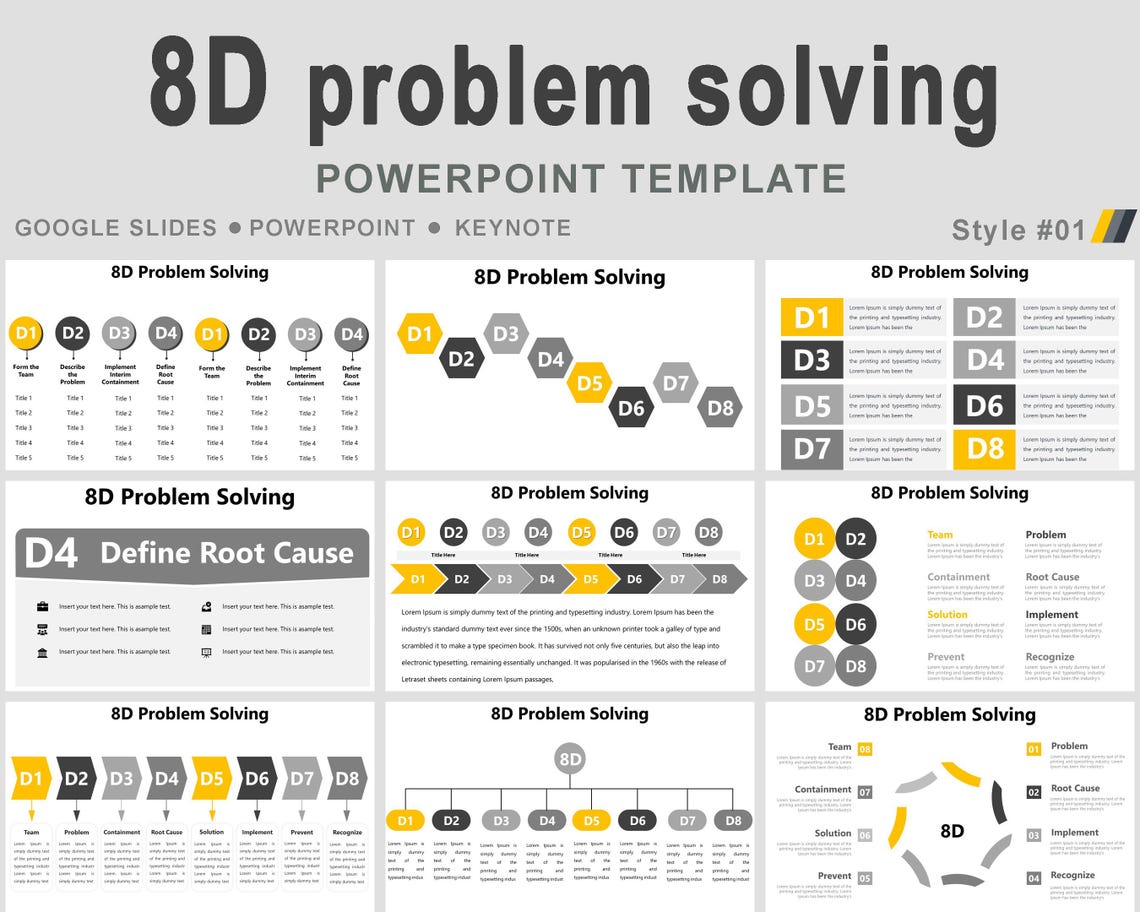
Eight disciplines form the backbone of the method:
- D1 – Team Formation: Assemble a cross‑functional group with the right expertise.
- D2 – Problem Description: Define the issue in measurable terms.
- D3 – Containment Actions: Implement short‑term fixes that protect the customer.
- D4 – Root Cause Analysis: Dig deep to discover why the problem happened.
- D5 – Permanent Corrective Actions (PCAs): Design lasting solutions.
- D6 – Implementation Verification: Test the PCAs to confirm effectiveness.
- D7 – Prevent Recurrence: Update processes, training, and documentation.
- D8 – Congratulate the Team: Recognize contributions and capture lessons learned.
Each discipline builds on the previous one, creating a logical flow that minimizes blind spots and ensures accountability at every stage.
Benefits of Using an 8D Failure Analysis Report Template
Accelerated Problem Resolution
By providing a pre‑structured format, the template eliminates the guesswork of where to start. Teams can jump straight into data collection, which shortens the time from detection to containment. In many organizations, the average time‑to‑contain drops by up to 40 % after adopting a standardized 8D template.
Cross‑Functional Collaboration
The D1 discipline forces the formation of a diverse team that includes engineering, production, quality, supply chain, and sometimes even sales or service. This collaborative environment surfaces perspectives that a single‑department approach would miss, leading to more robust root‑cause identification and corrective actions.
Documentation for Audits and Continuous Improvement
Every 8D report serves as a permanent record of the issue, the analysis performed, and the actions taken. Auditors, certification bodies, and senior management can quickly review the documentation, which strengthens compliance with standards such as ISO 9001, IATF 16949, and AS9100.
Quantifiable Metrics
Because the template includes fields for dates, owners, verification results, and effectiveness ratings, you can extract key performance indicators (KPIs) such as “average D4 analysis time” or “percentage of PCAs that passed verification on first attempt.” These metrics feed directly into continuous improvement programs like Six Sigma or Lean.
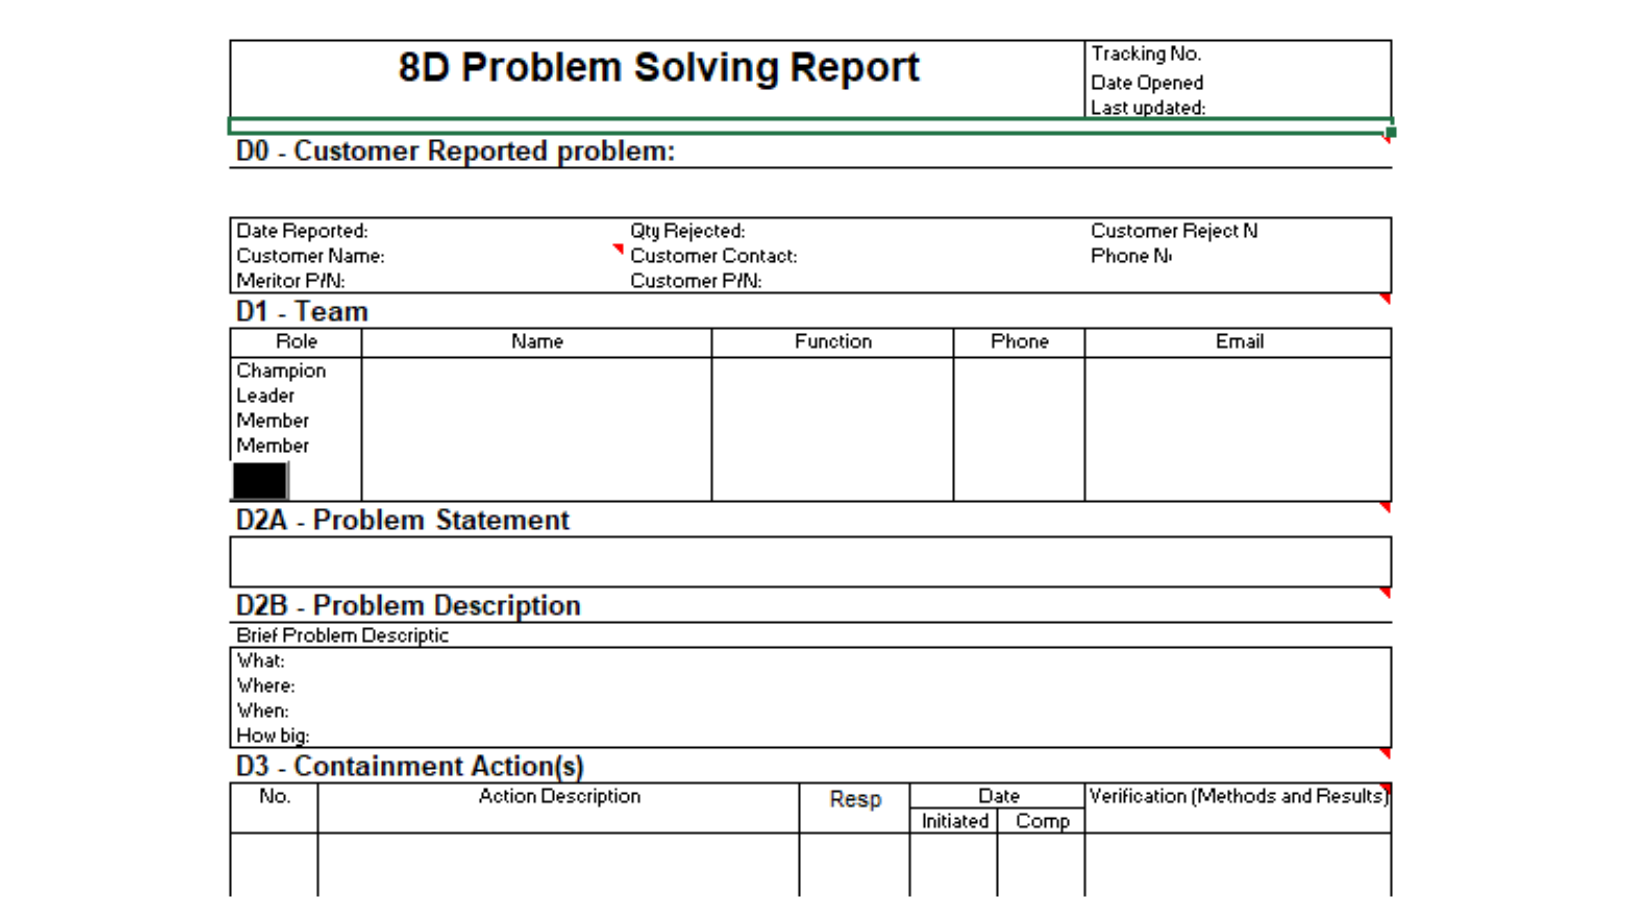
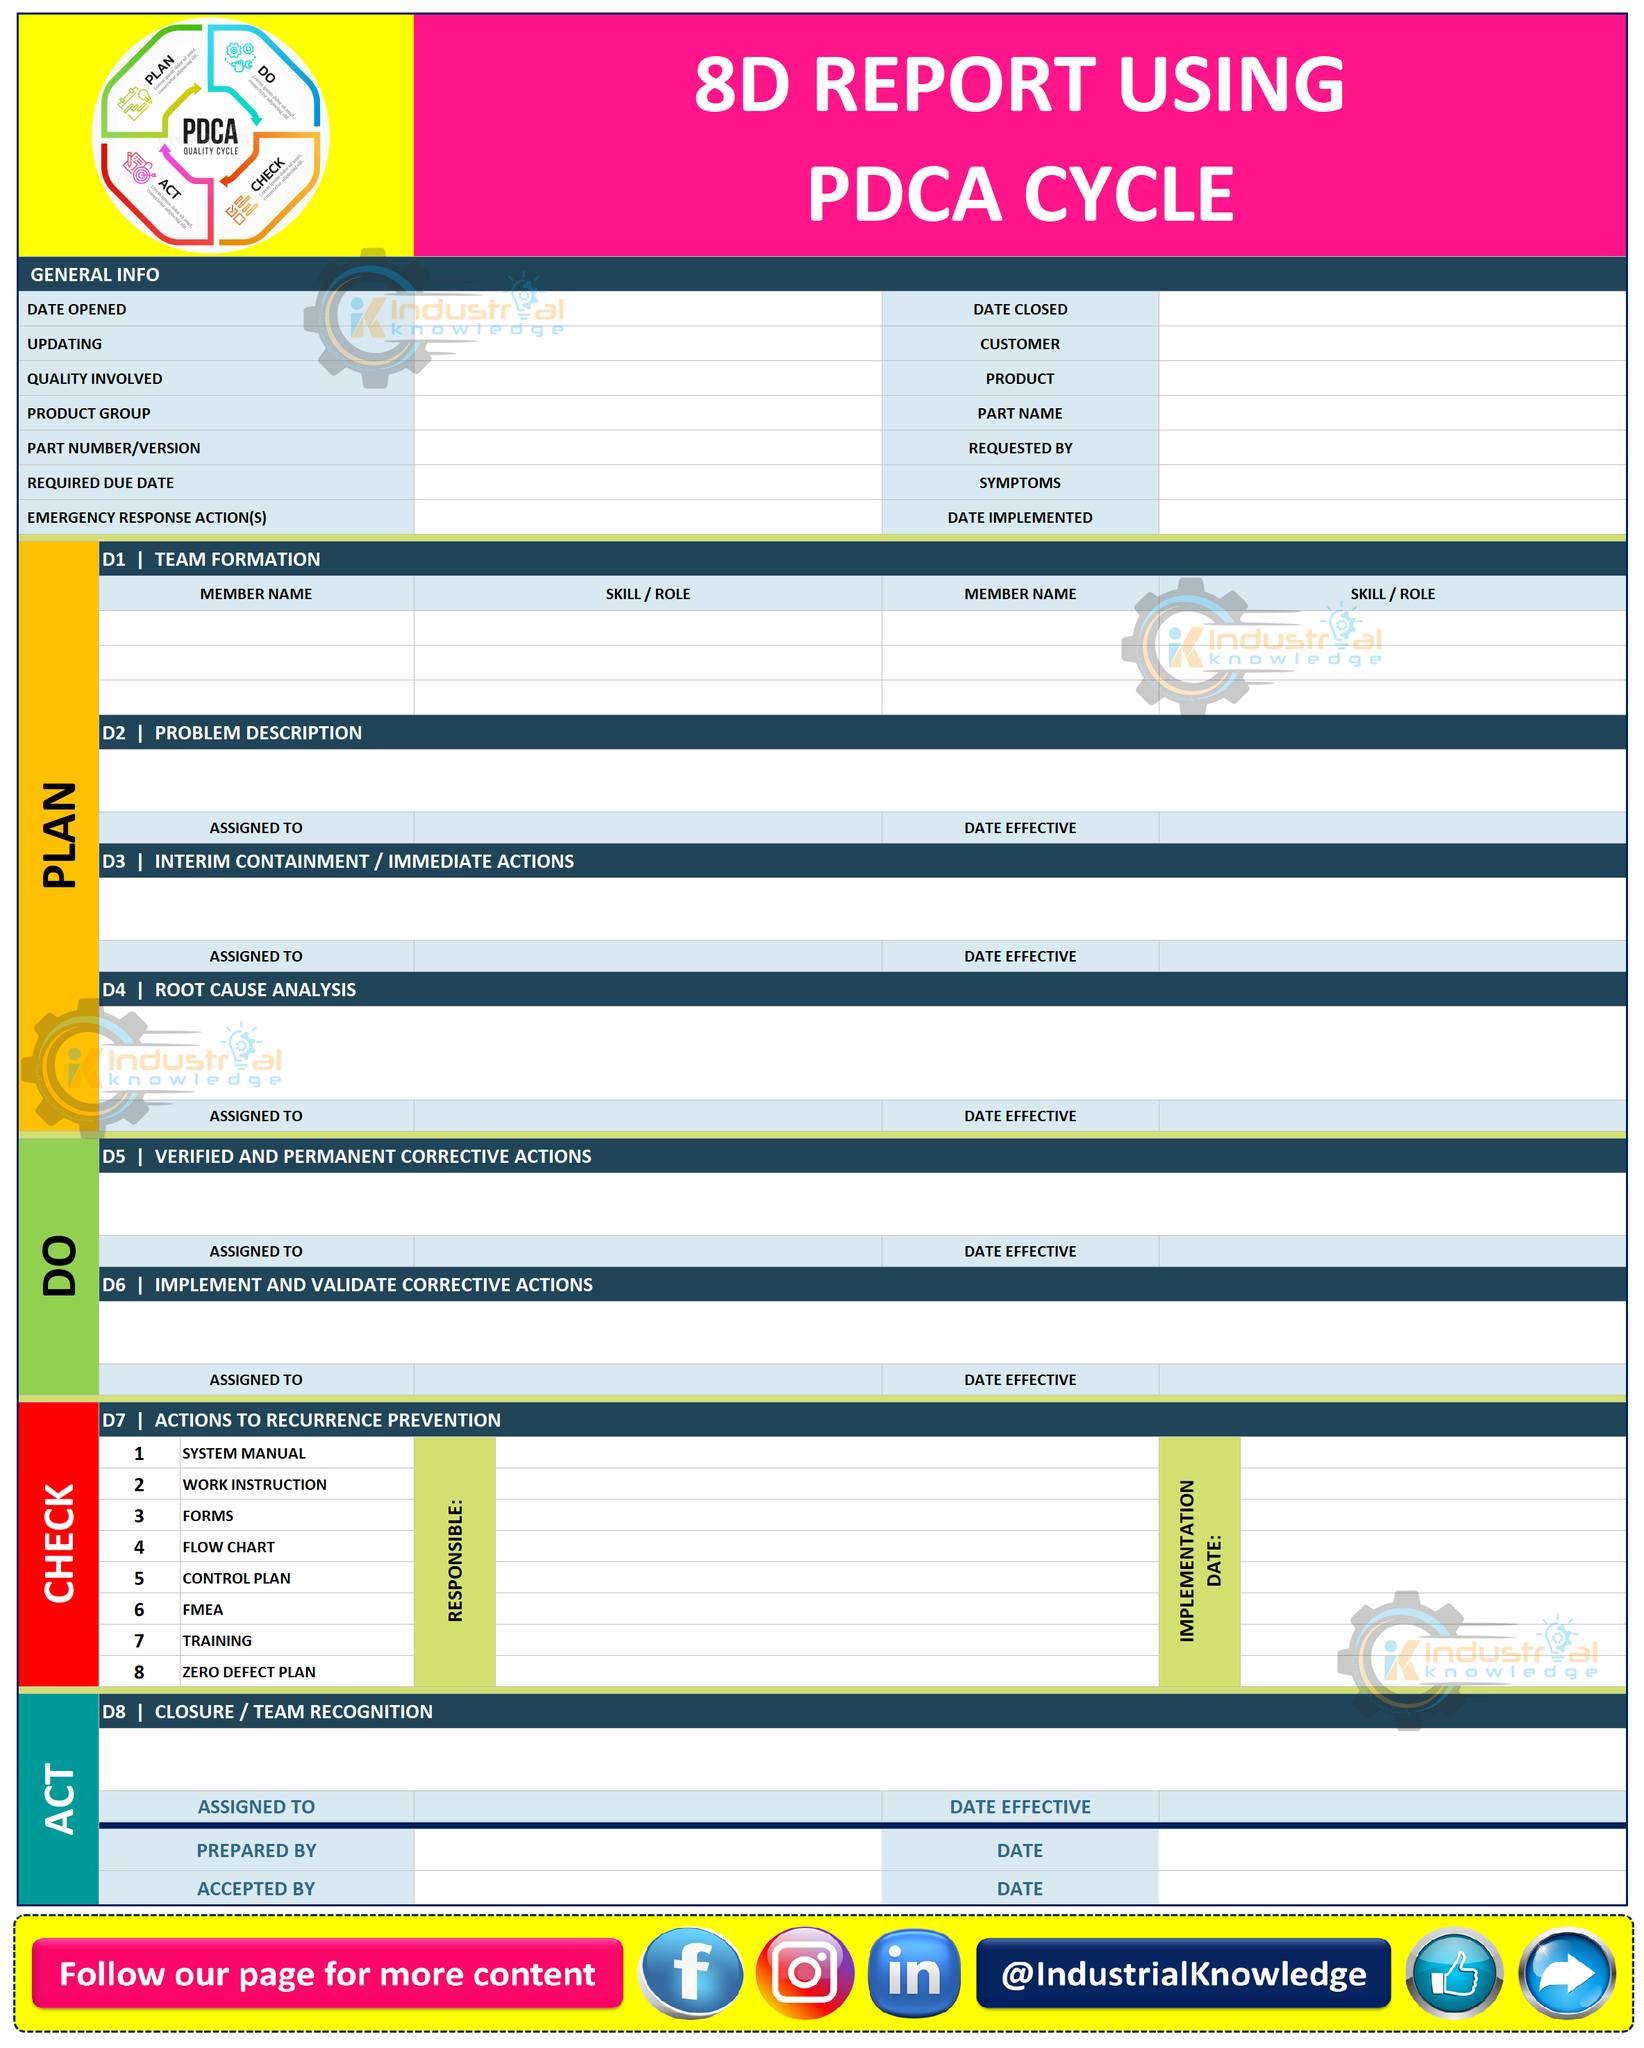
Key Components of an Effective 8D Report Template
D1 – Team Formation
This section lists each team member, their role, and contact information. It also captures the team leader, who is accountable for driving the process forward. Including a “Stakeholder” column ensures that anyone impacted by the issue is kept in the loop.
D2 – Problem Description
A clear, concise problem statement is essential. The template typically asks for:
- What: What is happening? (e.g., “Surface cracks appear on the rear panel.”)
- Where: Where does it occur? (e.g., “Model X, batch 2023‑09, line 4.”)
- When: When was it first observed? Include timestamps if available.
- Impact: Quantify the effect on customers, warranty costs, or production yield.
Adding a “Severity Rating” field helps prioritize actions based on business impact.
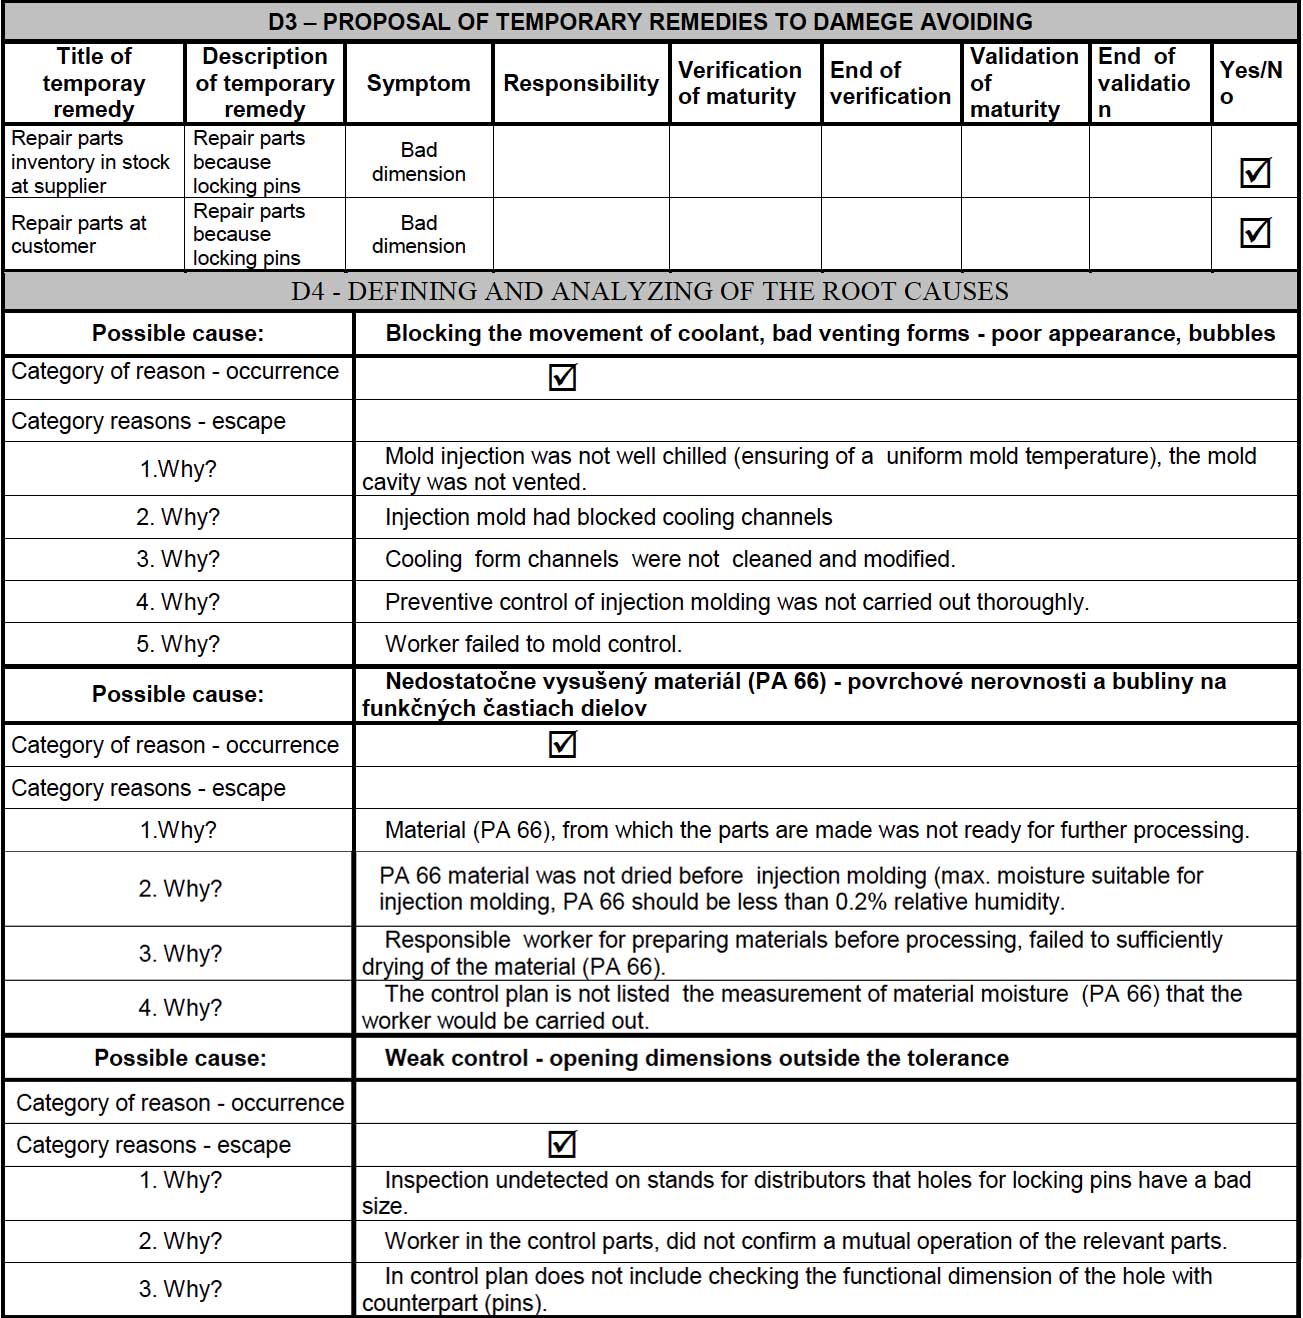
D3 – Containment Actions
Containment prevents the defect from reaching customers while a root cause is being investigated. The template captures:
- Specific steps taken (e.g., “Isolate affected lot, halt shipment, apply visual inspection on all units.”)
- Responsibility and due dates.
- Verification method (e.g., “Inspection of 100% of units for the next 48 hours”).
Documenting containment clearly demonstrates to stakeholders that immediate risk mitigation is underway.
D4 – Root Cause Analysis
This is the analytical heart of the 8D. The template often includes a space for:
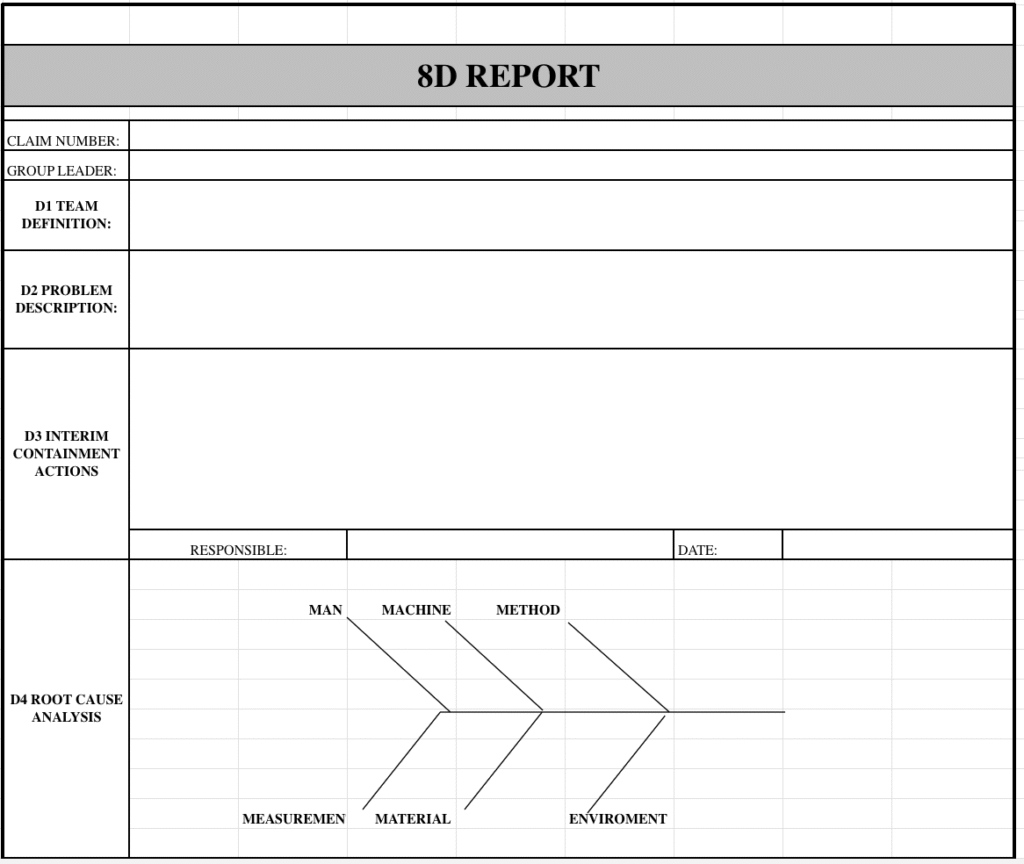
- Fishbone (Ishikawa) diagram or 5‑Why analysis.
- Data tables showing test results, process parameters, or statistical evidence.
- Identification of primary and contributing causes.
Providing a structured area for evidence prevents speculation and supports data‑driven conclusions.
D5 – Permanent Corrective Actions (PCAs)
Here you define the long‑term fix. The template asks for:
- Specific action description (e.g., “Redesign the sealing gasket to increase thickness by 0.2 mm.”)
- Owner, start date, target completion date.
- Resources required and cost estimate.
- Risk assessment of the proposed solution.
Linking each PCA directly to the root cause(s) identified in D4 ensures relevance and effectiveness.
D6 – Implementation Verification
After the PCA is executed, verification proves that the problem is truly solved. The template includes fields for:
- Verification method (e.g., “Run 500 units through the updated process and record defect rate.”)
- Results and statistical analysis.
- Owner sign‑off confirming that the corrective action meets the acceptance criteria.
If verification fails, the loop returns to D5 for refinement, reinforcing a continuous improvement mindset.
D7 – Prevent Recurrence
This section captures systemic changes that embed the lesson into the organization:
- Updates to work instructions, SOPs, or training modules.
- Changes to process controls or monitoring plans.
- Implementation of design‑for‑reliability (DfR) criteria in future projects.
Documenting these actions closes the feedback loop and reduces the likelihood of similar failures.
D8 – Congratulate the Team
Recognition is a vital cultural driver. The template provides a space to note the team’s achievements, celebrate milestones, and record any lessons learned for future reference. This positive reinforcement encourages participation in future problem‑solving initiatives.
Step‑by‑Step Guide to Fill Out the Template
Gather Data Before You Start
Begin by collecting all relevant data: defect logs, production records, customer complaints, and test results. The richer the data set, the smoother the D4 analysis will be. Store this information in a central repository so every team member can access it instantly.
Draft Each Discipline Sequentially
While the 8D steps are linear, you can draft sections in parallel when team members have clear responsibilities. For example, while the quality engineer works on D2, the production supervisor can already initiate D3 containment measures. Keep a master version of the template updated in real time to avoid version control issues.
Use Visual Aids for Clarity
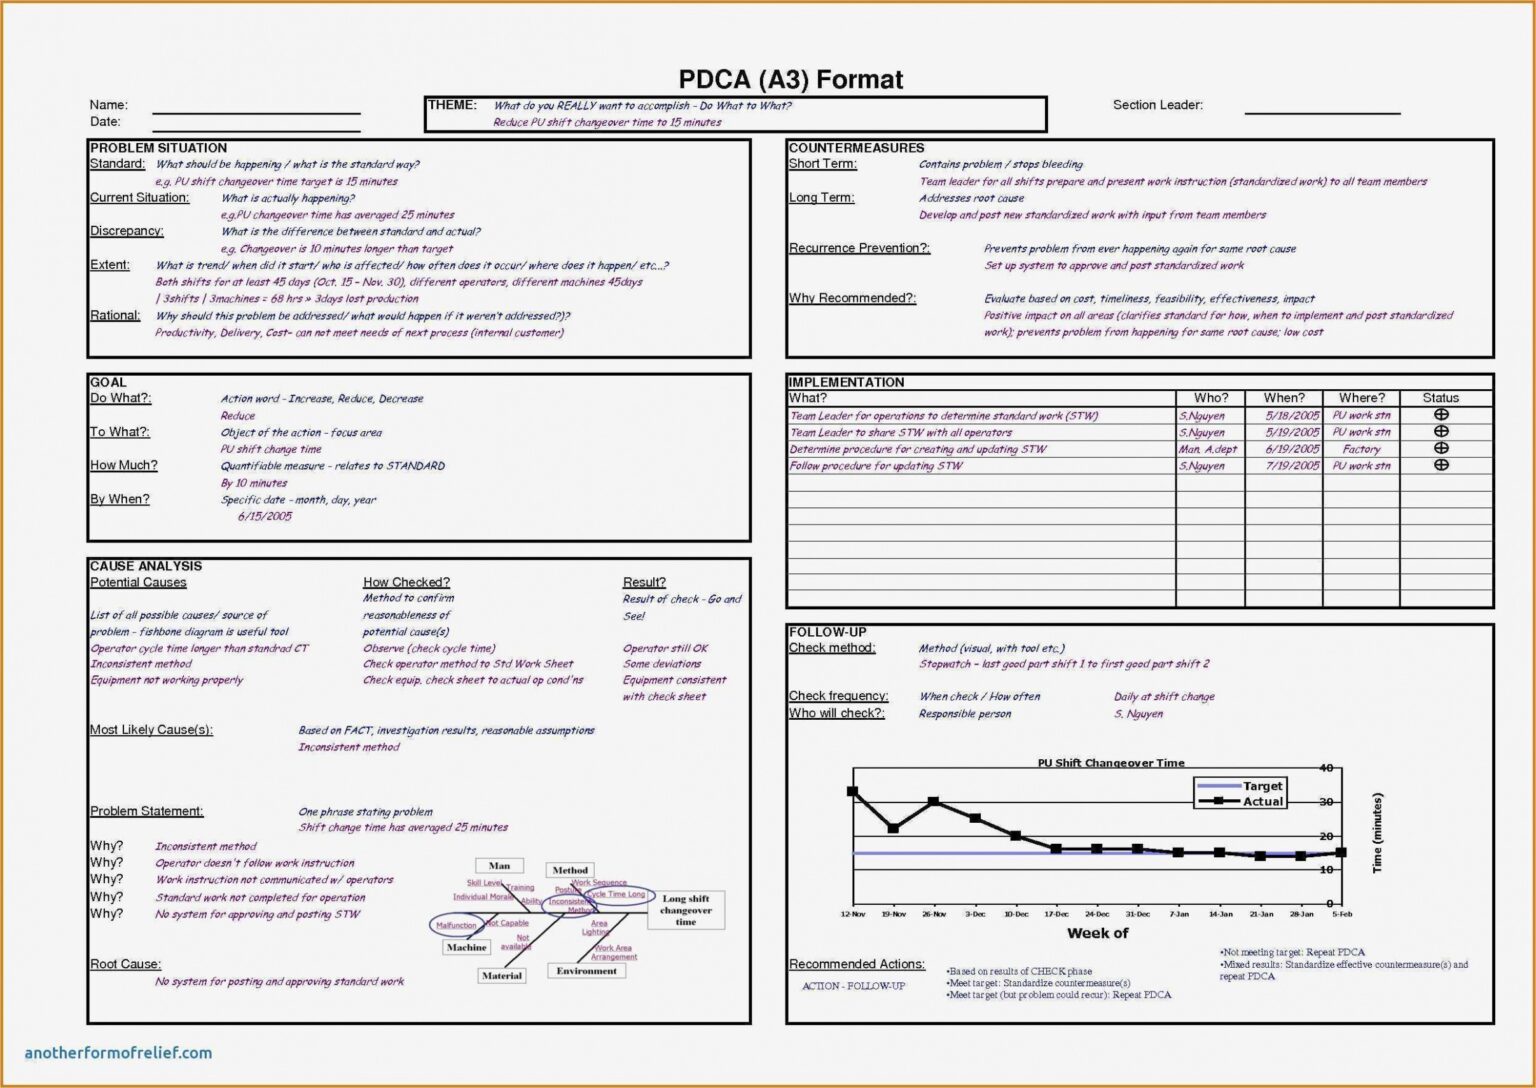
In D4, embed a fishbone diagram or a 5‑Why table directly into the template. Visuals help stakeholders grasp complex cause‑effect relationships at a glance and reduce misinterpretation during reviews.
Validate Every Claim
For each action in D5 and D6, attach supporting evidence—test data, simulation results, or supplier certifications. This evidence‑based approach builds confidence during management reviews and audit inspections.
Review and Sign Off Systematically
Before moving from one discipline to the next, schedule a brief “gate” meeting where the team reviews the completed section, resolves open questions, and signs off. Document the meeting minutes within the template to maintain a clear audit trail.
Close the Loop with Lessons Learned
In D8, summarize the key takeaways, note any process changes that proved especially effective, and suggest improvements to the template itself. This continuous feedback ensures that each 8D cycle raises the organization’s problem‑solving maturity.
Real‑World Example: Automotive Supplier Reduces Brake Noise

Situation Overview
A midsize automotive supplier received a surge in warranty claims related to squeaking brakes on a newly launched sedan model. The defect manifested after 5,000 miles of normal use, affecting roughly 2 % of the fleet and threatening brand reputation.
Applying the 8D Template
D1 – Team Formation: The team comprised a design engineer, a materials specialist, a production supervisor, a quality manager, and a supplier quality engineer.
D2 – Problem Description: “Squeaking noise observed on front brake rotors during low‑speed deceleration, occurring in humid climates, batch 2024‑03, affecting 150 units.”
D3 – Containment: All affected vehicles were recalled for a temporary retrofit of a silicone damping pad while root cause analysis proceeded.
D4 – Root Cause: A 5‑Why analysis revealed that a new steel alloy used for the rotor lacked a micro‑structural finish, leading to higher friction under moisture. The supplier’s heat‑treatment process had drifted due to a worn furnace sensor.
D5 – PCAs: (1) Update the alloy specification to include a surface‑hardness tolerance; (2) Replace the furnace sensor and recalibrate the heat‑treatment cycle; (3) Implement a post‑process ultrasonic inspection to verify surface finish.
D6 – Verification: Ten pilot rotors were produced under the new parameters, tested in a humidity chamber, and showed zero squeak events across 1,000 brake cycles.
D7 – Prevent Recurrence: Revised the supplier’s quality agreement, added a monthly sensor calibration audit, and updated the internal design handbook.
D8 – Congratulate: The cross‑functional team received a “Quality Excellence” award, and the case study was shared across the company’s global quality network.
Results
The corrective actions eliminated the squeaking issue, reduced warranty costs by $1.2 M in the first year, and improved on‑time delivery for the affected model. Moreover, the supplier’s defect rate dropped by 35 % across all parts after the new audit procedures were instituted.
Tips for Customizing Your Template

Keep It Simple
While it’s tempting to add every possible data field, a cluttered template can slow adoption. Focus on the essential elements that drive decision‑making and leave optional sections for complex projects.
Use Visual Aids Effectively
Incorporate dropdown menus for severity ratings, checkboxes for action completion, and embedded charts for trend analysis. Interactive elements keep the document dynamic and reduce manual formatting errors.
Integrate With Existing Systems
If your organization already uses an ERP or PLM system, embed the 8D template as a form or module within that platform. Automatic population of fields like part numbers, batch IDs, and dates reduces data entry time and improves accuracy.
Standardize Terminology
Agree on a common vocabulary for “defect,” “non‑conformance,” and “failure mode.” Consistent terminology ensures that everyone interprets the report uniformly, which is especially important for global teams.
Leverage Version Control
Store the template in a controlled repository (e.g., SharePoint or a dedicated document management system) and enforce a naming convention that includes the project ID and date. This prevents multiple versions from circulating simultaneously.
Common Pitfalls to Avoid
Skipping D4 or Rushing Root Cause Analysis
When teams jump straight to corrective actions without a thorough D4, they risk treating symptoms rather than causes. This leads to recurring issues and wasted resources. Allocate dedicated time for data collection and analysis before proposing PCAs.
Over‑Complicating Containment
Containment should be swift and straightforward. Over‑engineered interim fixes can consume valuable production capacity and distract the team from the core analysis. Aim for the simplest action that isolates the defect without compromising safety.
Neglecting D7 Preventive Measures
Many organizations stop at solving the immediate problem and forget to embed the lesson into the broader system. Skipping D7 means the same root cause could reappear in a different product line or supplier context.
Insufficient Documentation
Leaving fields blank or providing vague descriptions erodes the credibility of the 8D process. Detailed, evidence‑based entries make the report a valuable knowledge asset for future projects and audits.
Frequently Asked Questions
- Can the 8D method be used for software defects? Yes. While traditionally applied to manufacturing, the disciplined steps—especially root cause analysis and preventive actions—translate well to software bug tracking and release management.
- How long should an 8D report take to complete? The timeline varies with problem complexity. Simple issues may close within a week, whereas complex systemic failures can take several weeks. The key is to meet the containment deadline quickly while allowing sufficient time for thorough analysis.
- Is a separate document needed for each D? No. A single, well‑structured template that includes all eight disciplines keeps the information consolidated, ensuring traceability and ease of review.
- Do I need special software to run an 8D report? Not necessarily. Spreadsheets, word processors, or dedicated quality management tools can host the template. Choose a platform that supports collaboration, version control, and easy data export.
- How does 8D relate to Six Sigma? Both are data‑driven problem‑solving methodologies. 8D provides a concise, eight‑step framework, while Six Sigma offers a broader statistical toolbox (DMAIC). Many organizations combine the two—using 8D for rapid response and Six Sigma for deep‑dive projects.
Conclusion
The 8d Failure Analysis Report Template is more than a paperwork requirement; it is a strategic asset that transforms reactive firefighting into proactive quality stewardship. By systematically guiding teams through team formation, precise problem definition, swift containment, rigorous root‑cause discovery, and durable corrective actions, the template delivers measurable reductions in defect rates, warranty costs, and production downtime. Real‑world applications, such as the automotive brake‑noise case, demonstrate how disciplined use of the 8D framework yields tangible business results and strengthens supplier partnerships. To maximize its impact, customize the template to fit your organization’s workflow, embed visual tools, integrate with existing systems, and train teams on each discipline’s purpose. Avoid common pitfalls—especially skipping root‑cause analysis or neglecting preventive measures—to ensure that each 8D cycle leaves the organization stronger and more resilient. When embraced fully, the 8D Failure Analysis Report Template becomes the cornerstone of a culture that values data, collaboration, and continuous improvement, driving quality excellence for years to come.