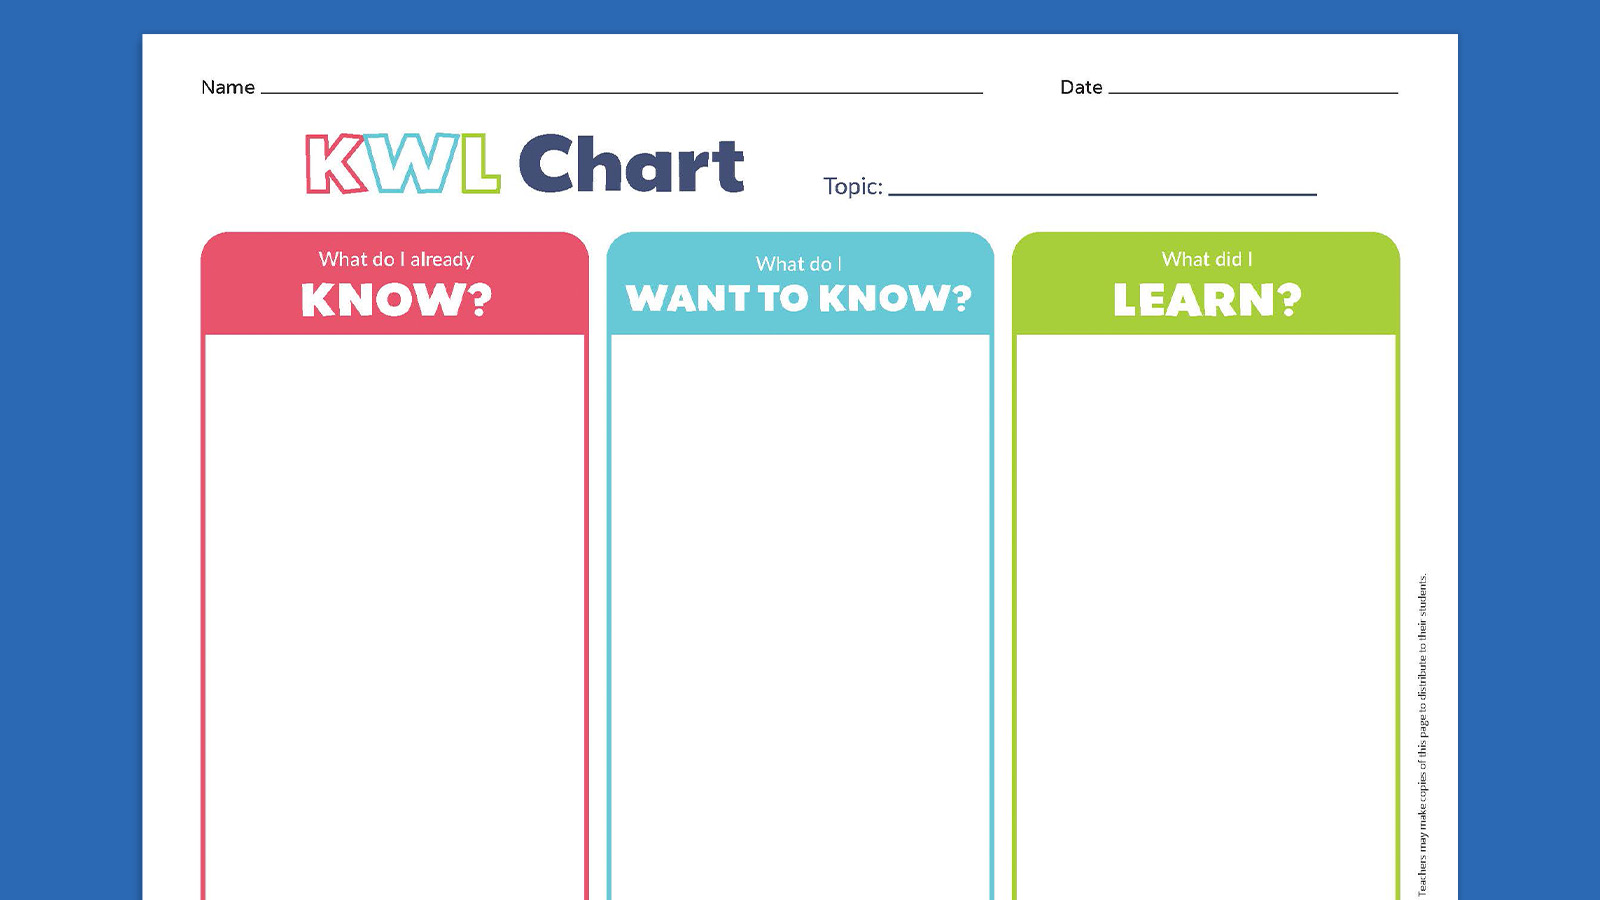
Kwl Chart Template Word Document is a powerful yet simple tool that transforms how students engage with new material. By guiding learners to ask, learn, and review, it turns passive reading into an active discovery journey.
What Is a KWL Chart?

Definition
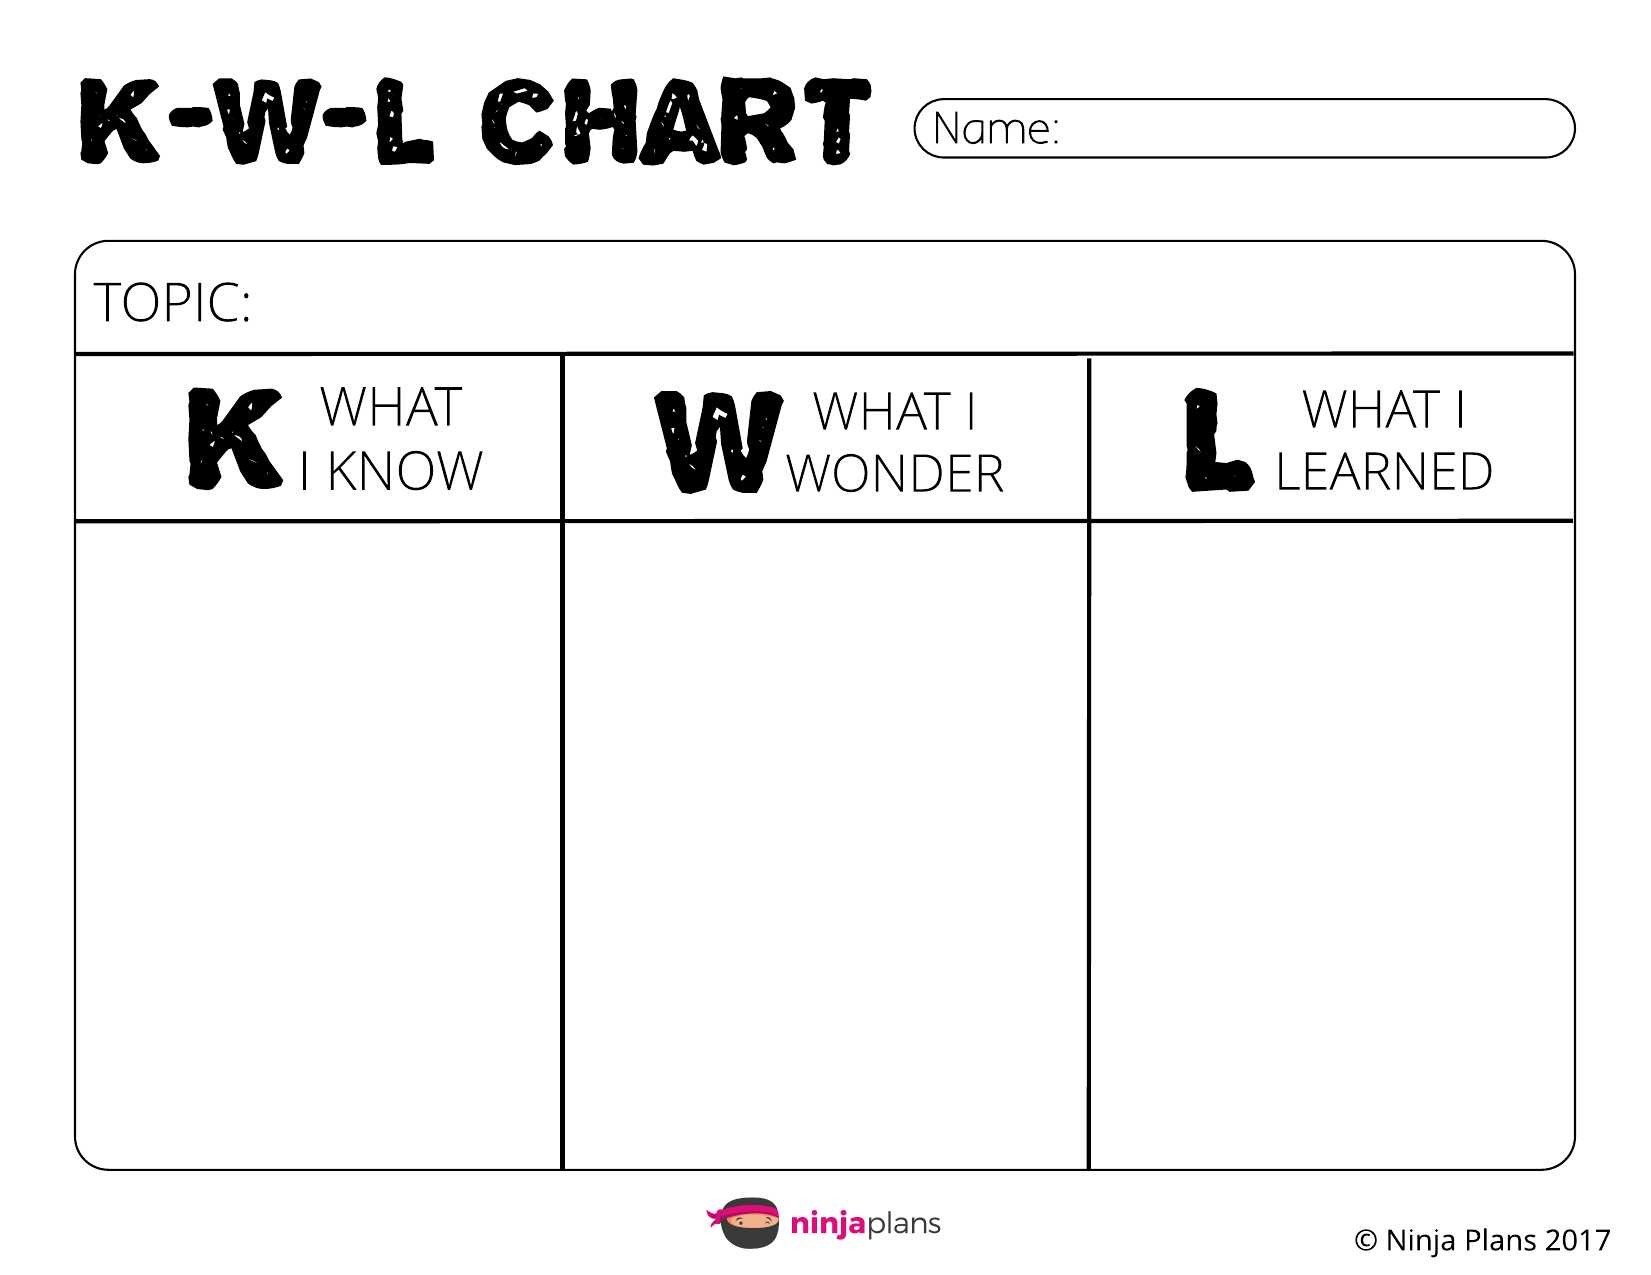
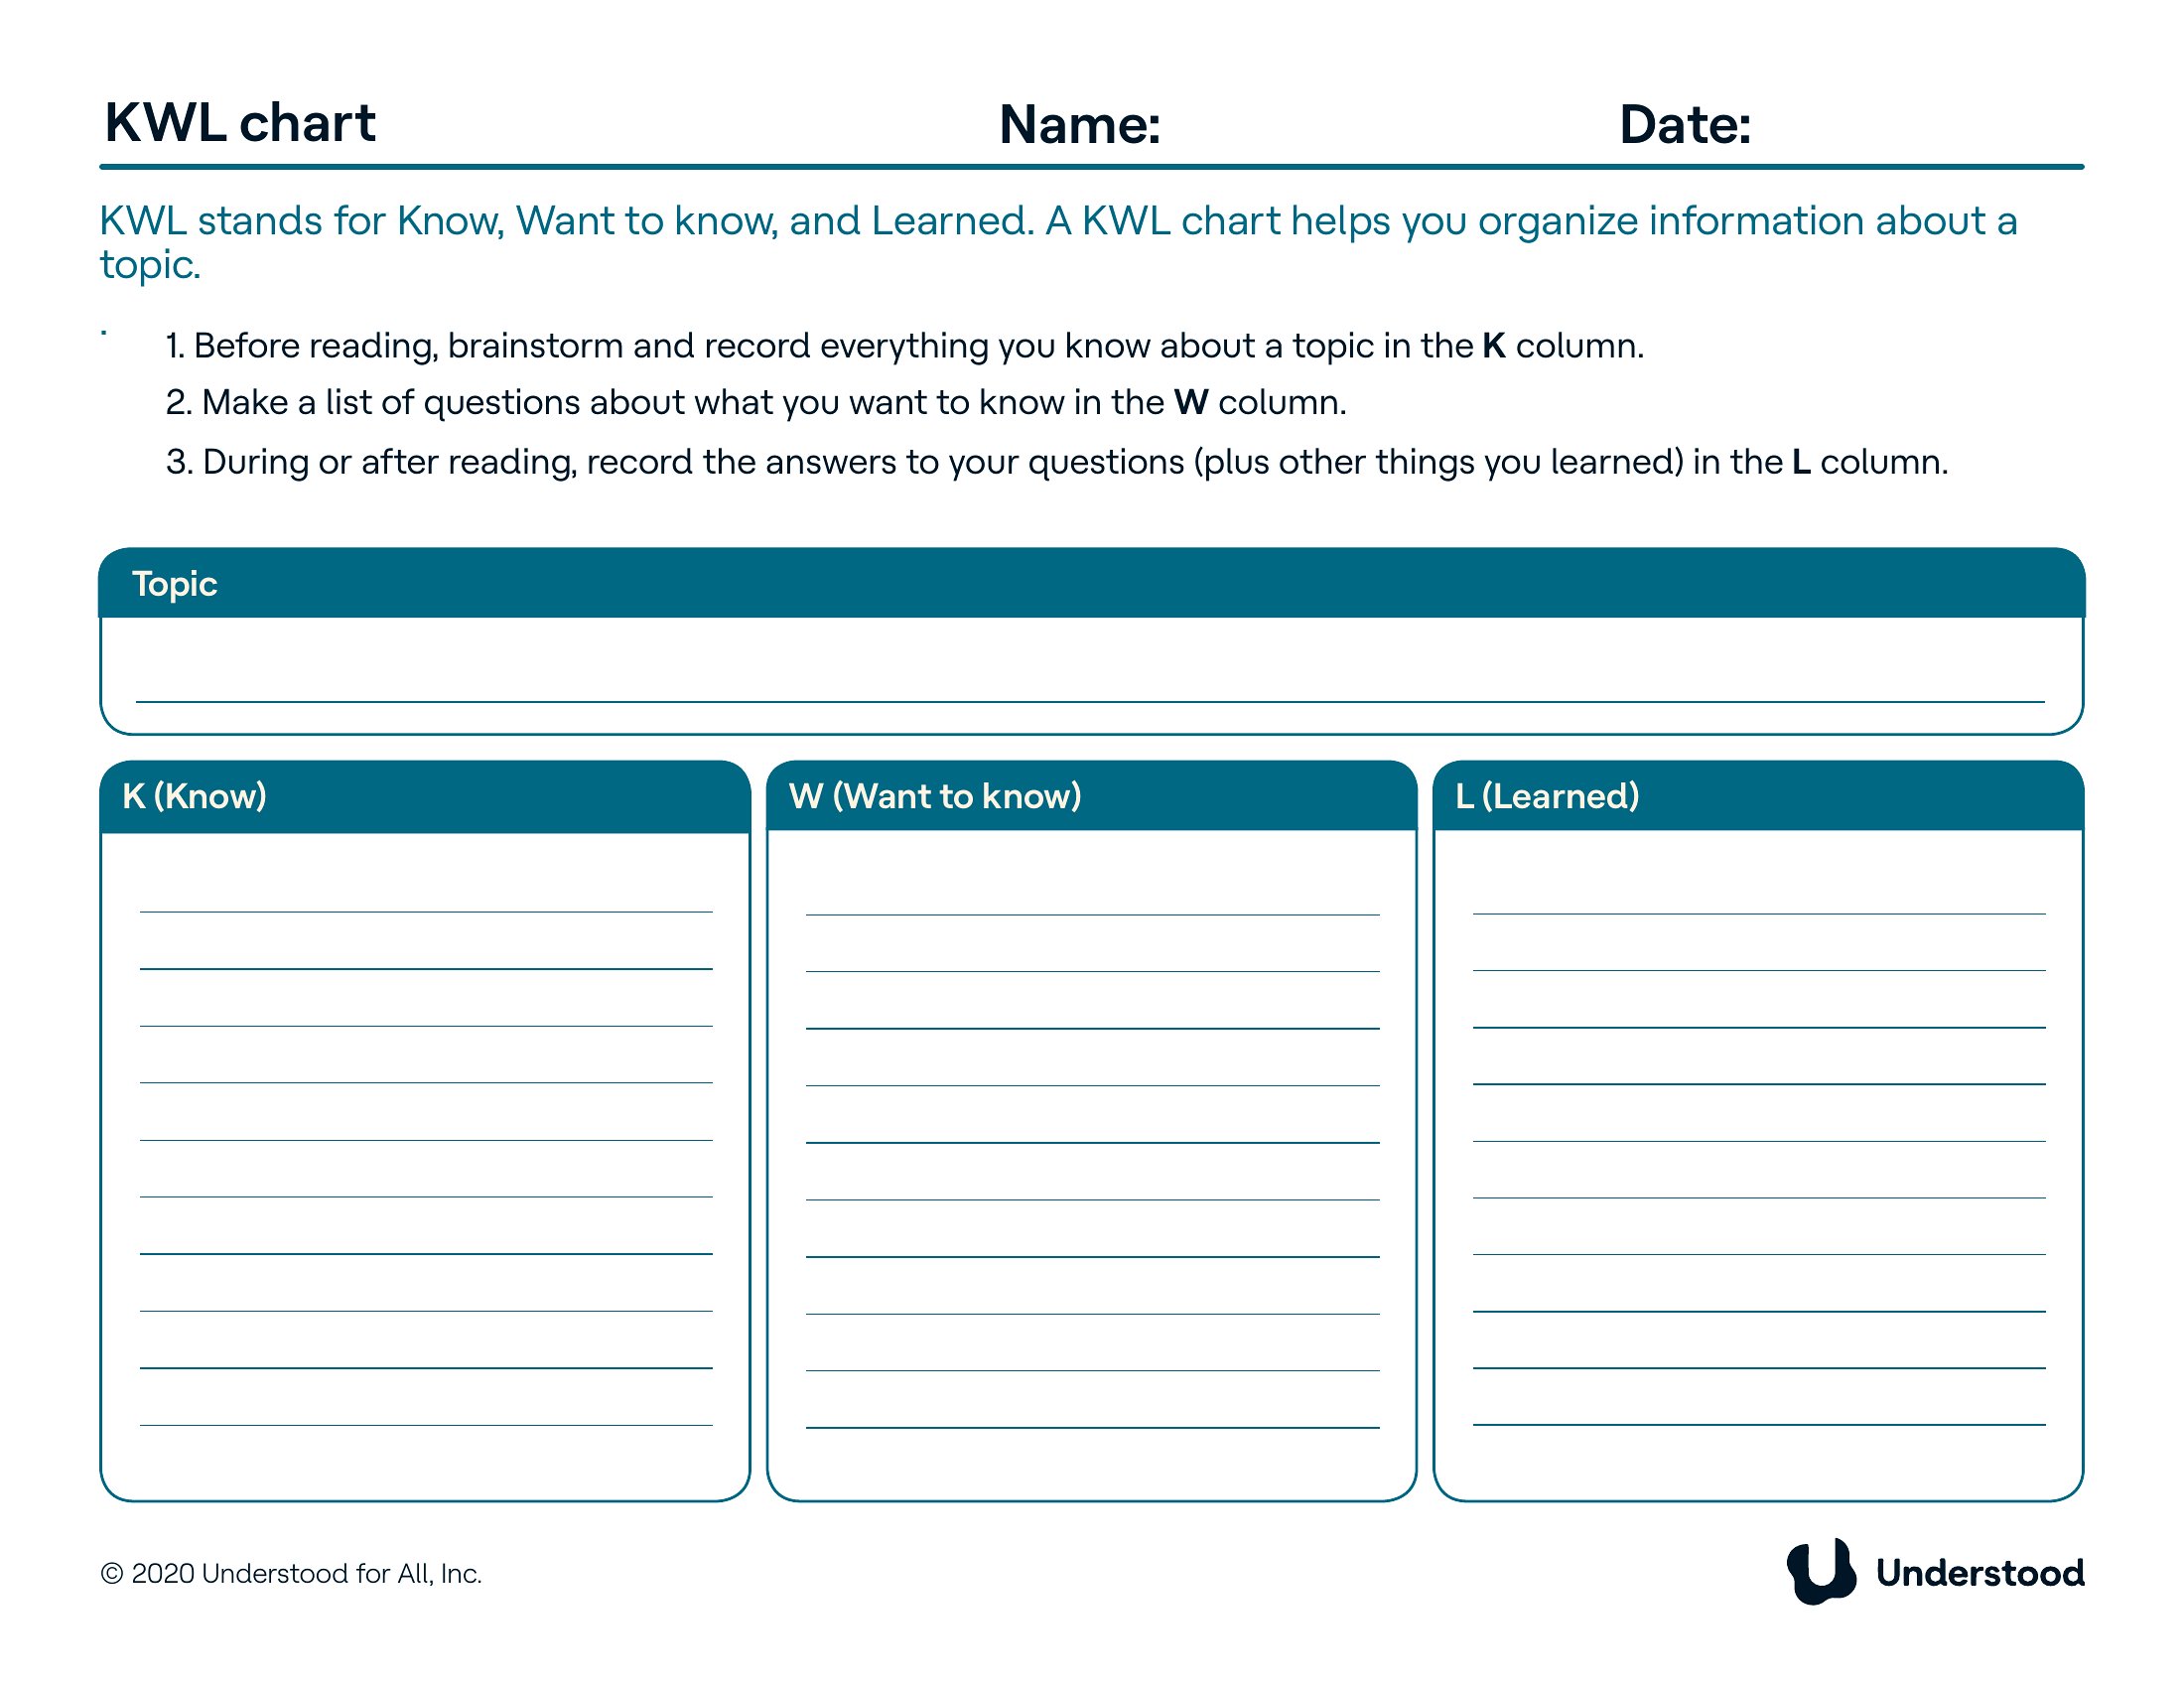
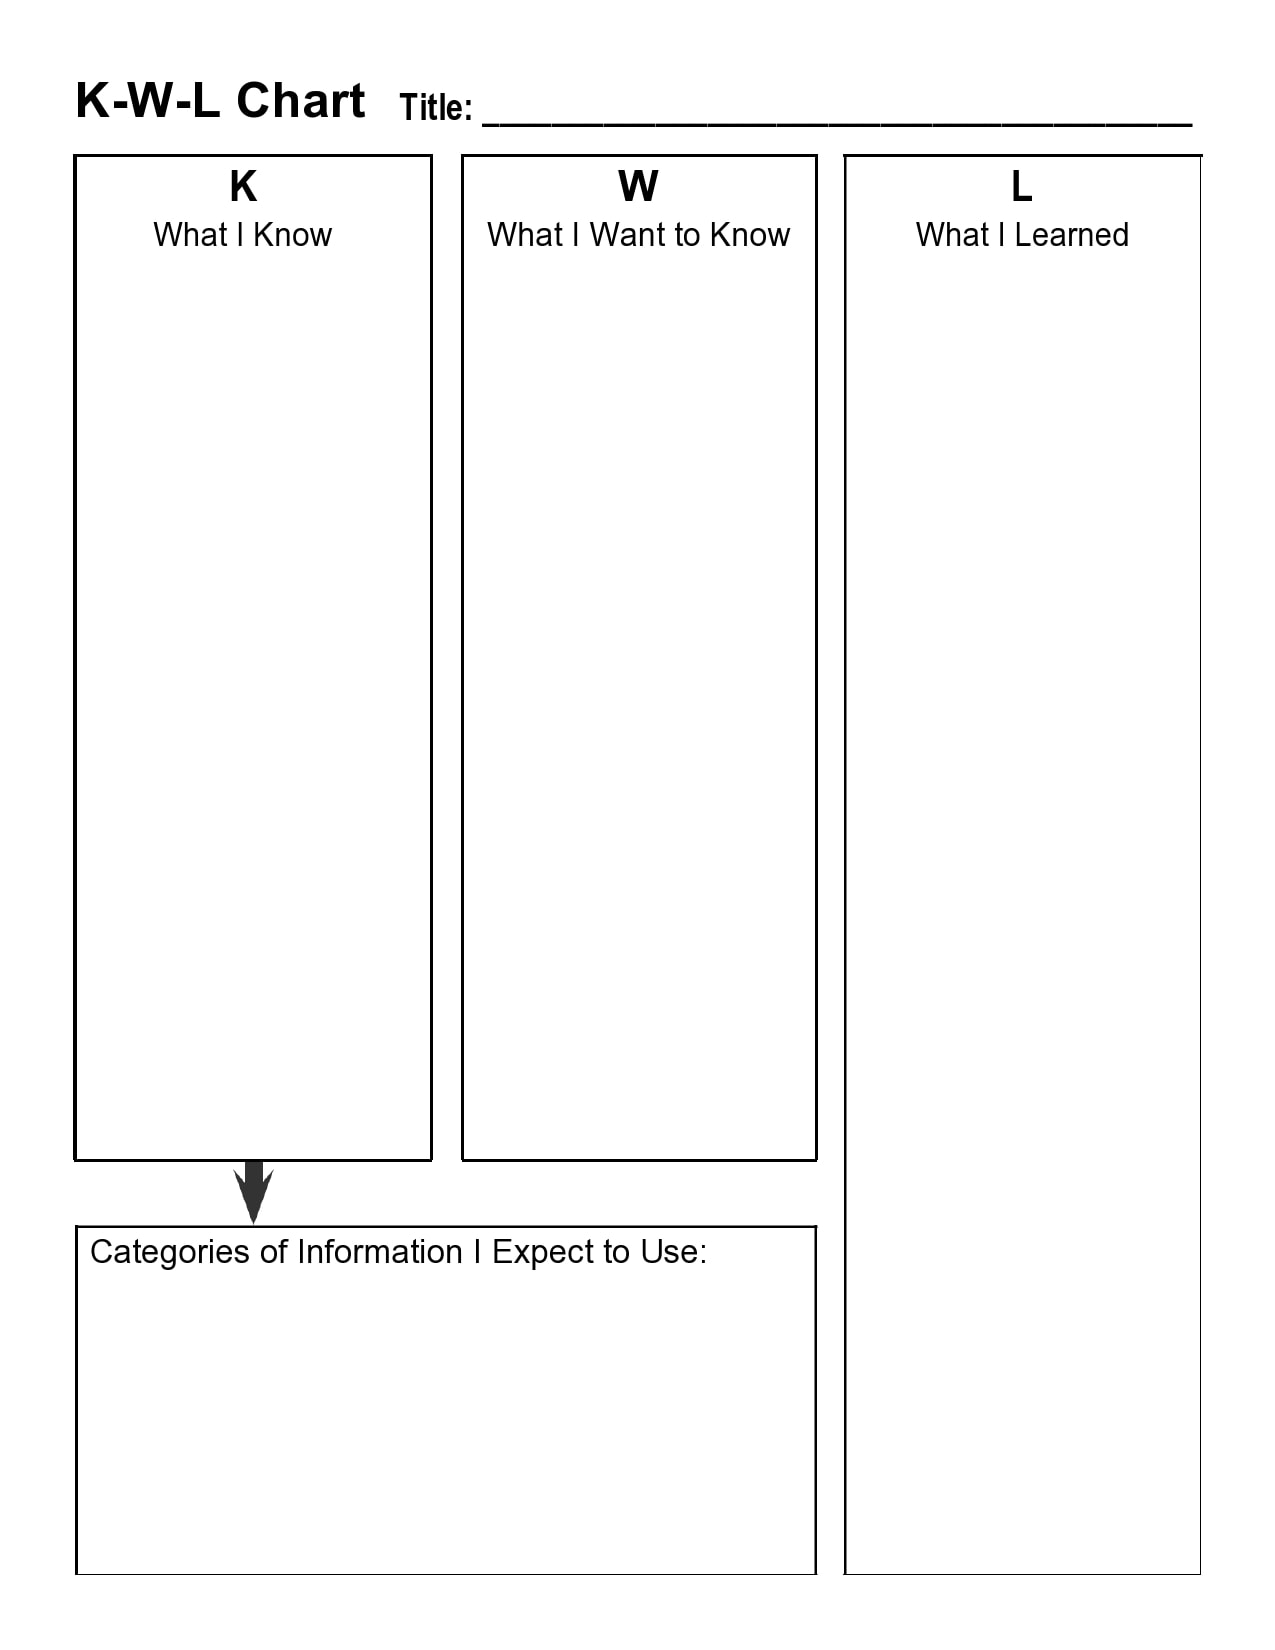
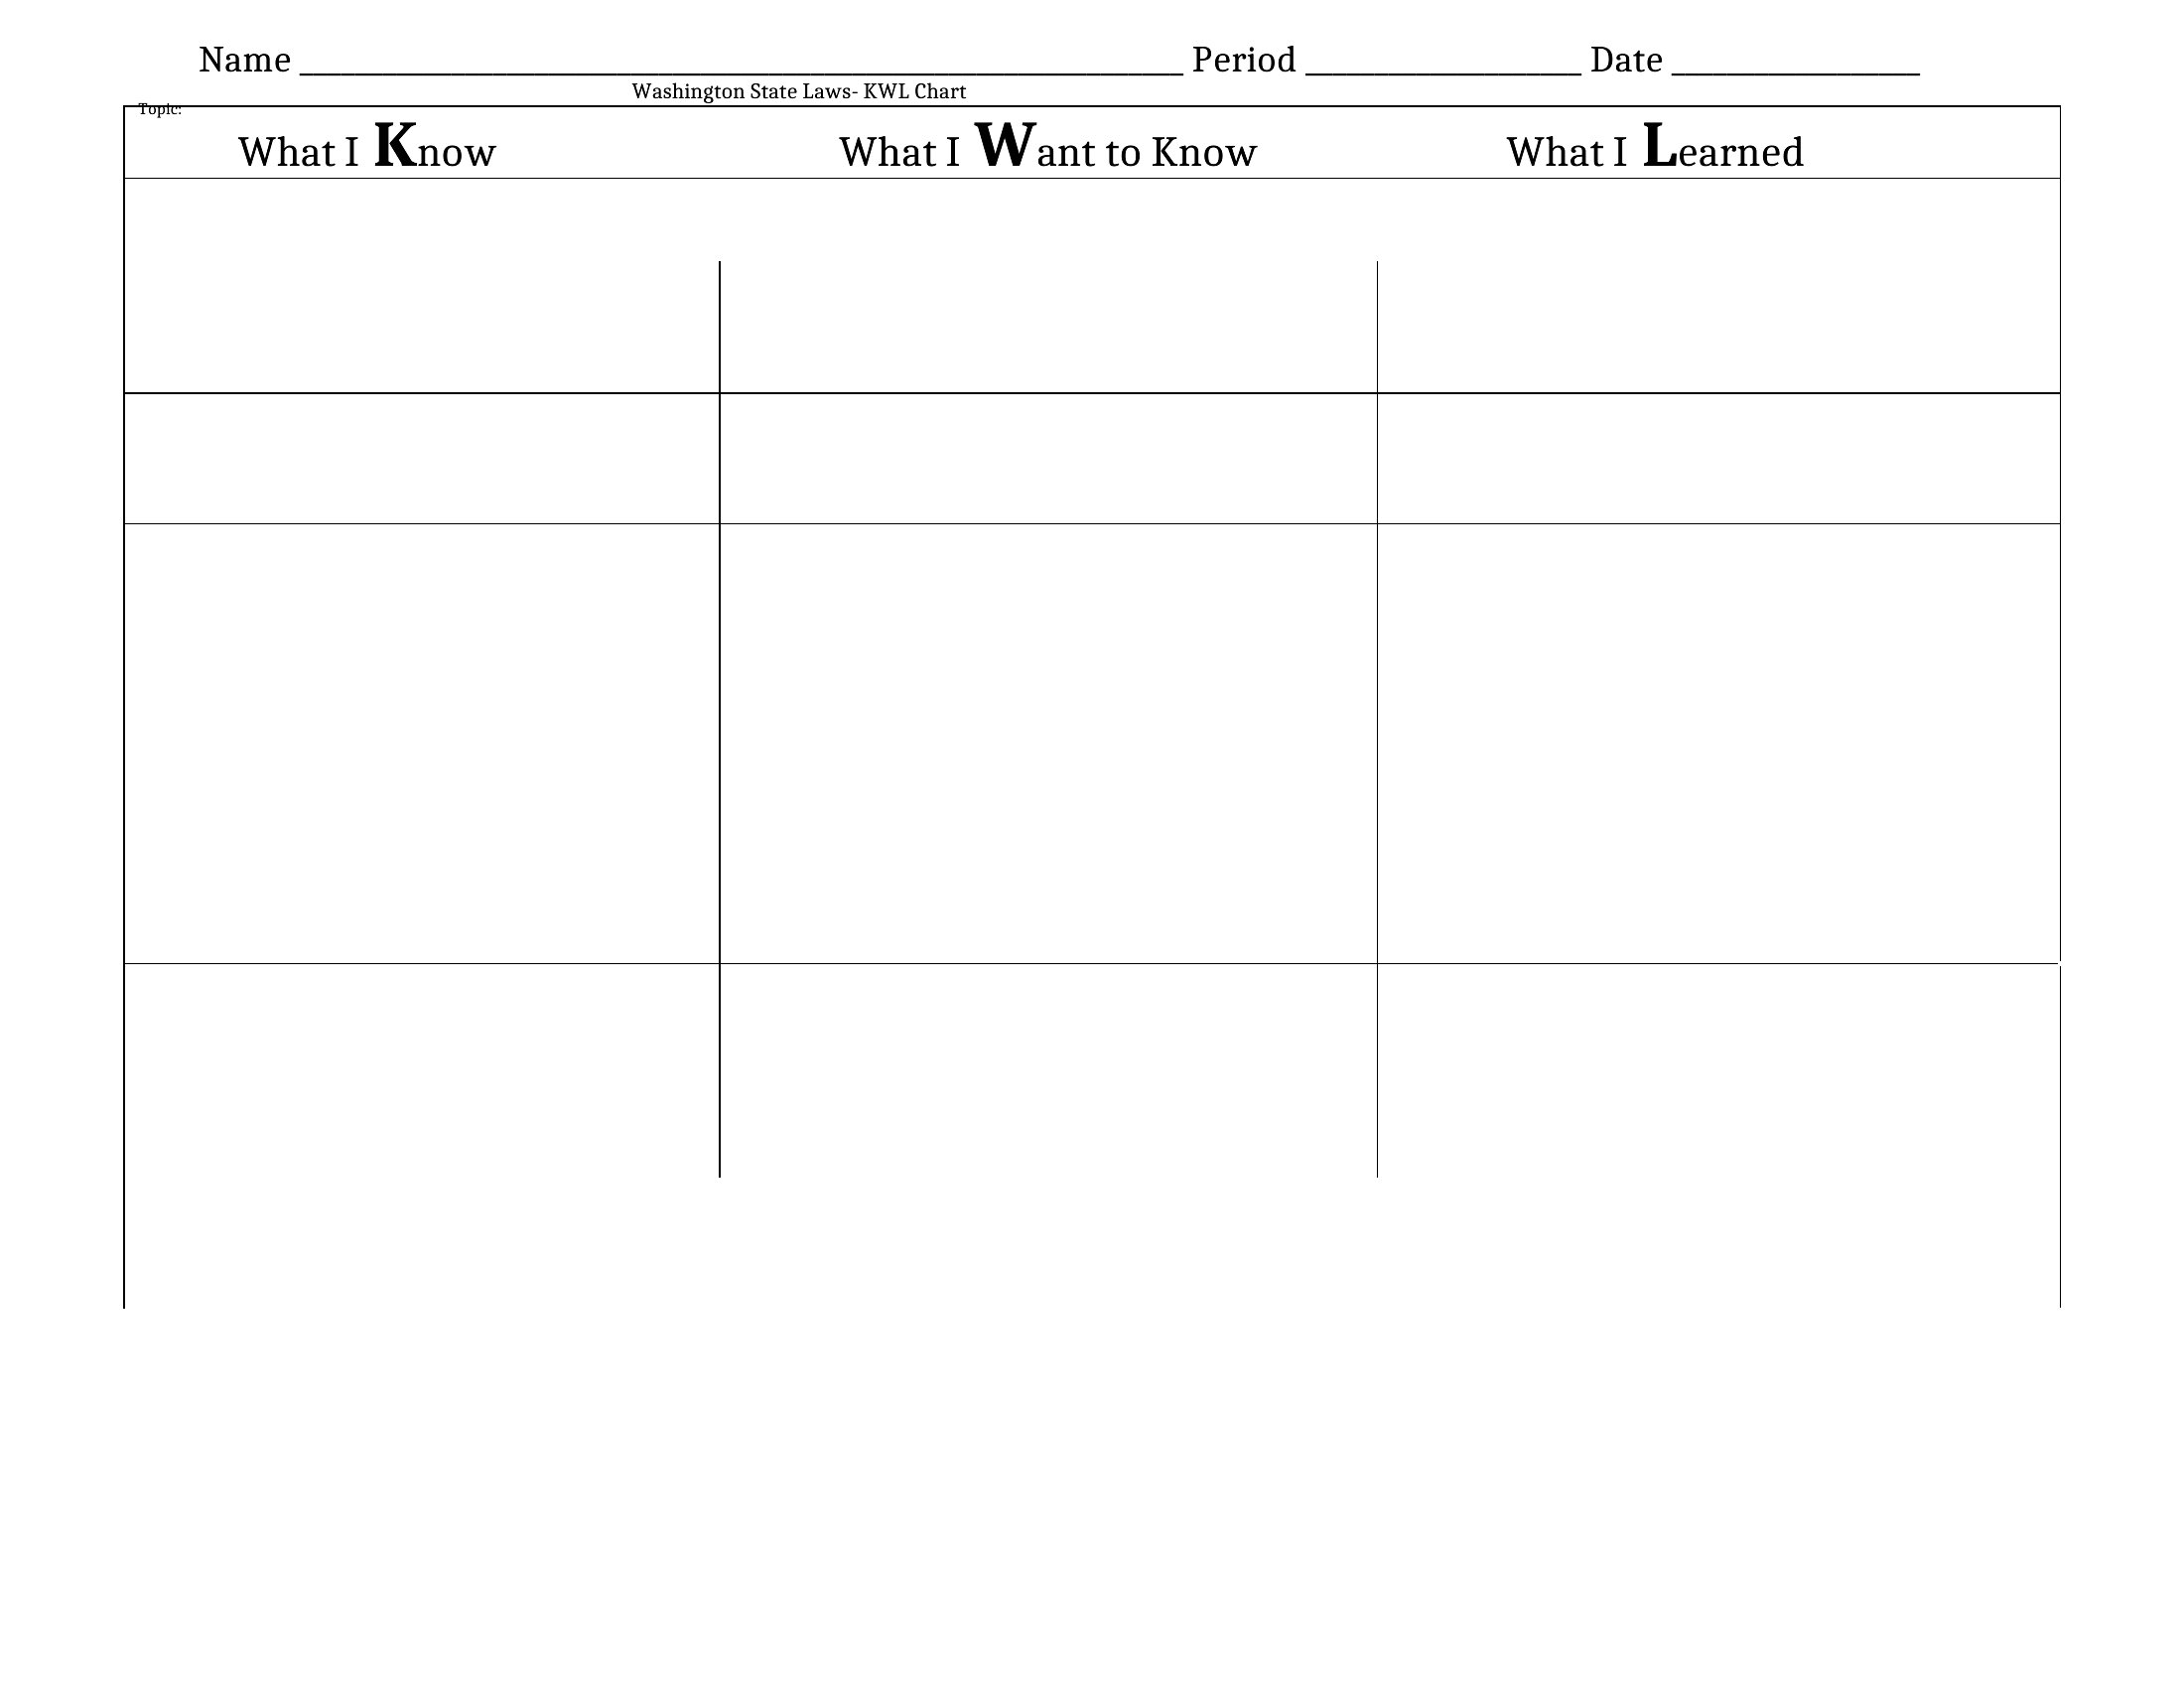
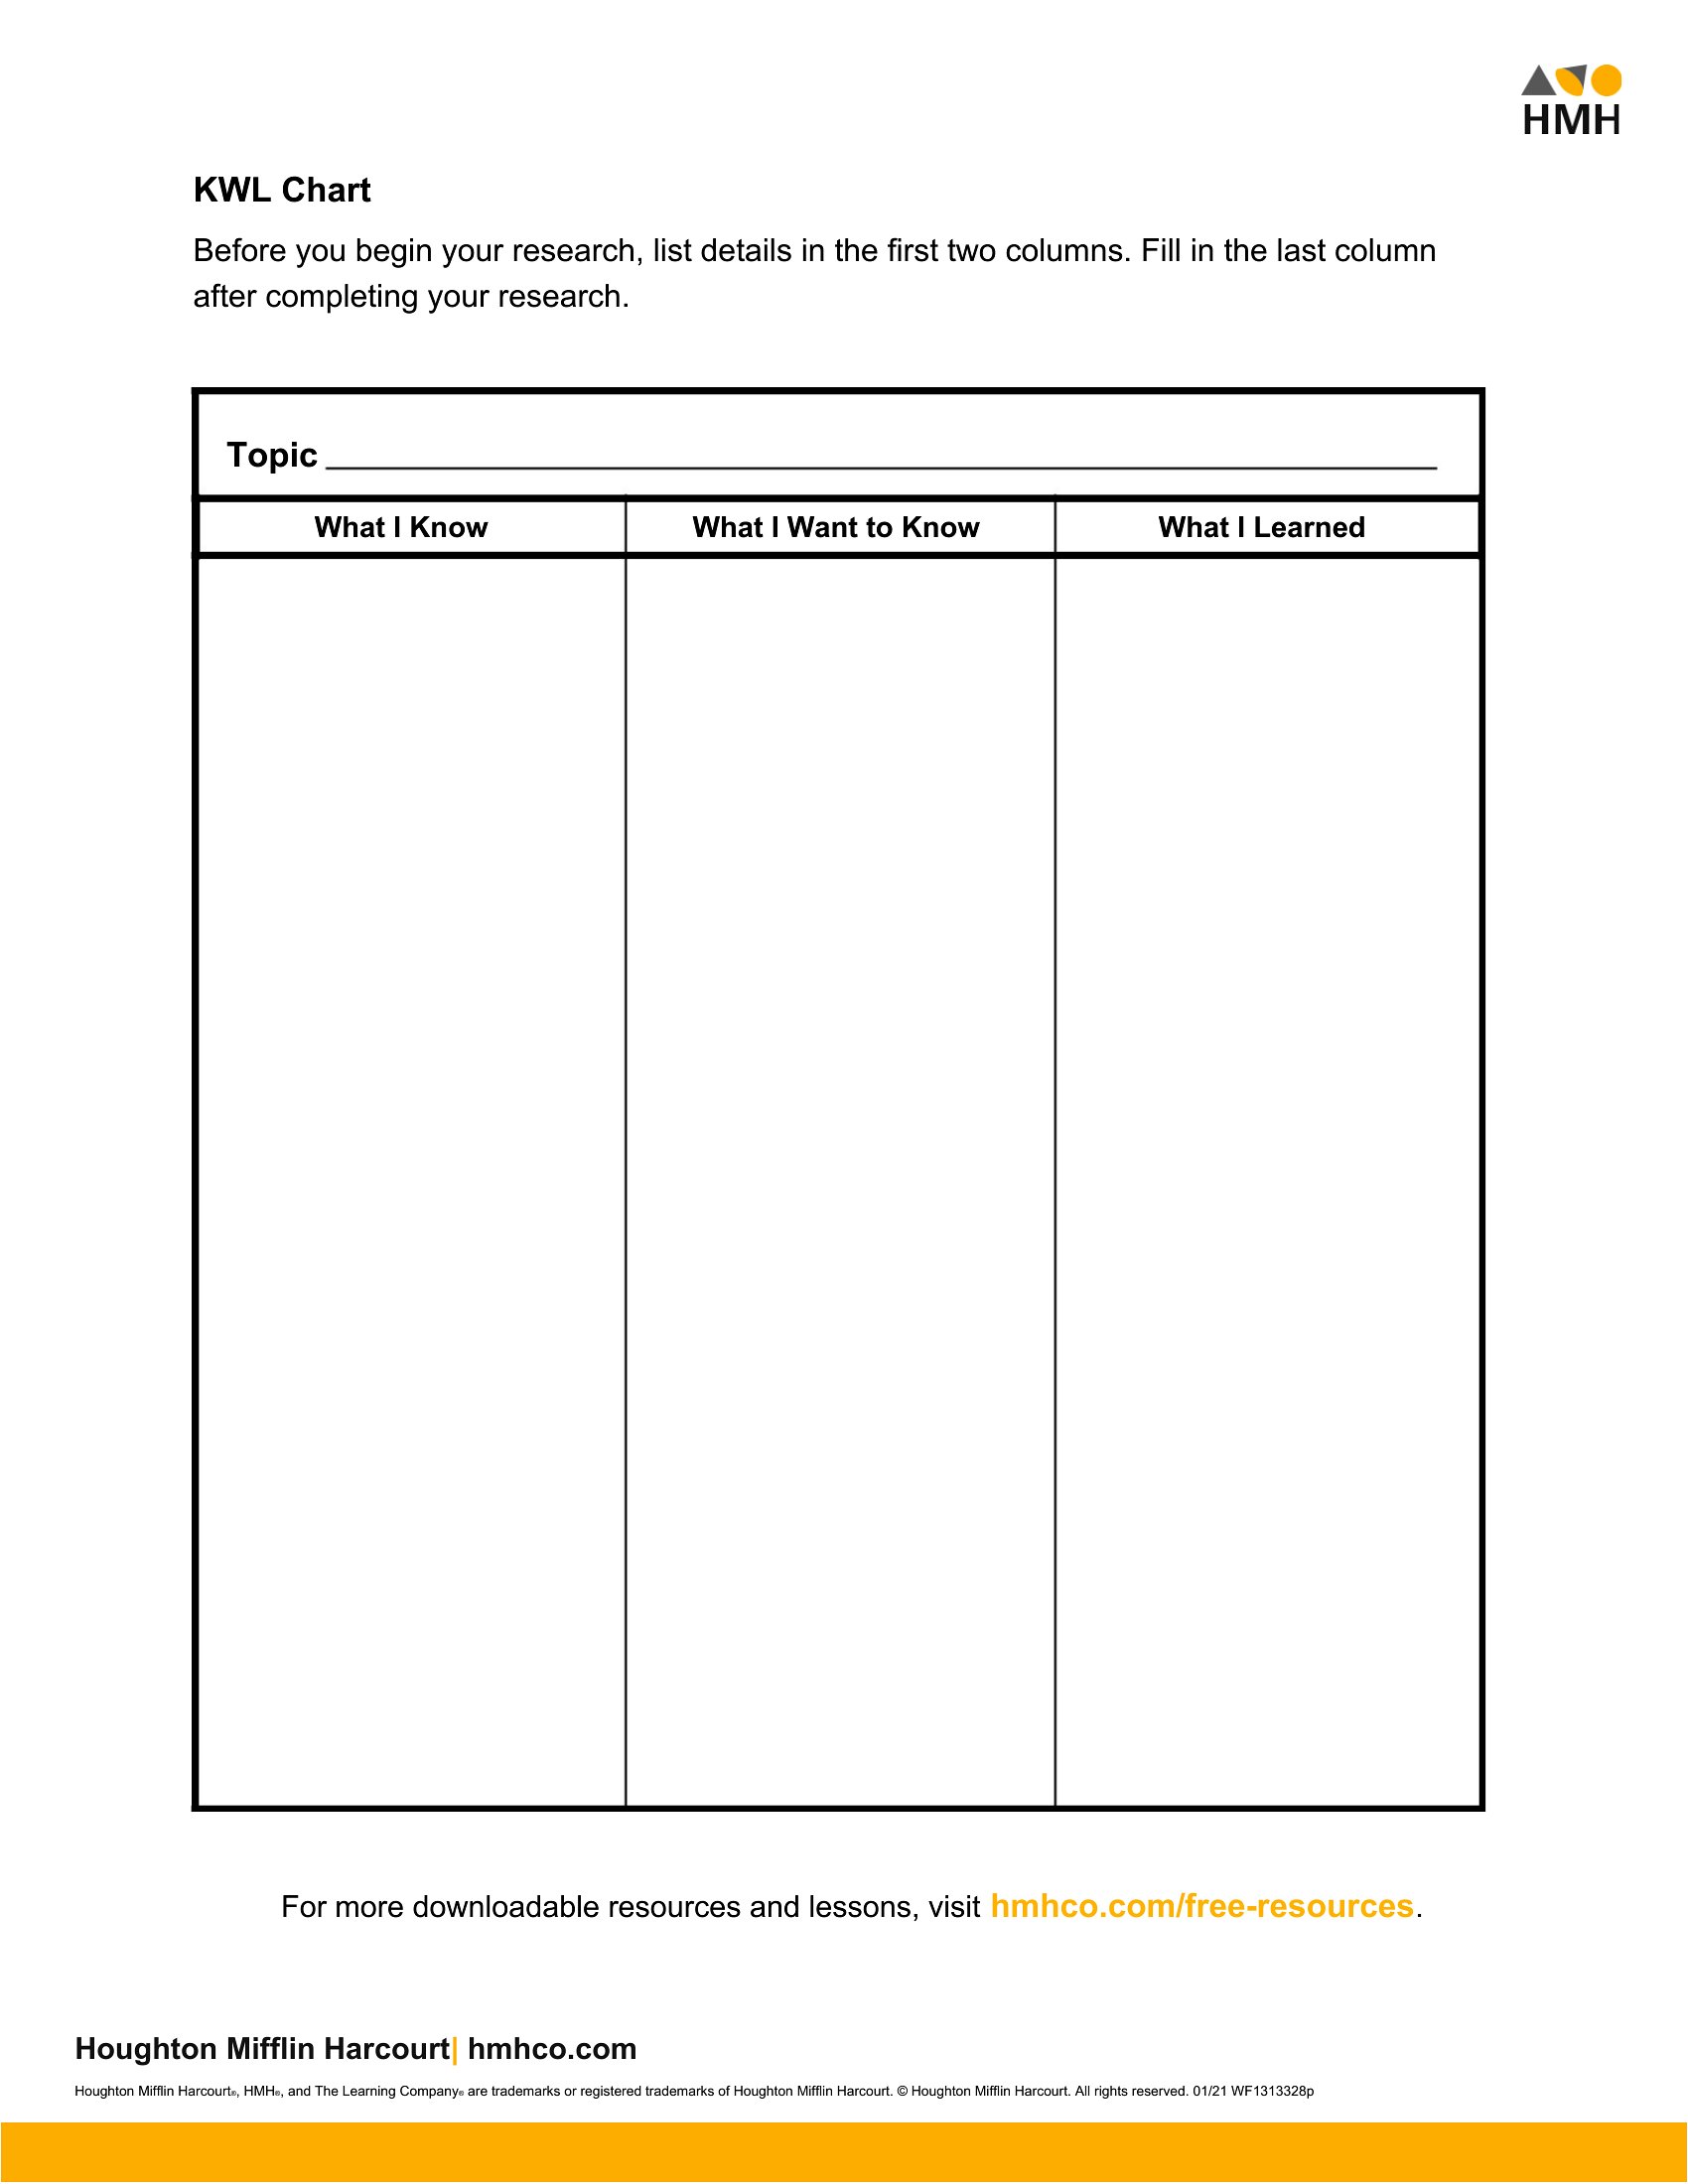
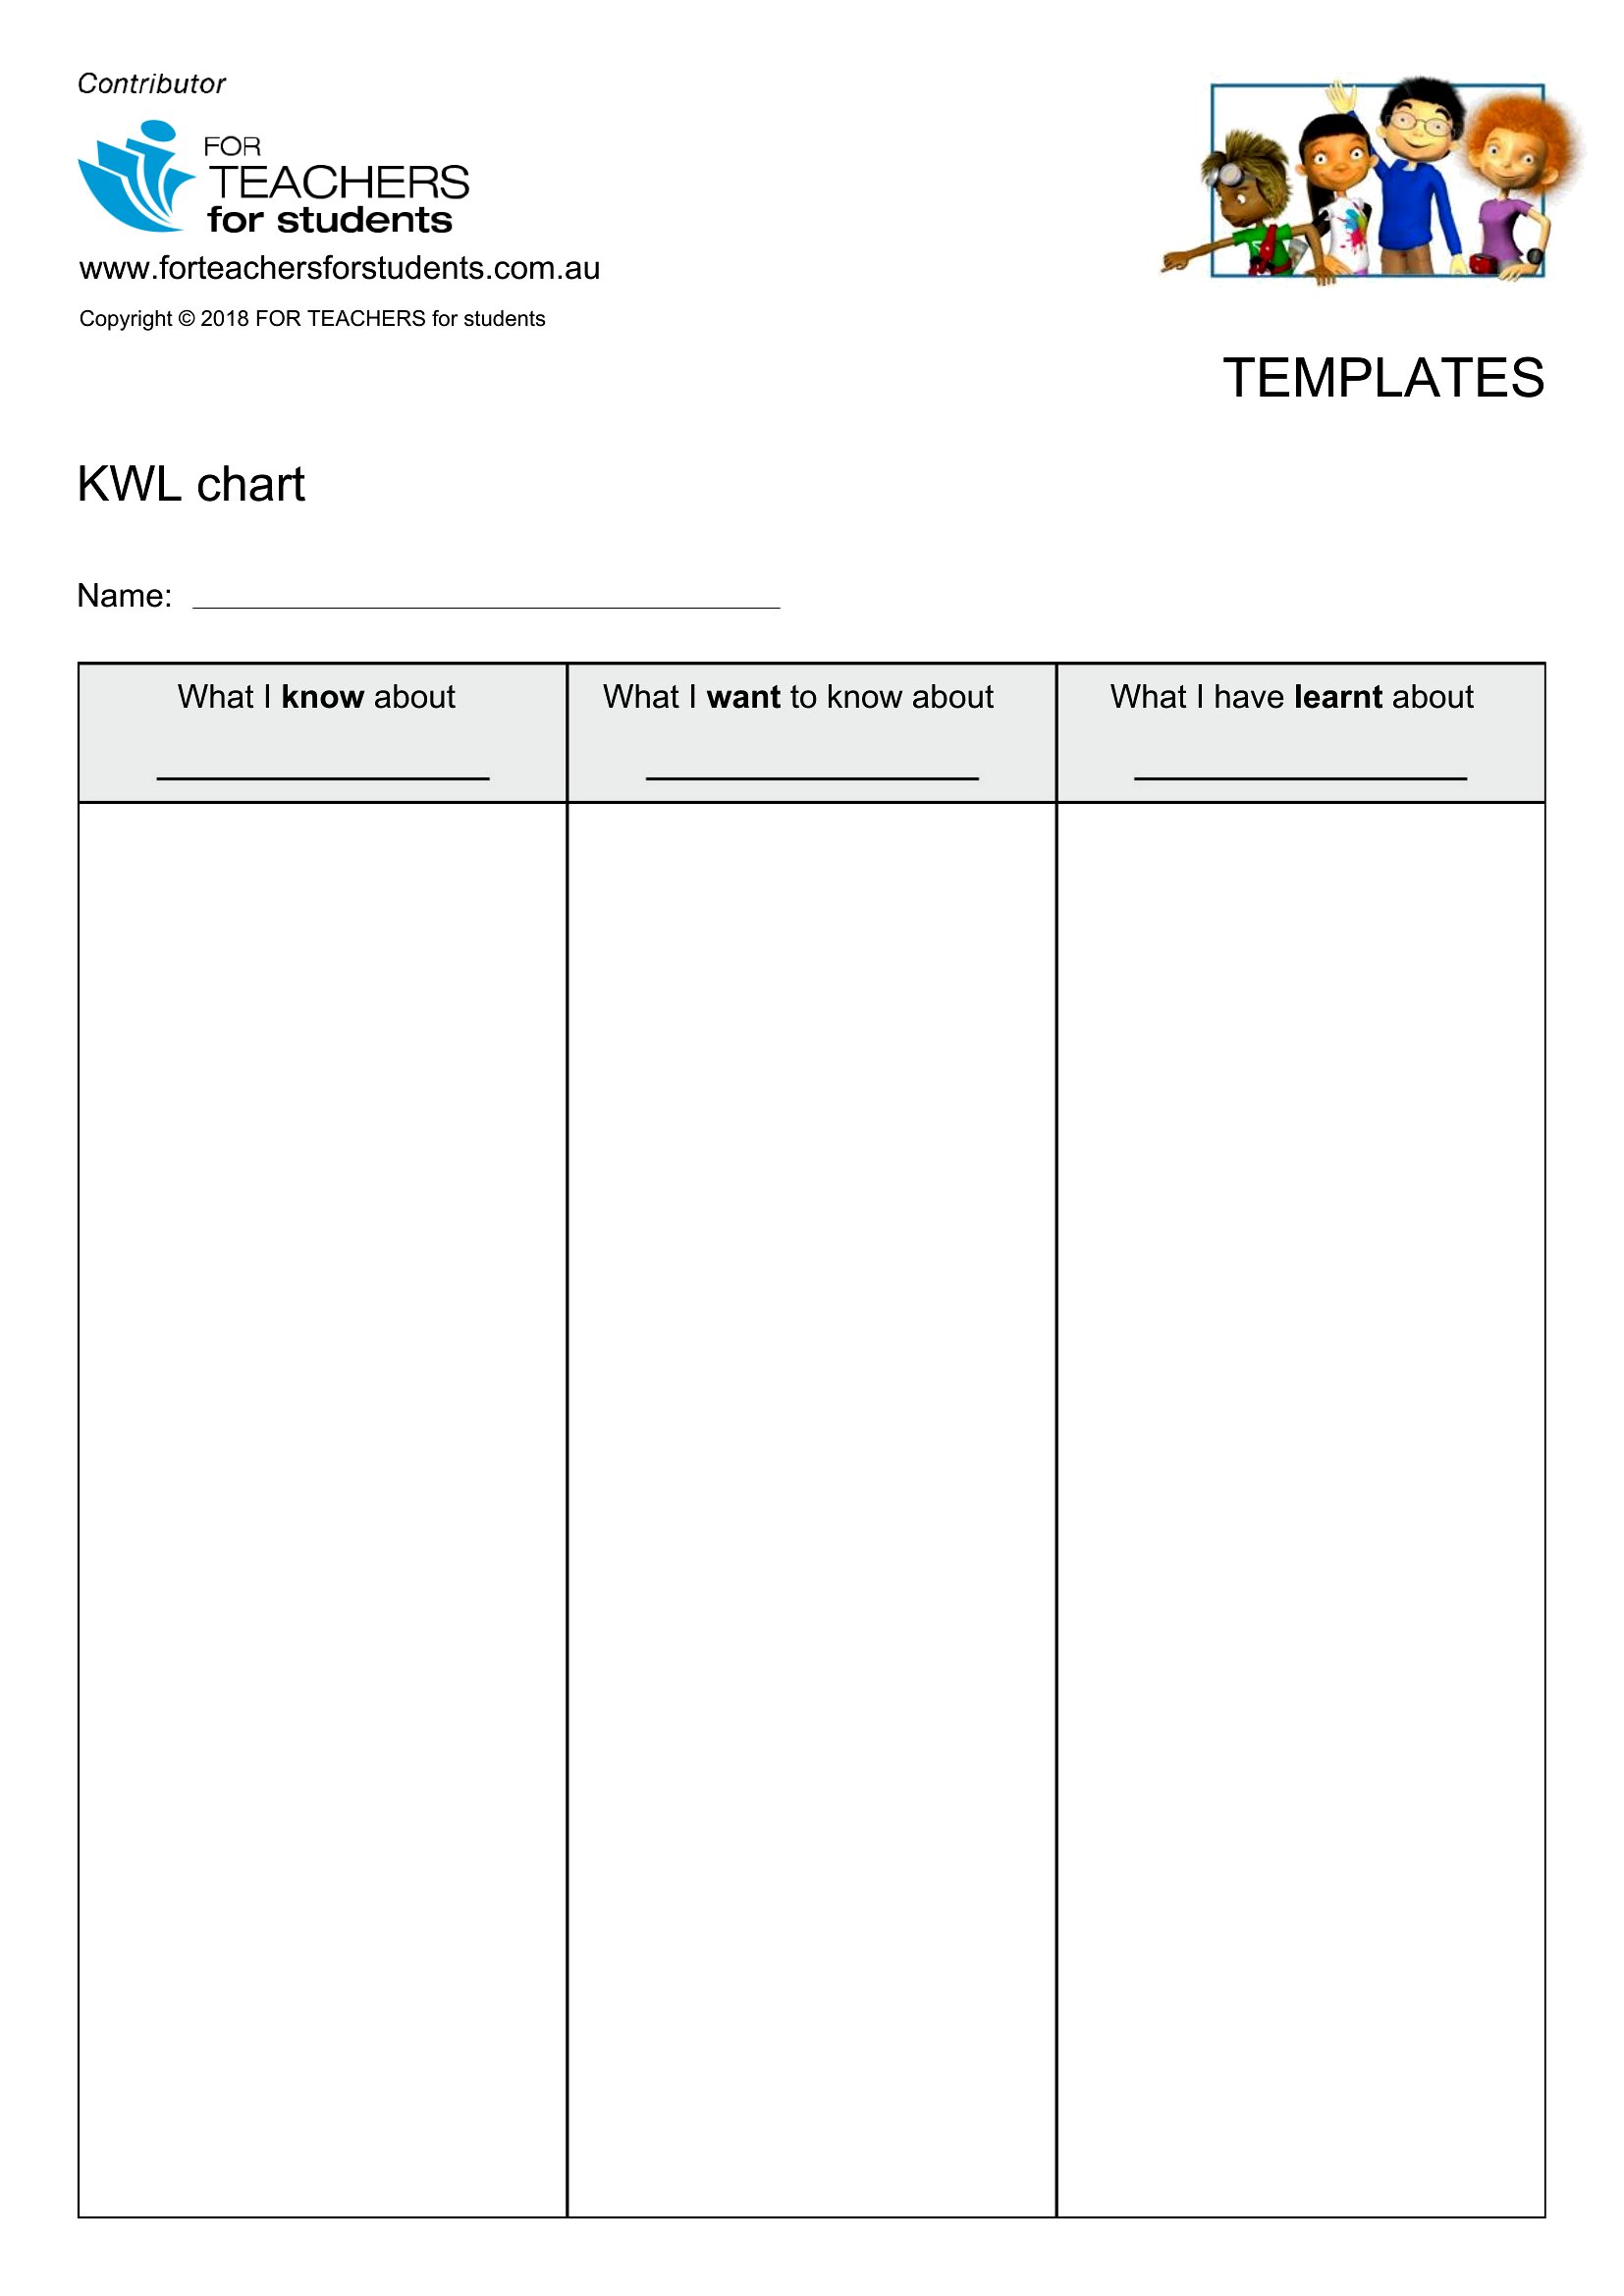
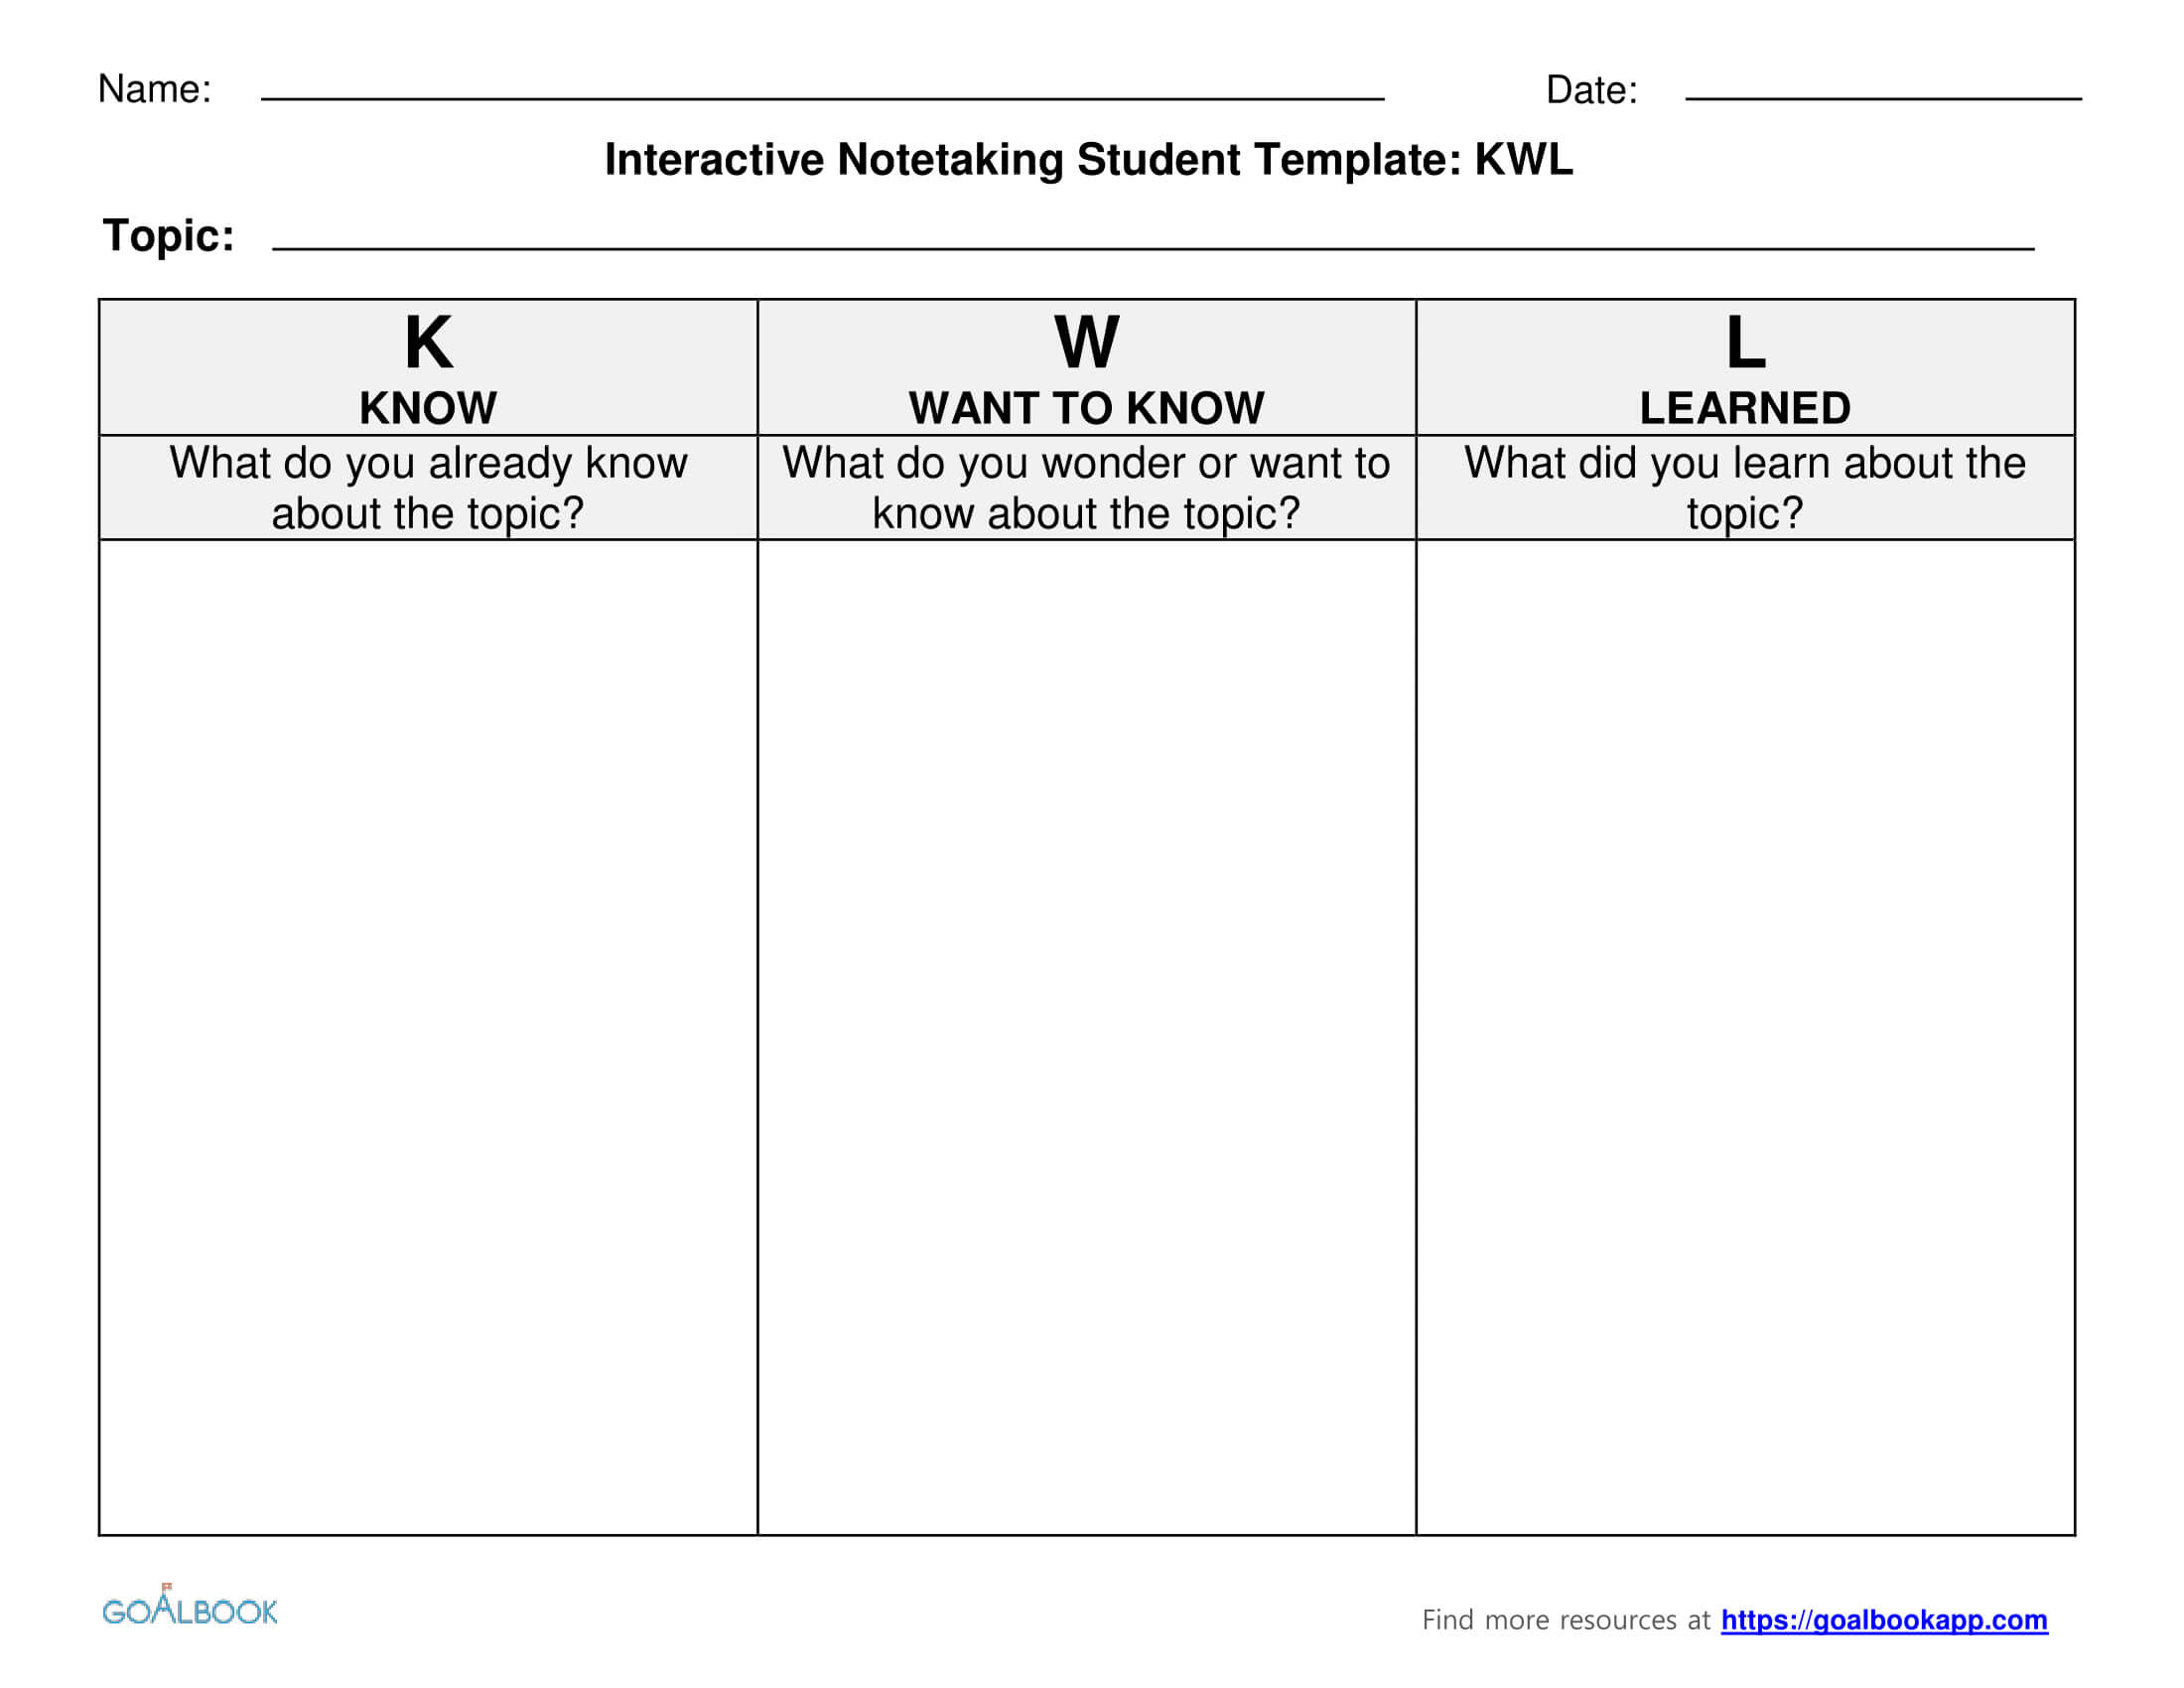
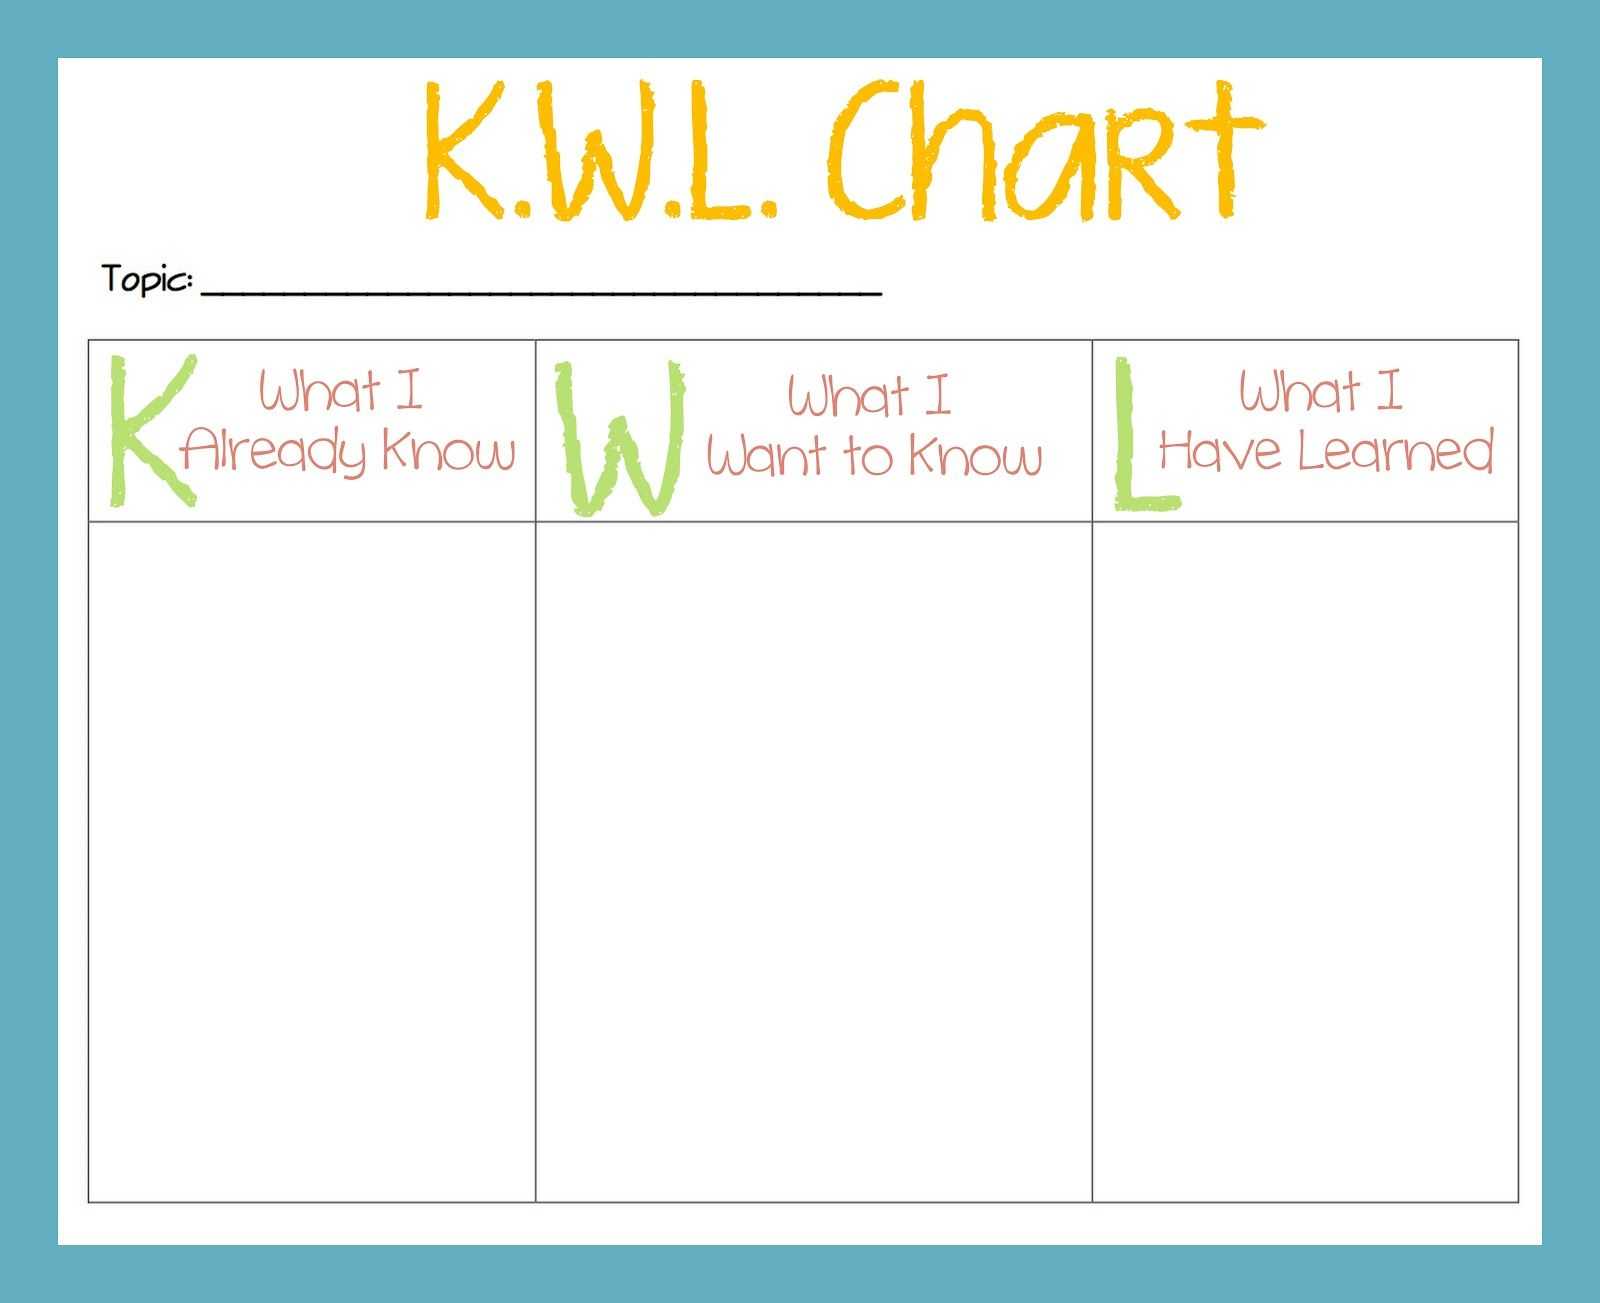
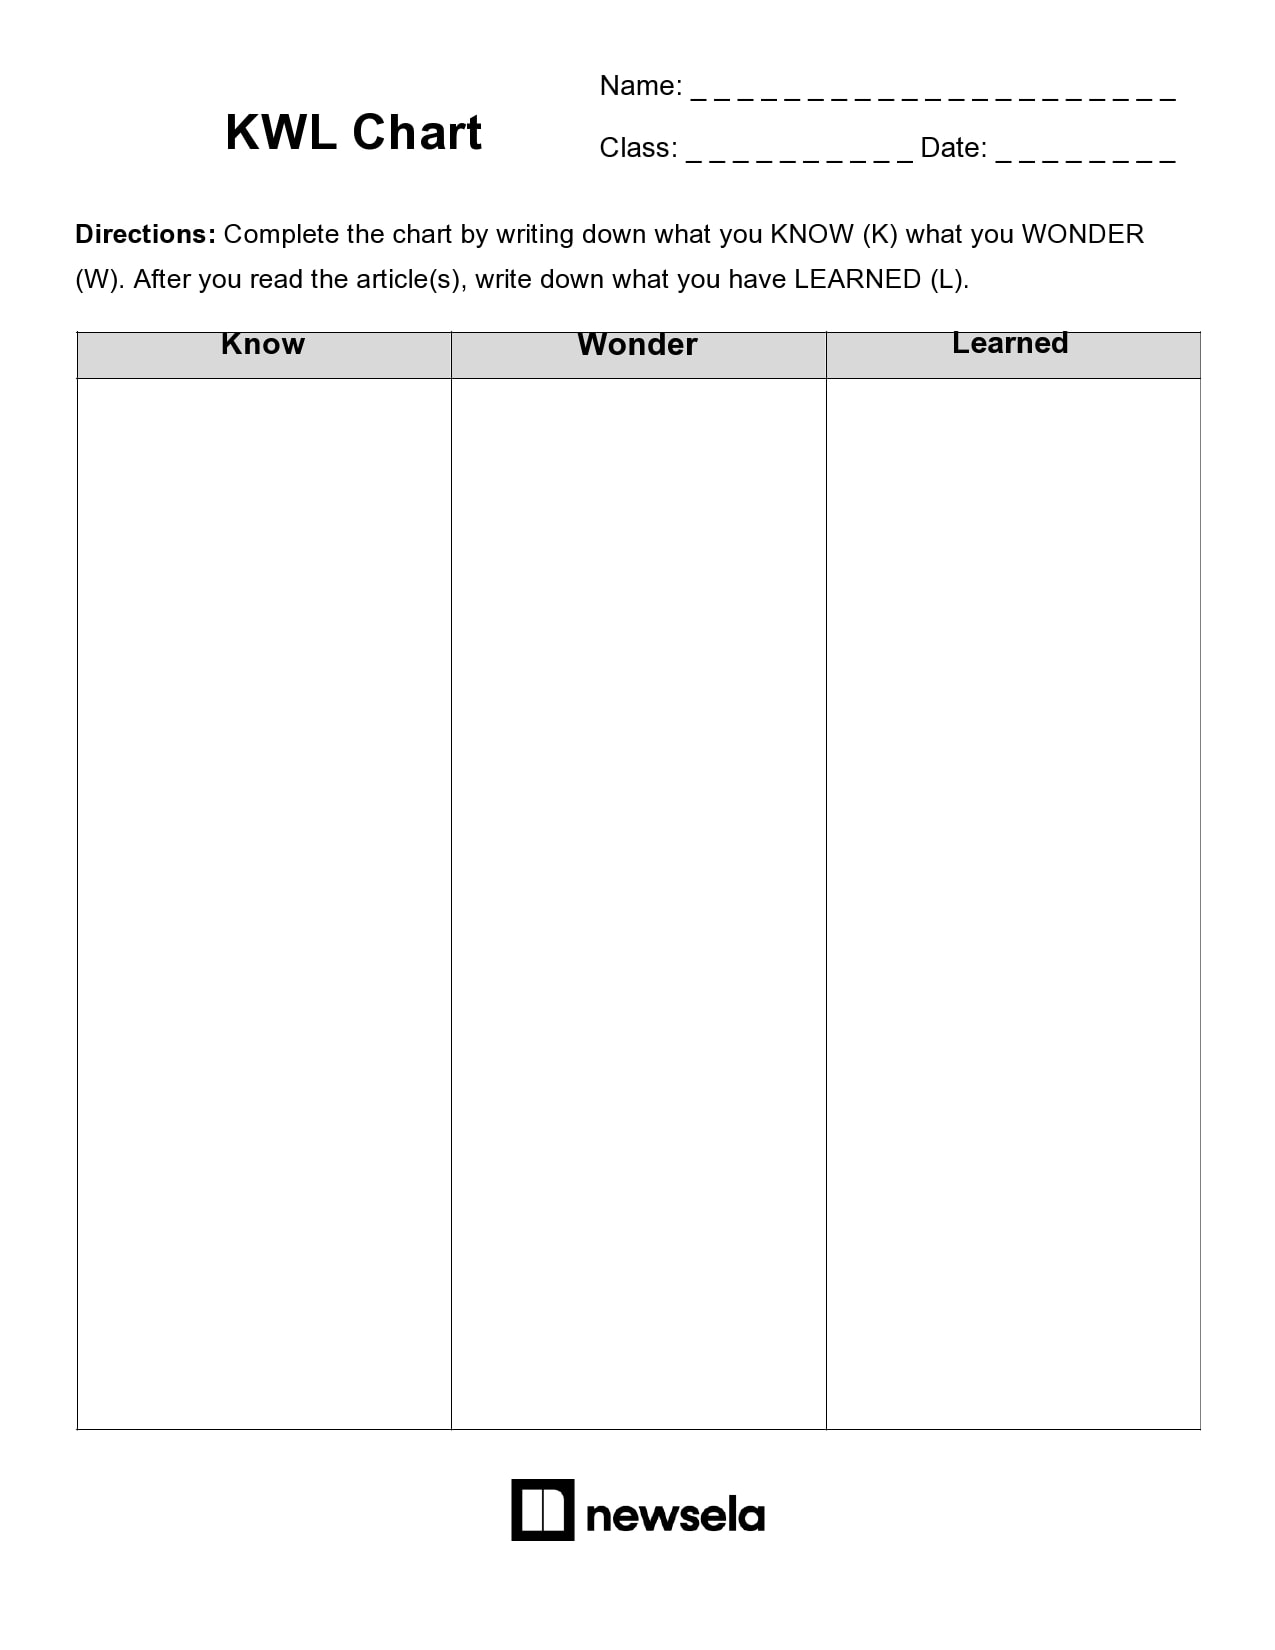
A KWL chart is a three-column worksheet that stands for Know, Want to know, and Learned. The first column captures prior knowledge, the second lists questions or goals, and the third records key insights after instruction. This structure helps students set learning objectives, track progress, and reflect on what they have absorbed.
Why It Matters
Research shows that students who articulate their questions before reading are more likely to comprehend complex concepts. The KWL format turns learning into a dialogue between teacher and student, encouraging curiosity and self-assessment. In classrooms where engagement drops, a well‑designed KWL chart can revitalize the learning process.
Benefits of Using a Word Document KWL Chart

Easy Accessibility
Word documents are universally available, allowing teachers to share templates via email, LMS, or cloud storage. Students can download, print, or fill the chart digitally on laptops or tablets, making it flexible for varied learning environments.
Customizability
Unlike rigid printable worksheets, a Word template lets educators insert subject‑specific titles, images, or color schemes. This flexibility keeps the chart relevant across subjects—from history to science to art—without starting from scratch each time.
Immediate Feedback Loop
Students can compare the “Learned” column against their original questions immediately after a lesson. This instant reflection reinforces retention and encourages metacognitive habits that carry over to other assignments.
Teacher‑Friendly Analytics
When students submit their charts electronically, teachers can quickly scan the “Want to know” column to gauge misconceptions or gaps. This data informs targeted instruction and helps differentiate learning paths.
How to Create a KWL Chart Template in Word
Step 1: Set Up the Table
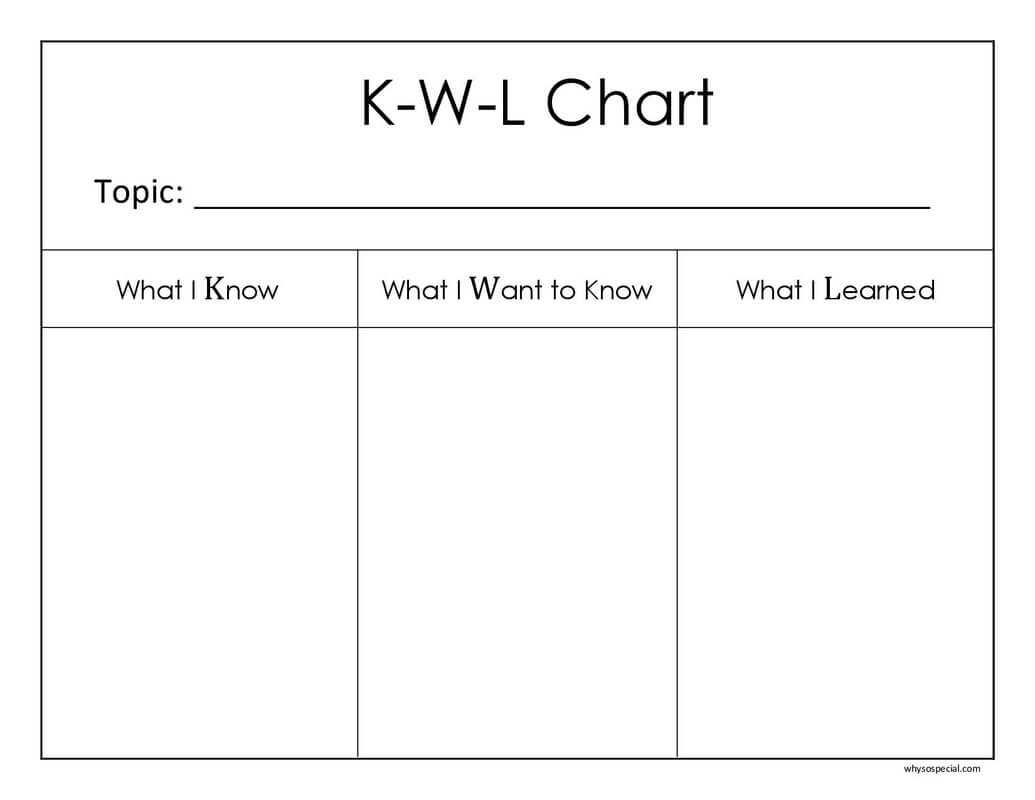
Open a new Word document and go to Insert > Table. Choose three columns and five rows for a basic layout. The first row will serve as the header, and the remaining rows provide space for student entries.
Step 2: Label the Columns
Click the first cell in the header row and type “Know.” Press TAB to move to the next cell and type “Want to know.” Repeat for the third cell, entering “Learned.” Center the text and apply a bold style for clarity.
Step 3: Add Visual Cues
To make the chart visually distinct, apply a subtle background color to the header cells. Use a light gray or a pastel hue that does not distract from the content. Add a border around the entire table to create a clean outline.
Step 4: Insert Instructions
Above the table, insert a short instruction paragraph: “Use the KWL chart to guide your learning about this topic. In the Know column, write what you already know. In the Want to know column, list questions you hope to answer. After the lesson, fill in the Learned column with key takeaways.” Format the text in italics to differentiate it from the chart.
Step 5: Save as a Template
Once the chart looks polished, go to File > Save As. Choose “Word Template (*.dotx)” from the file type options. Save it in a shared folder so all teachers can access the same template, ensuring consistency across classes.
Step 6: Create a Printable Version
If students need a hard copy, insert a page break after the instruction paragraph and add a duplicate table below. This layout lets teachers print one copy per student while retaining the digital version for submission.
Customizing Your KWL Chart for Different Subjects
Science Projects
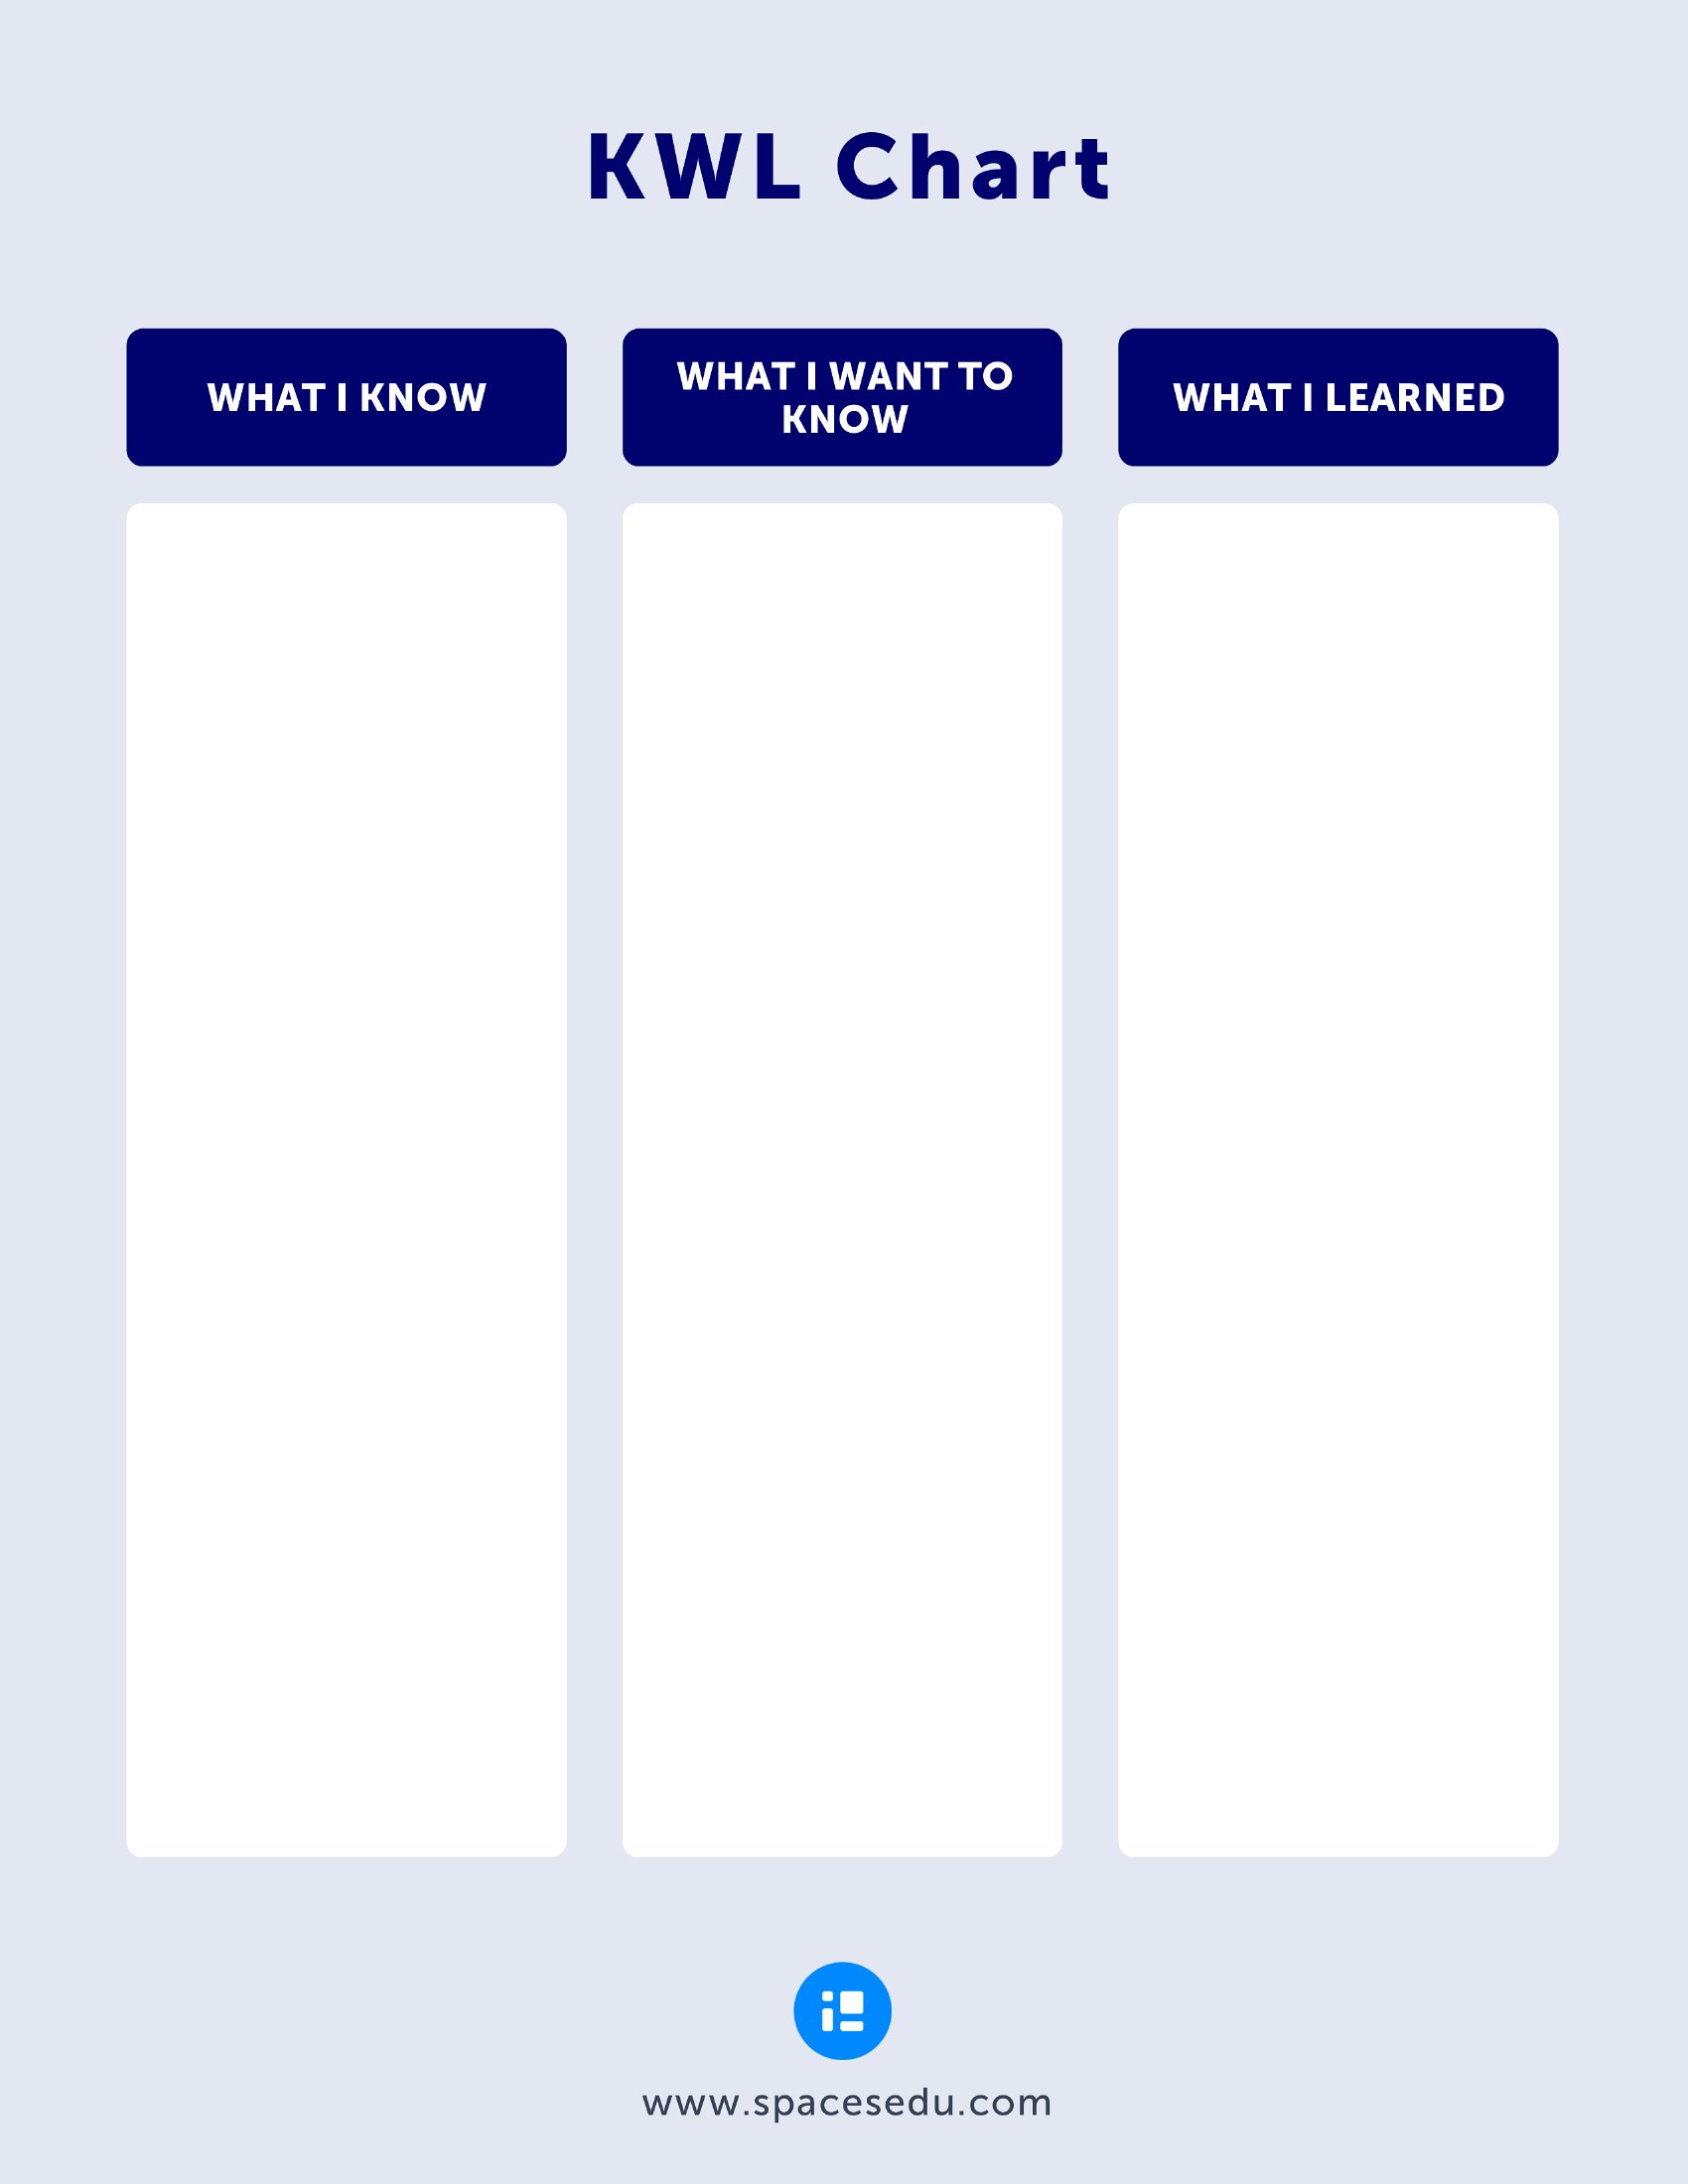
For science, add a column header “Experiment Observations” next to “Learned.” This encourages students to note real‑world data alongside conceptual understanding.
Literature Analysis
Replace the “Learned” column header with “Themes & Symbols” to focus on literary devices. Add a small section under the table for students to write a brief reflection on the narrative.
Social Studies
Insert a footnote area where students can record primary source excerpts or map locations relevant to the topic. This helps link historical content to tangible evidence.
Integrating the KWL Chart into Your Lesson Plan

Pre‑Lesson Activation
Start each lesson by handing out the KWL chart. Encourage students to brainstorm in the “Know” column while you provide contextual clues. This primes their minds for new information.
During Instruction
Refer back to the “Want to know” column periodically. For each question, pause to address the point, allowing students to see their curiosity satisfied. This keeps the lesson interactive and student‑centered.
Post‑Lesson Reflection
After covering the material, ask students to fill in the “Learned” column. Follow up with a group discussion where they compare notes, fostering peer learning and reinforcing key concepts.
Assessment Alignment
Use the completed charts as part of formative assessment. Collect them and check that each student has addressed their initial questions. Provide feedback on depth of reflection and clarity of insights.
Common Mistakes to Avoid
Leaving Columns Empty
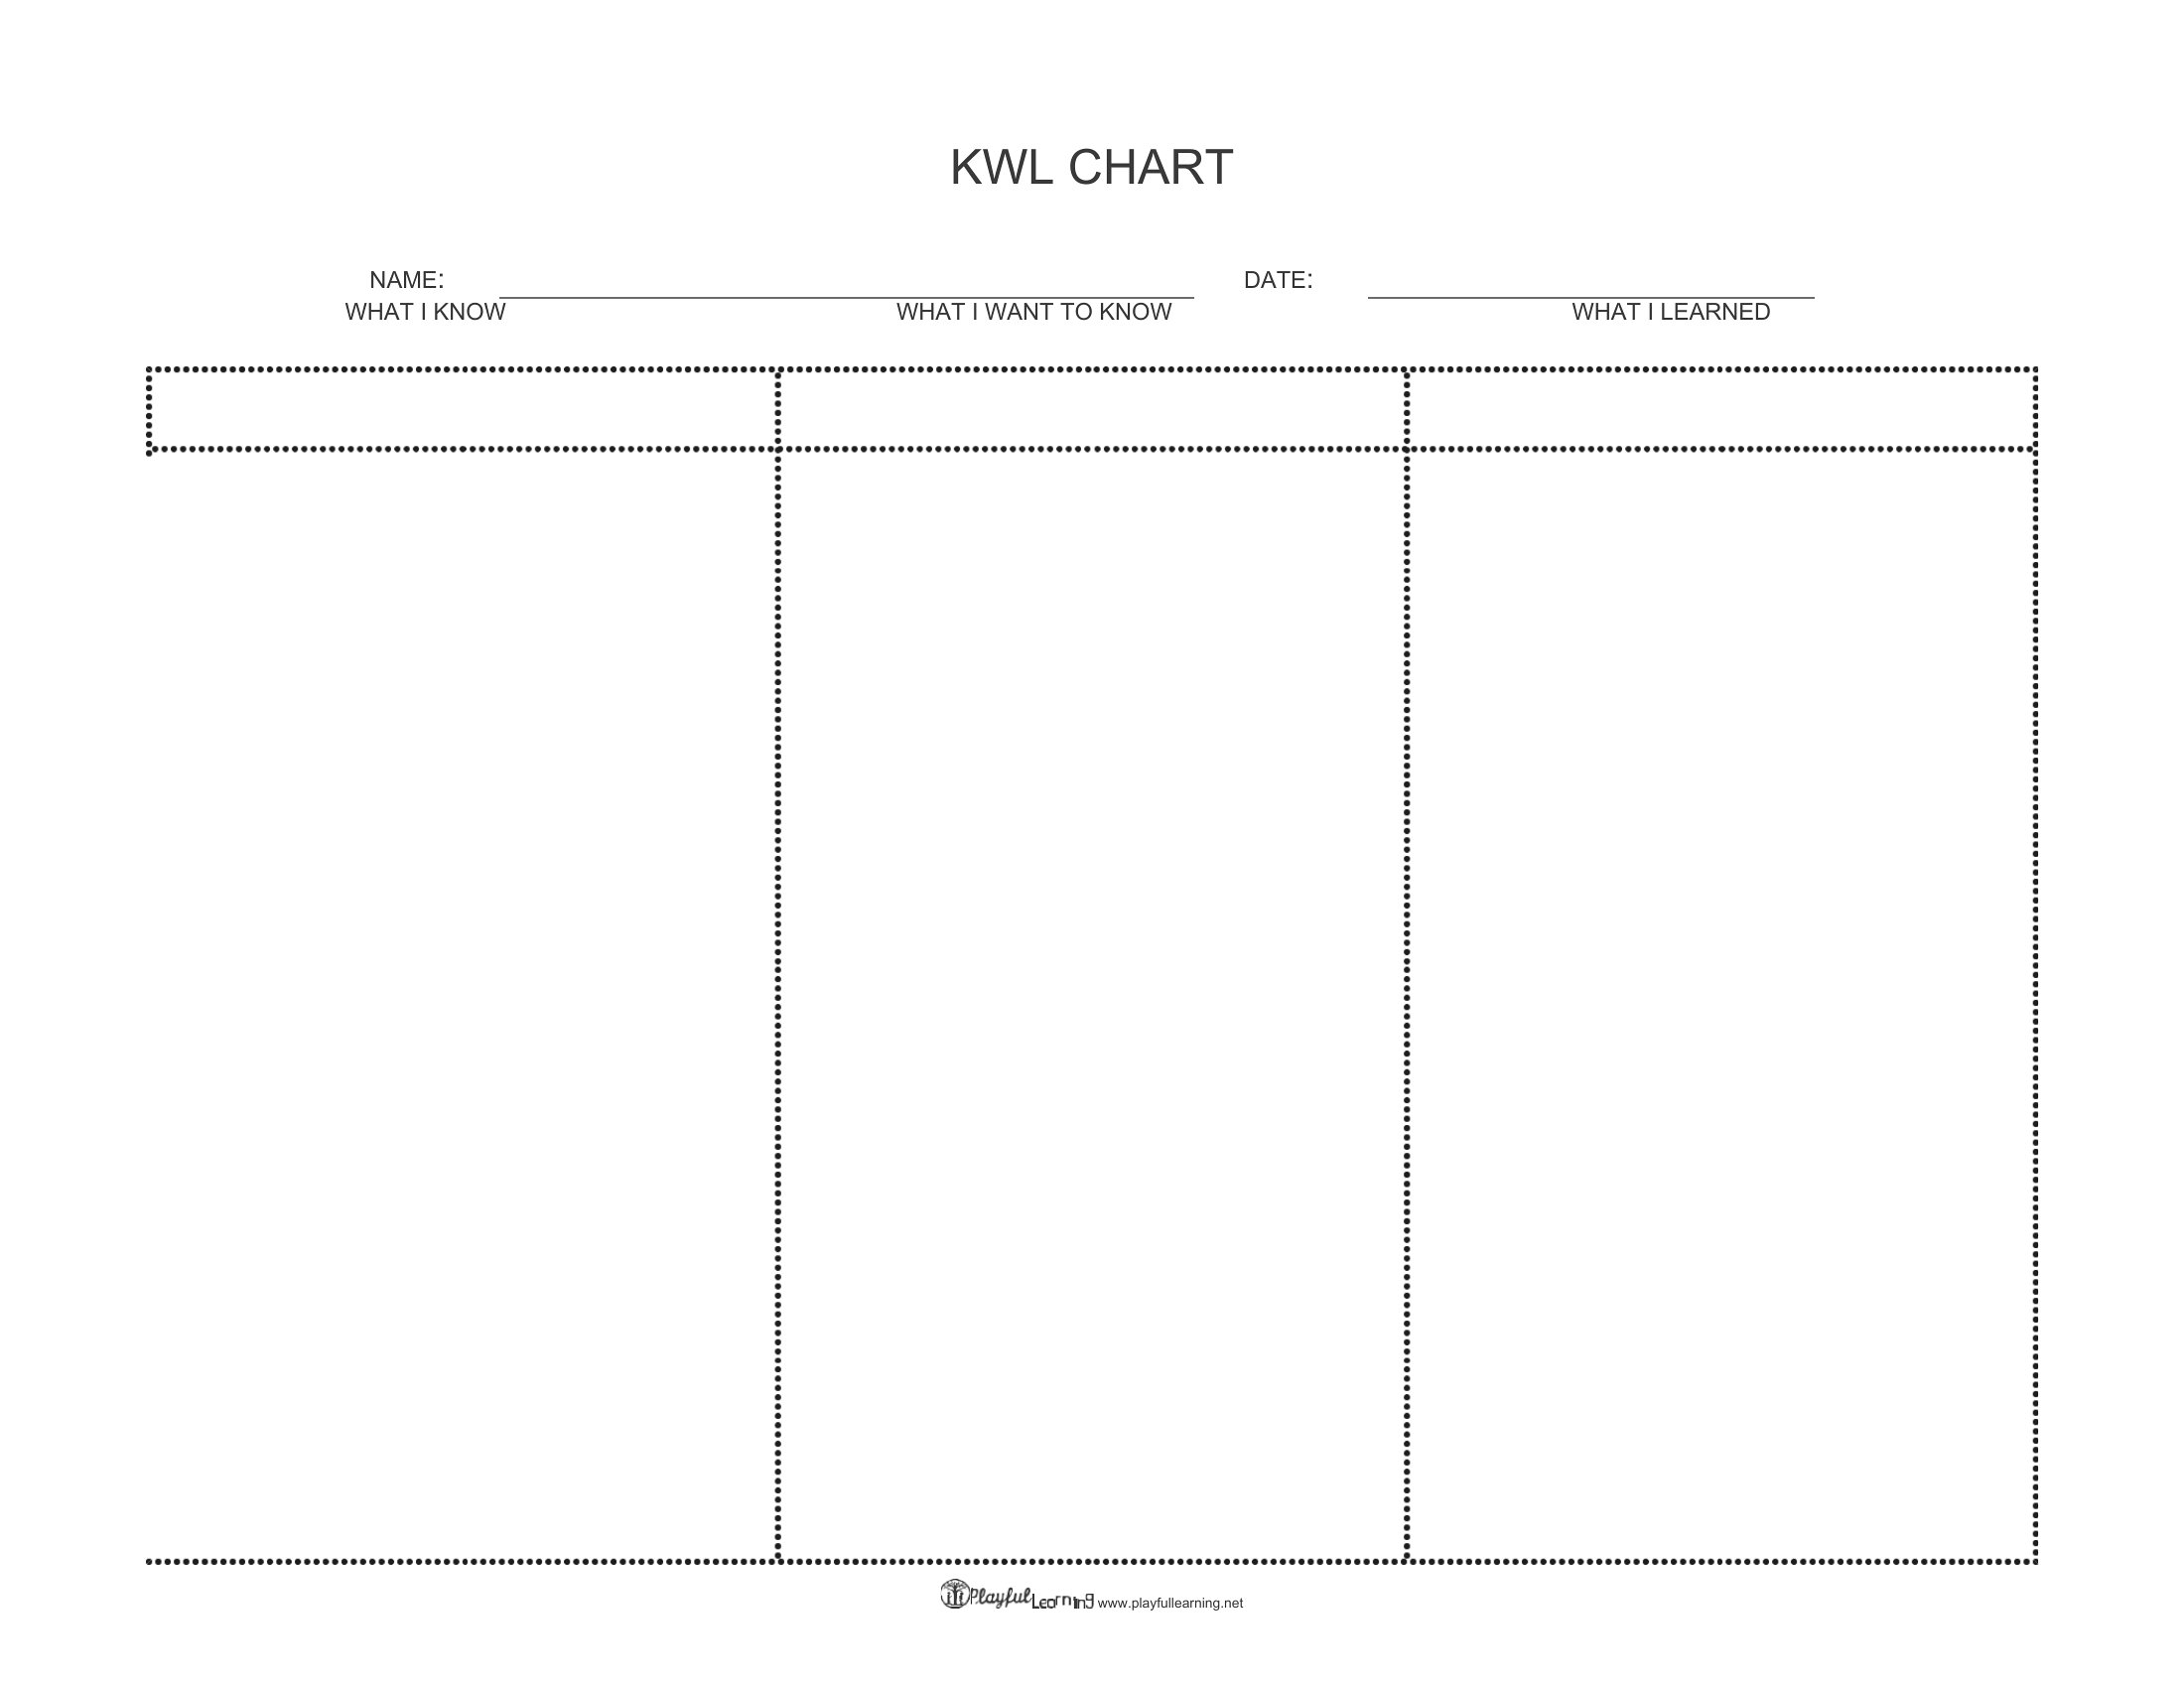
Students may skip the “Want to know” column if they are unsure what to ask. Offer guiding prompts such as “What do you wonder about?” to stimulate engagement.
Overcrowding the Table
Too many rows can overwhelm students. Limit each column to three or four bullet points, encouraging concise answers that are easier to reflect on later.
Ignoring the Reflective Step
Some educators treat the chart as a checklist. Emphasize that the “Learned” column is a space for meaningful reflection, not just a list of facts.
Not Updating the Template
As curricula evolve, revisit the template to incorporate new learning objectives or assessment strategies. A stagnant template may become irrelevant to contemporary teaching practices.
Conclusion
Mastering the Kwl Chart Template Word Document equips teachers with a versatile, low‑cost tool that fosters curiosity, promotes active learning, and provides actionable data for instruction. By carefully designing the chart, customizing it for diverse subjects, and weaving it into every lesson cycle, educators can transform ordinary classrooms into dynamic spaces where students ask, discover, and remember. The simple act of filling in a three‑column table becomes a catalyst for deeper engagement, stronger comprehension, and lasting academic success. With a well‑crafted KWL chart in hand, both teachers and students can navigate new knowledge with confidence, curiosity, and clarity.