
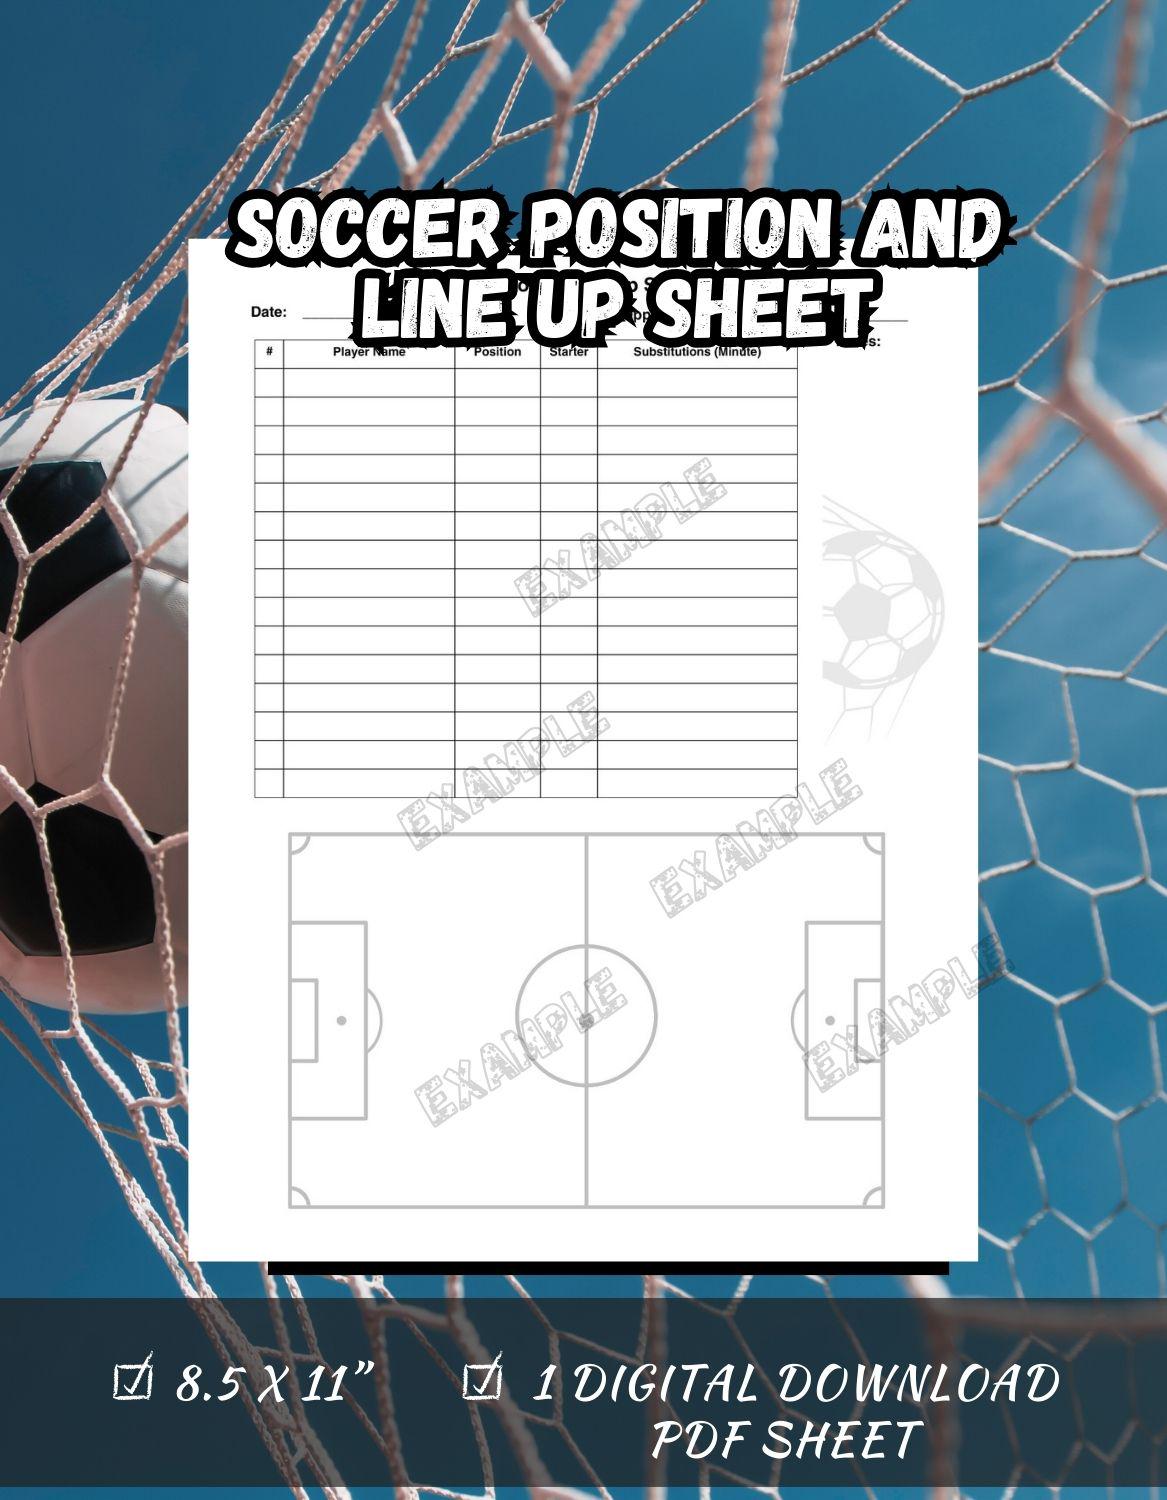
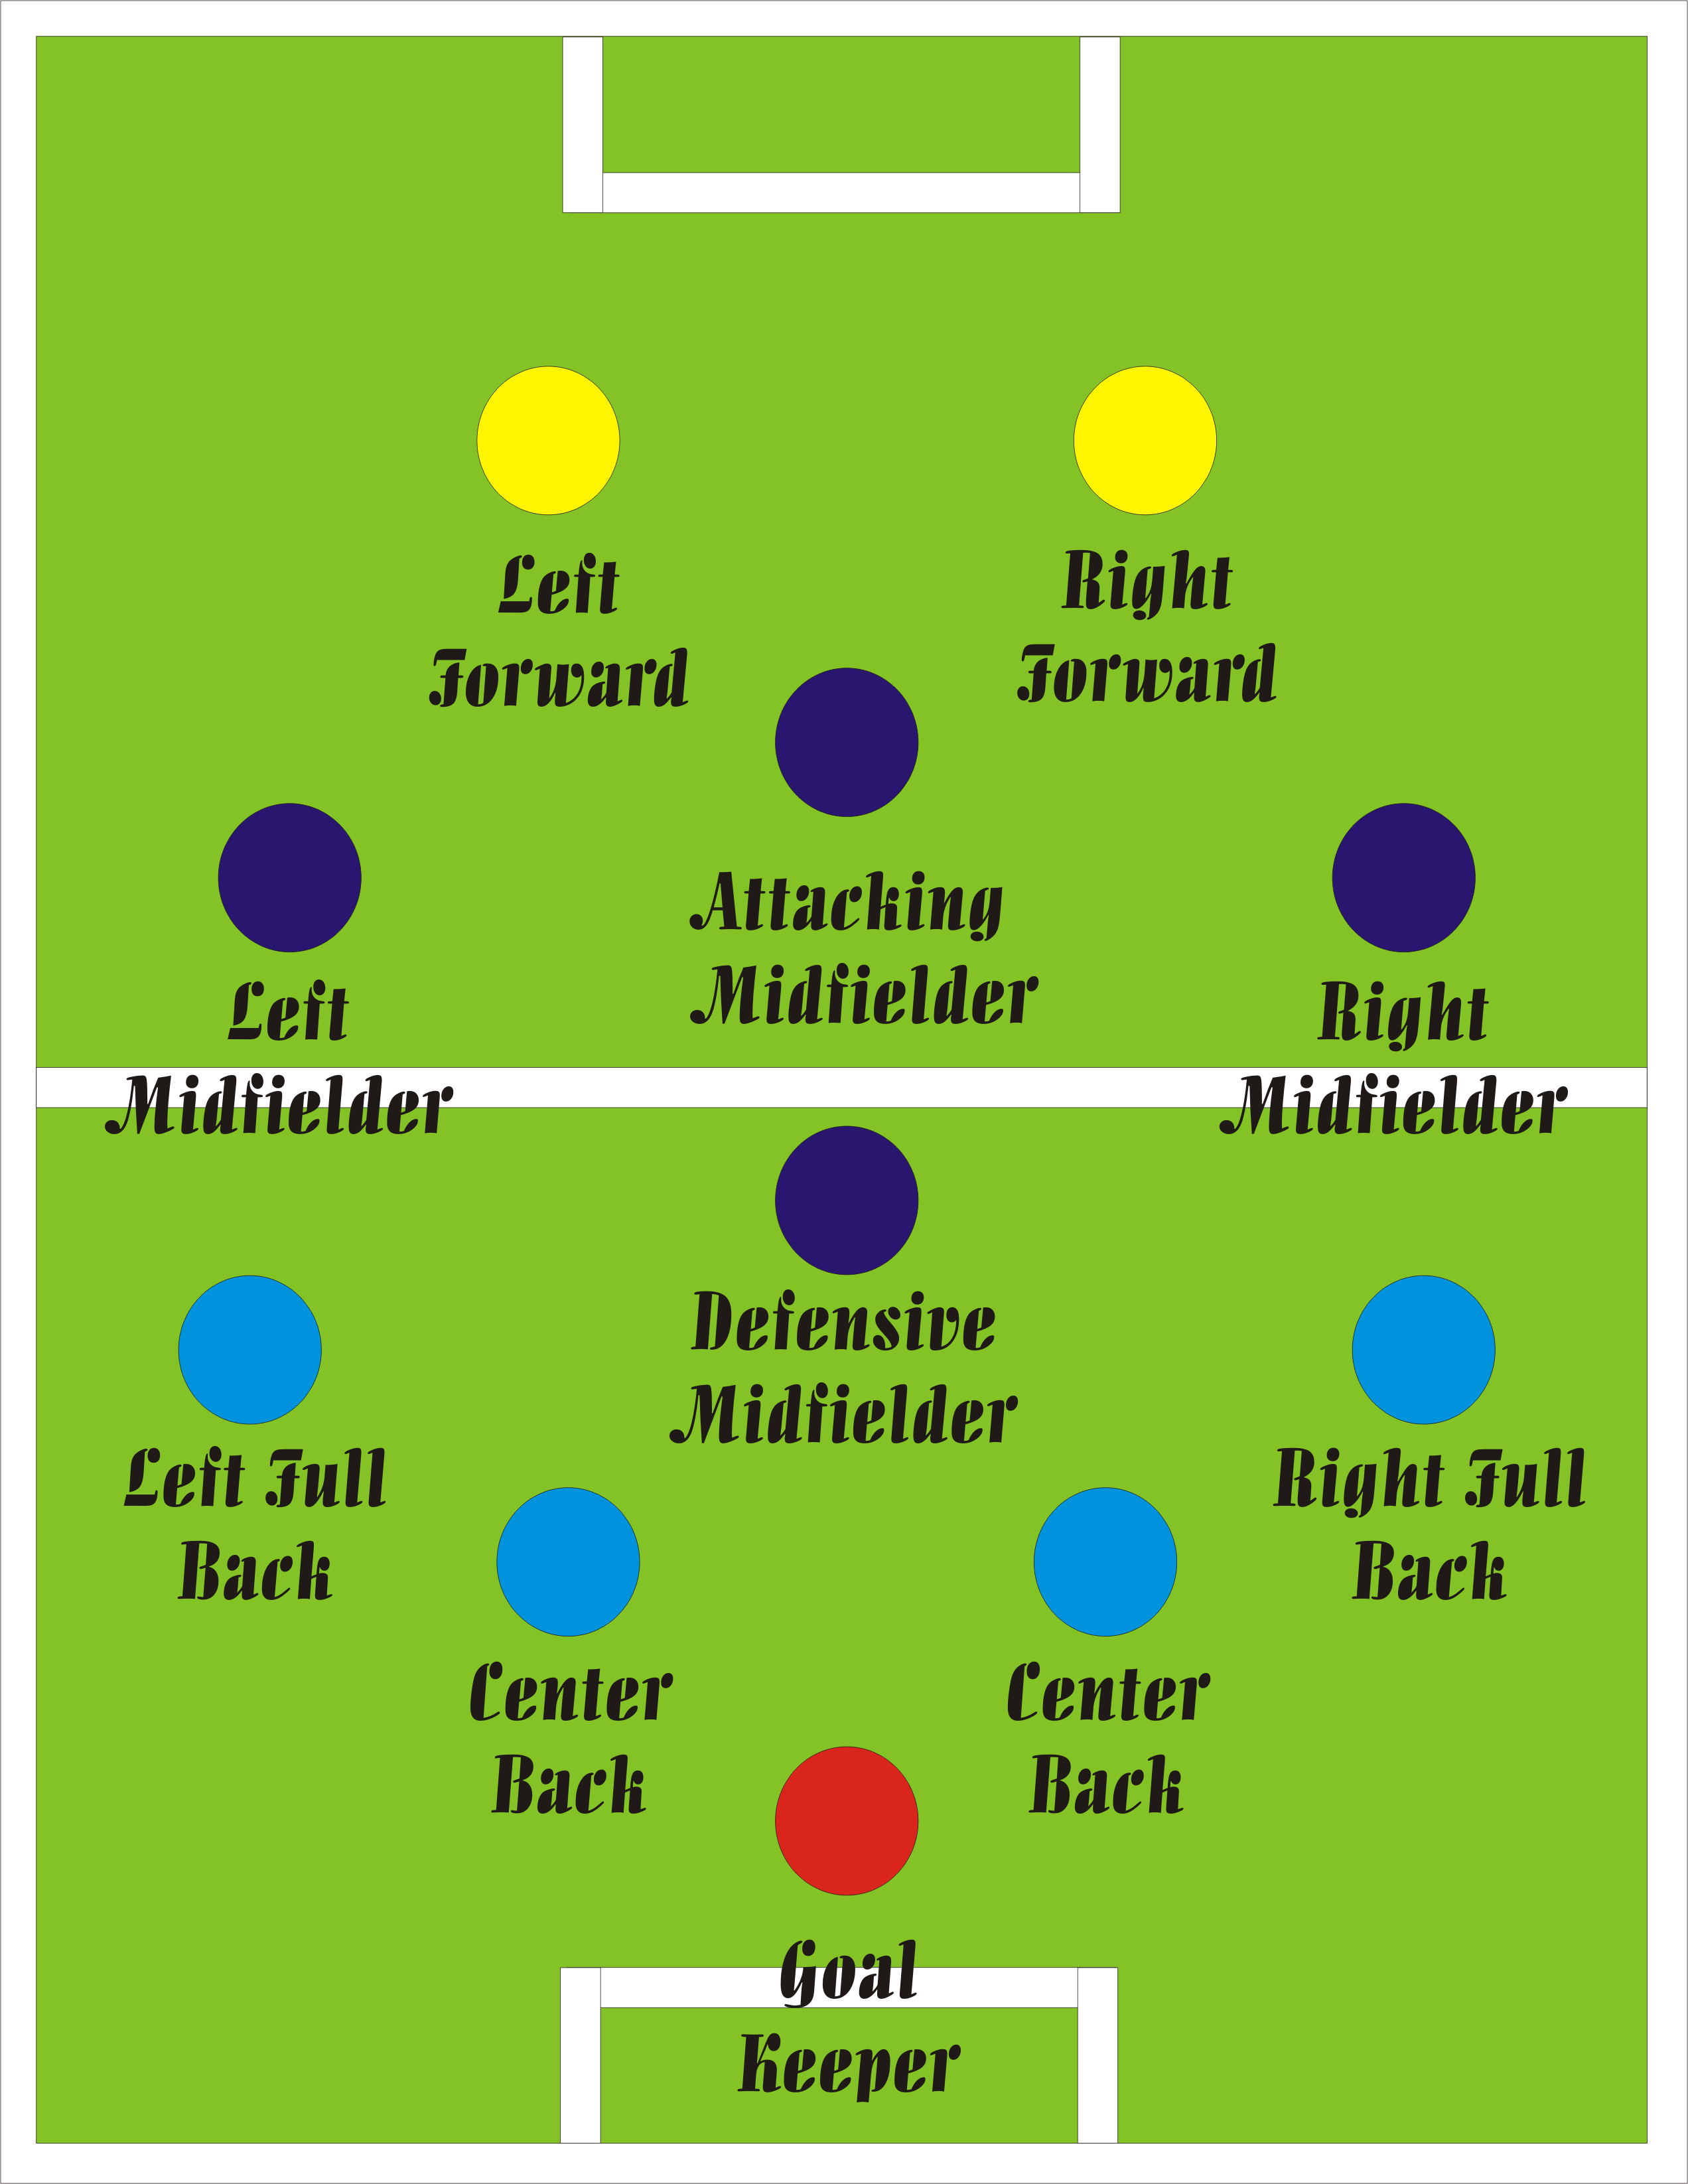
The Soccer Field Position Chart Template is more than just a diagram; it is a strategic blueprint that translates abstract tactics into visual clarity on the pitch. Coaches, players, and analysts rely on these charts to convey where every man should be, how they should move, and what responsibilities each zone holds during a match.
Why a Soccer Field Position Chart Template Matters
Coaching Efficiency
By condensing complex formations into a single image, a position chart cuts training time and reduces miscommunication. Coaches can instantly explain pressing patterns, defensive lines, and attacking runs without endless verbal descriptions. When everyone sees the same schematic, the team internalizes spatial responsibilities faster than through oral drills alone.
Tactical Planning
Every game is a chessboard. A well‑designed position chart lets a coach visualize tactical adjustments before the whistle. Whether tightening the midfield box for a counter‑attack or widening the wings for a high‑press, the template becomes a living document that adapts to the opponent’s style.
Player Development
Young players learn positional awareness by studying their own roles relative to teammates. A clear chart demonstrates where a winger should sprint, how a full‑back should track back, and where a central midfielder must provide cover. Over time, this visual learning accelerates technical and cognitive growth.
Fan Engagement
Match programs, club websites, and social media posts often use position charts to explain a team’s tactical approach. By presenting a simple diagram, fans gain deeper insight into the game, fostering a stronger connection between supporters and the club’s strategy.
Key Features of a Good Soccer Field Position Chart Template
Field Accuracy
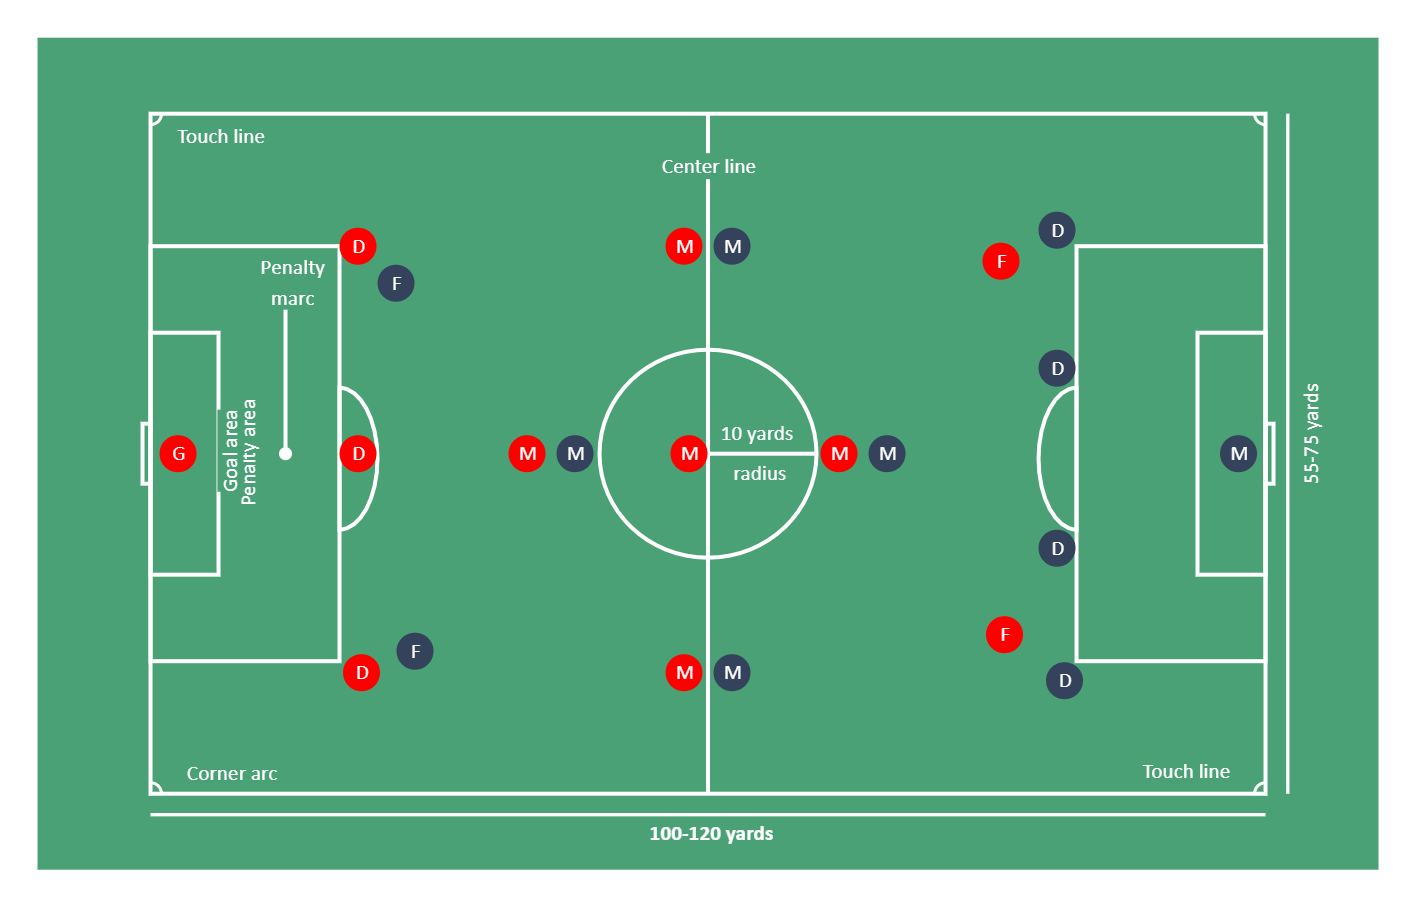
A reliable template displays the true dimensions of a standard pitch: 105 meters in length, 68 meters in width. Proper scaling ensures that distance-based strategies—such as defensive width or attacking triangles—are correctly represented.
Player Positioning
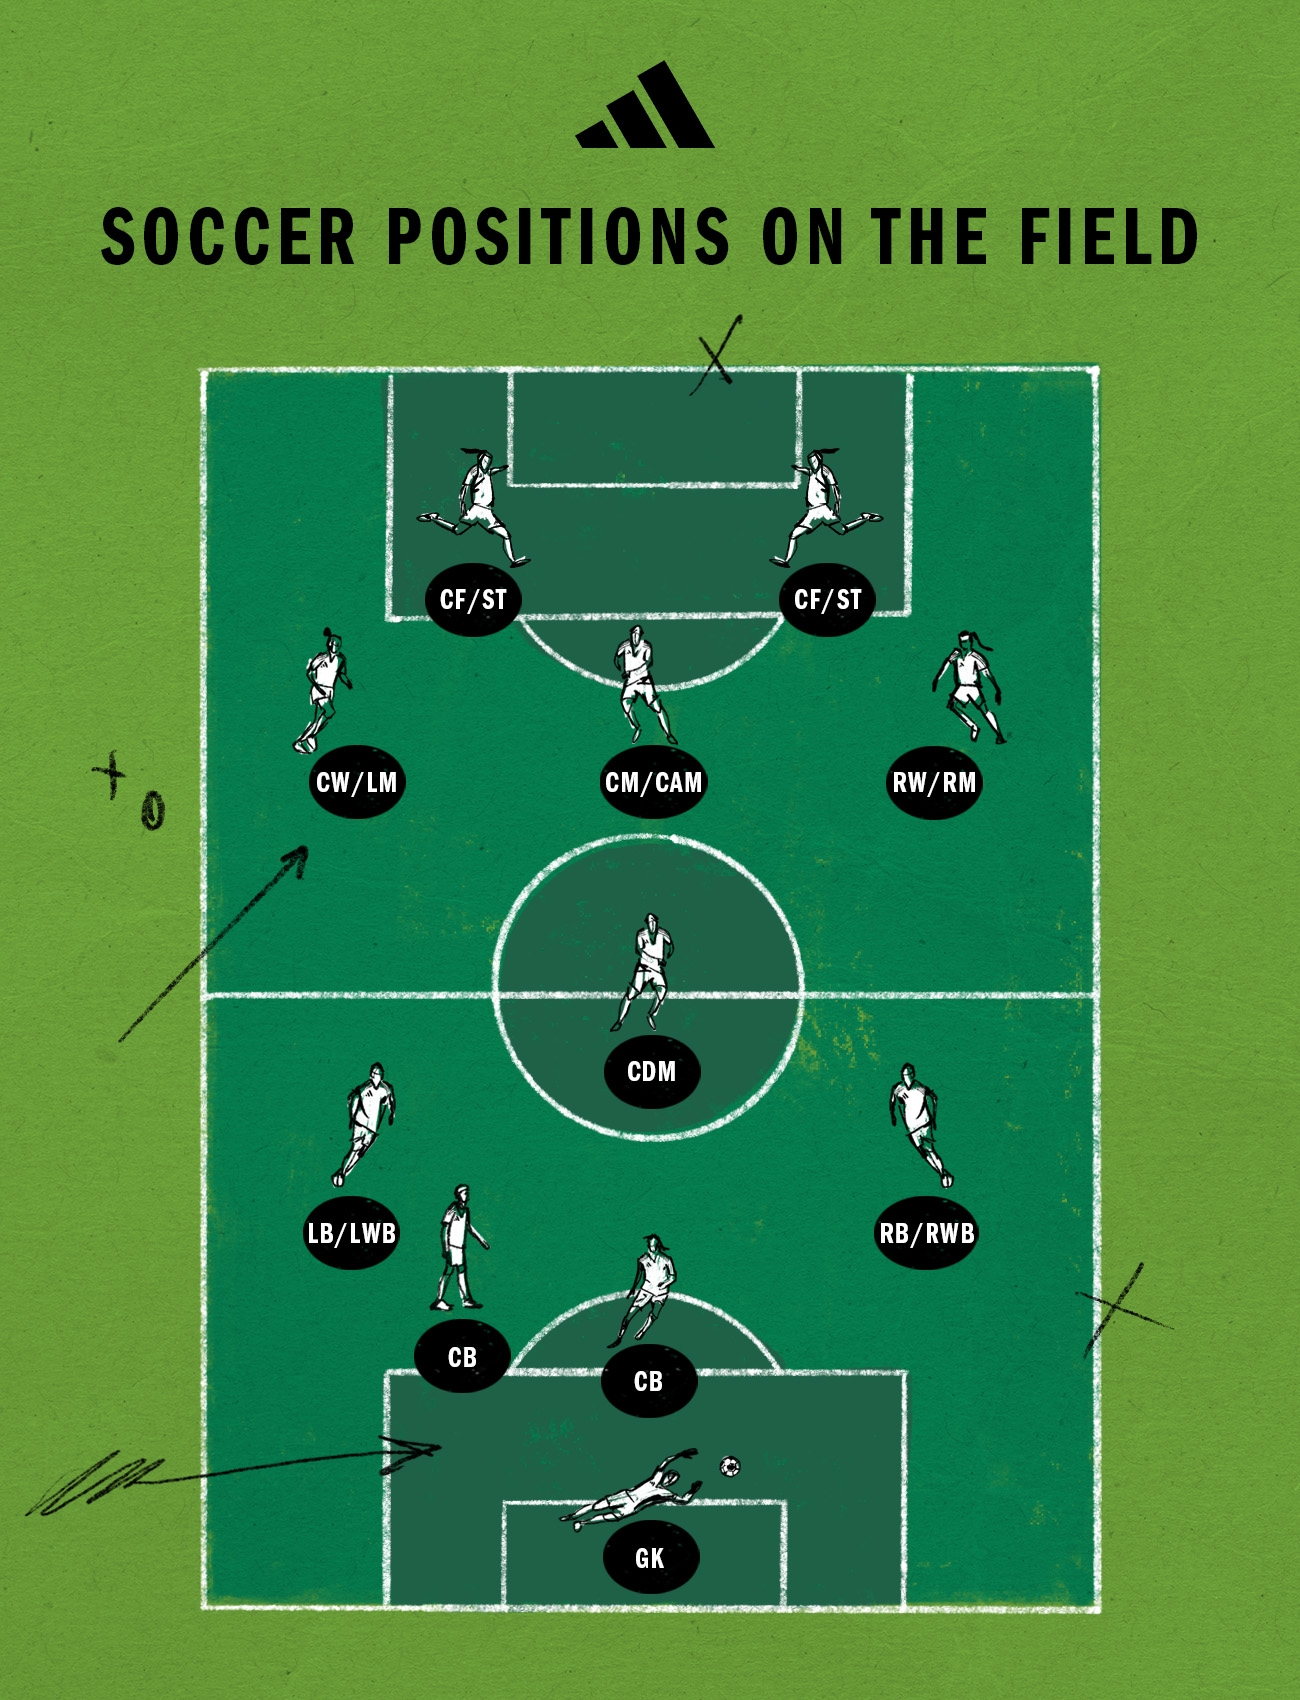
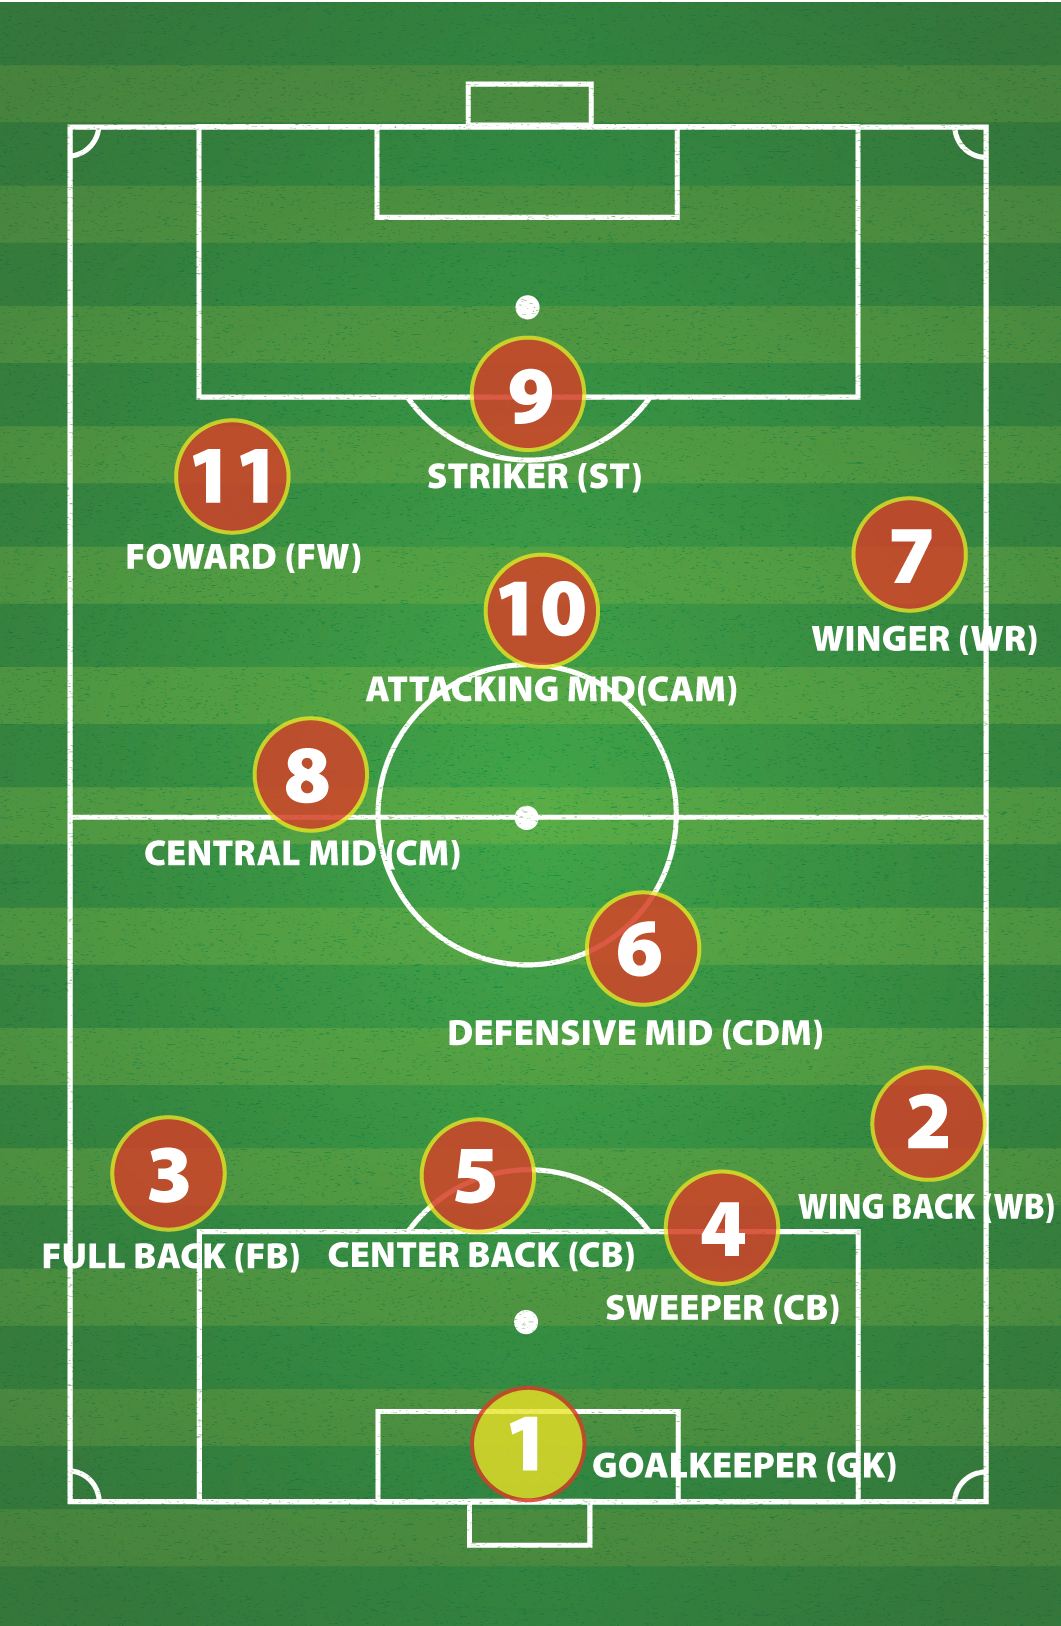
Each role should be marked with a distinct icon or color. Common labels include ST (Striker), CM (Central Midfielder), RB (Right Back), etc. Using consistent symbols across all charts makes them instantly recognizable to the entire team.
Zone Markings
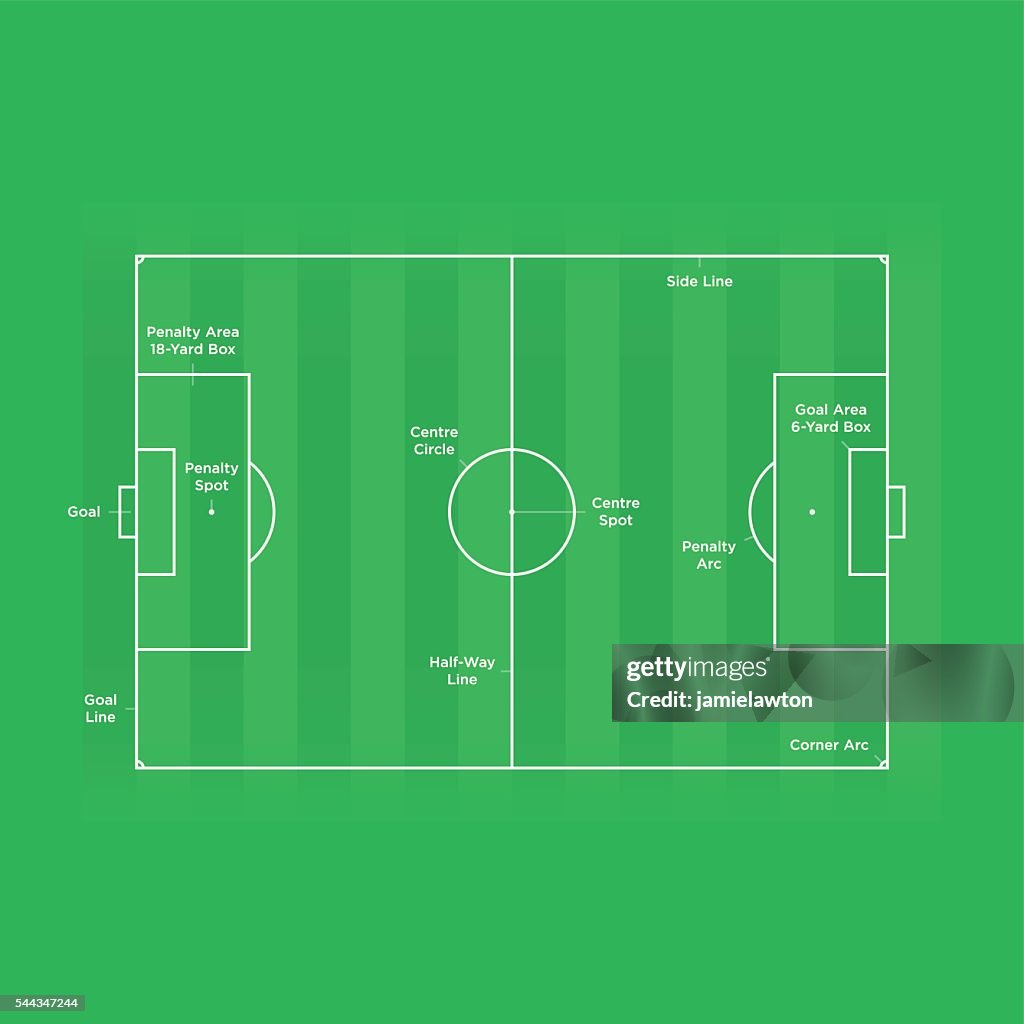
Defining key areas such as the penalty box, midfield corridor, and defensive third helps players understand where their responsibilities begin and end. Highlighting zones with subtle shading or borders clarifies where the defensive line should hold and where attackers should exploit gaps.
Customization Options
Templates should allow for quick editing—adding or removing players, adjusting line depth, or incorporating set‑piece marks. Digital versions often include drag‑and‑drop features and layering capabilities for overlays like pressing triggers or off‑side traps.
Accessibility
A template that is printable, shareable via PDF, or viewable on mobile devices expands its usability across various coaching contexts, from classroom sessions to in‑stadium presentations.
How to Use a Soccer Field Position Chart Template in Practice

Preparing the Template
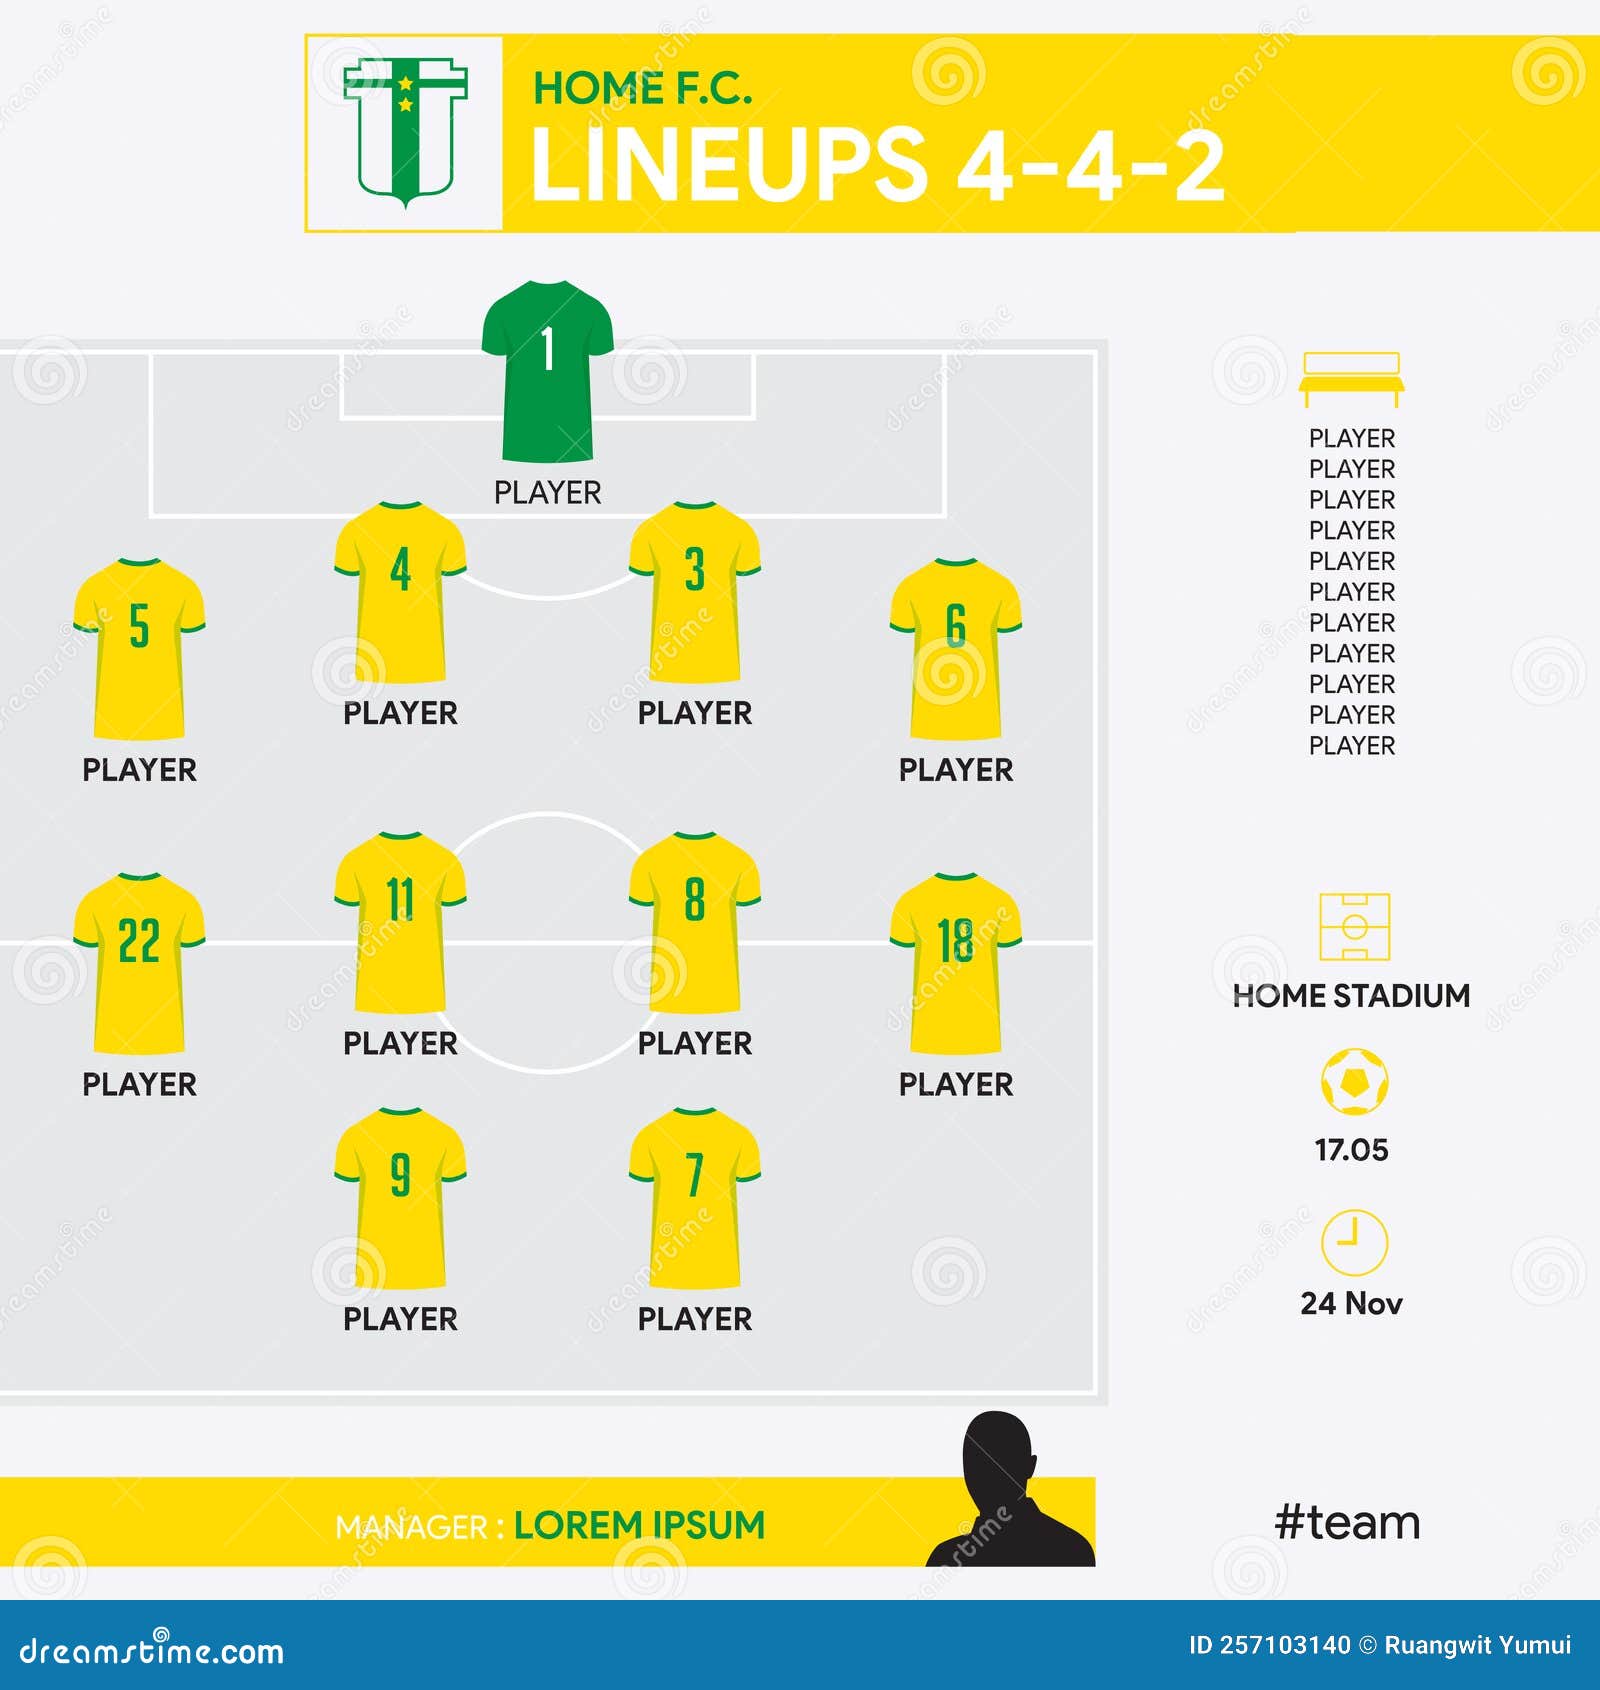
Start by selecting a base layout that matches your league’s pitch markings. Overlay the standard 4‑4‑2 or 4‑3‑3 formation, then add player numbers and names. Include a legend that explains color codes and symbols used.
Designing the Match Plan
Incorporate specific tactical instructions: “Press to the left third,” “Maintain a 5‑meter defensive line,” or “Create a passing triangle between the left winger, central striker, and right midfielder.” These annotations turn a static diagram into a dynamic playbook.
Communicating with Players
During pre‑match briefings, display the chart on a screen or hand out copies. Walk players through each position, emphasizing the “why” behind movements. Repetition in training—using the same chart for drills—reinforces spatial understanding.
Adjusting During Play
Coaches can update a digital chart mid‑game to reflect tactical switches, such as shifting from a 4‑5‑1 to a 4‑3‑3 after a substitution. Quick visual changes help assistants and players adapt instantly, maintaining cohesion.
Common Mistakes to Avoid When Creating or Using Position Charts

Overcomplicating the Diagram
Too many layers, icons, or color schemes can overwhelm players. Keep the design clean: primary positions, key zones, and a limited color palette.
Ignoring Field Dimensions
Misrepresenting pitch size leads to unrealistic expectations about spacing. Always validate the scale against FIFA or your national governing body’s standards.
Failing to Update for Different Match Situations
Using the same chart for both defensive and attacking phases can create confusion. Separate charts or add toggle layers for “Off‑side trap” or “Counter‑attack” scenarios.
Neglecting Player Feedback
Players often know how a formation feels on the field. Solicit their input to adjust spacing or role definitions, ensuring the chart reflects practical realities.
Digital vs Physical Templates
Digital Tools
Software such as Microsoft PowerPoint, Adobe Illustrator, or specialized football analytics platforms can produce high‑resolution templates. Features like editable layers, annotations, and export options to PNG or PDF streamline workflow.
Physical Tools
Printed charts or whiteboard diagrams are ideal for in‑field coaching. Large posters can be hung in the locker room, while small laminated cards allow coaches to quickly sketch adjustments on the sidelines.
Customizing Templates for Different Levels and Formats

Youth Leagues
Young teams benefit from simplified charts with fewer roles. Use bold colors and larger icons to aid visual learning. Incorporate basic concepts like “stay in the box” or “cover the space between the defender and midfielder.”
Semi‑Professional and College
Mid‑tier squads can introduce more nuanced formations. Add secondary roles such as “box‑to‑box midfielder” or “wing back” and indicate preferred passing lanes.
Professional and International
High‑level teams require intricate overlays: pressing triggers, off‑side traps, and detailed set‑piece routines. Combine position charts with data analytics, such as heat maps, to refine tactical decisions.
Different Formats: Indoor, Beach, and 5‑On‑5
Adjust the template’s scale and zone definitions to fit smaller pitches. For indoor soccer, emphasize rapid transitions and 360‑degree defensive coverage. Beach soccer charts highlight ball control in sandy conditions, with markers for ball‑handling zones.
Examples of Position Charts for Popular Formations

4‑4‑2
Two central defenders, two full‑backs, four midfielders split into defensive, central, and attacking roles, and two strikers. Highlight the central midfield partnership and the balance between defense and attack.
4‑3‑3
Three midfielders—typically a defensive midfielder, a central box‑to‑box, and an attacking midfielder—support three wide forwards. The chart should emphasize wing play, through balls, and pressing triggers on the flanks.
3‑5‑2
Three central defenders with two wing‑backs, five midfielders, and two strikers. The diagram must show the wing‑back’s dual role in attack and defense, as well as the central midfield trio’s responsibilities for ball retention.
5‑4‑1
Defensive orientation with a lone striker. The chart emphasizes a compact defensive line, a deep midfield shield, and a single forward’s positioning for counter‑attacks.
Integrating with Video Analysis
Overlaying Position Charts on Match Footage
Import the template into video editing software and align it with the real‑time field. As players move, the chart updates to show actual versus expected positioning, revealing tactical weaknesses or strengths.
Statistical Highlighting
Use color gradients to represent heat maps or pass success rates within specific zones. This visual data helps coaches identify over‑used spaces or under‑utilized areas.
Post‑Match Debriefs
Display the chart alongside match footage to highlight moments where players deviated from the plan. Discuss corrective actions and reinforce the importance of staying within the designated zones.
Creating Your Own Template from Scratch

Step 1: Choose a Base Design
Start with a blank pitch layout. Many free templates are available online, but customizing ensures brand consistency and exact dimensions.
Step 2: Define Key Zones
Mark the defensive third, midfield corridor, and attacking third using subtle shading. This helps players visualize spatial responsibilities during drills.
Step 3: Add Player Positions
Place icons or numbers for each role. Use consistent symbols for positions across all formations to avoid confusion.
Step 4: Annotate Tactical Instructions
Add brief notes next to each position: “High press,” “Drop back,” “Stay wide.” Keep the text concise.
Step 5: Test and Refine
Run a drill using the chart. Observe how players respond and adjust spacing or responsibilities accordingly.
Maintaining Templates Over Seasons
Version Control
Number each iteration (v1, v2, etc.) and maintain a log of changes: formation shifts, player role changes, or tactical updates. This historical record is invaluable for longitudinal analysis.
Backup and Accessibility
Store templates in cloud services like Google Drive or Dropbox. Ensure they are accessible to coaching staff, assistant coaches, and even senior players for self‑study.
Regular Review Sessions
Schedule quarterly reviews to evaluate whether the template aligns with the team’s evolving playing style. Adjust based on coaching staff feedback and player development.
Conclusion

A Soccer Field Position Chart Template is more than a static diagram; it is a dynamic tool that enhances communication, sharpens tactics, and accelerates learning across all levels of play. By incorporating accurate field dimensions, clear positioning, and adaptable annotations, coaches can transform abstract strategies into tangible plans that resonate with players, analysts, and fans alike. Whether you’re a seasoned professional or a youth coach, investing time in designing, using, and refining these charts will pay dividends in match performance, player growth, and overall team cohesion. Embrace the visual power of a position chart and watch your squad move with intention, precision, and confidence on every corner of the pitch.




Related posts of "Soccer Field Position Chart Template"
