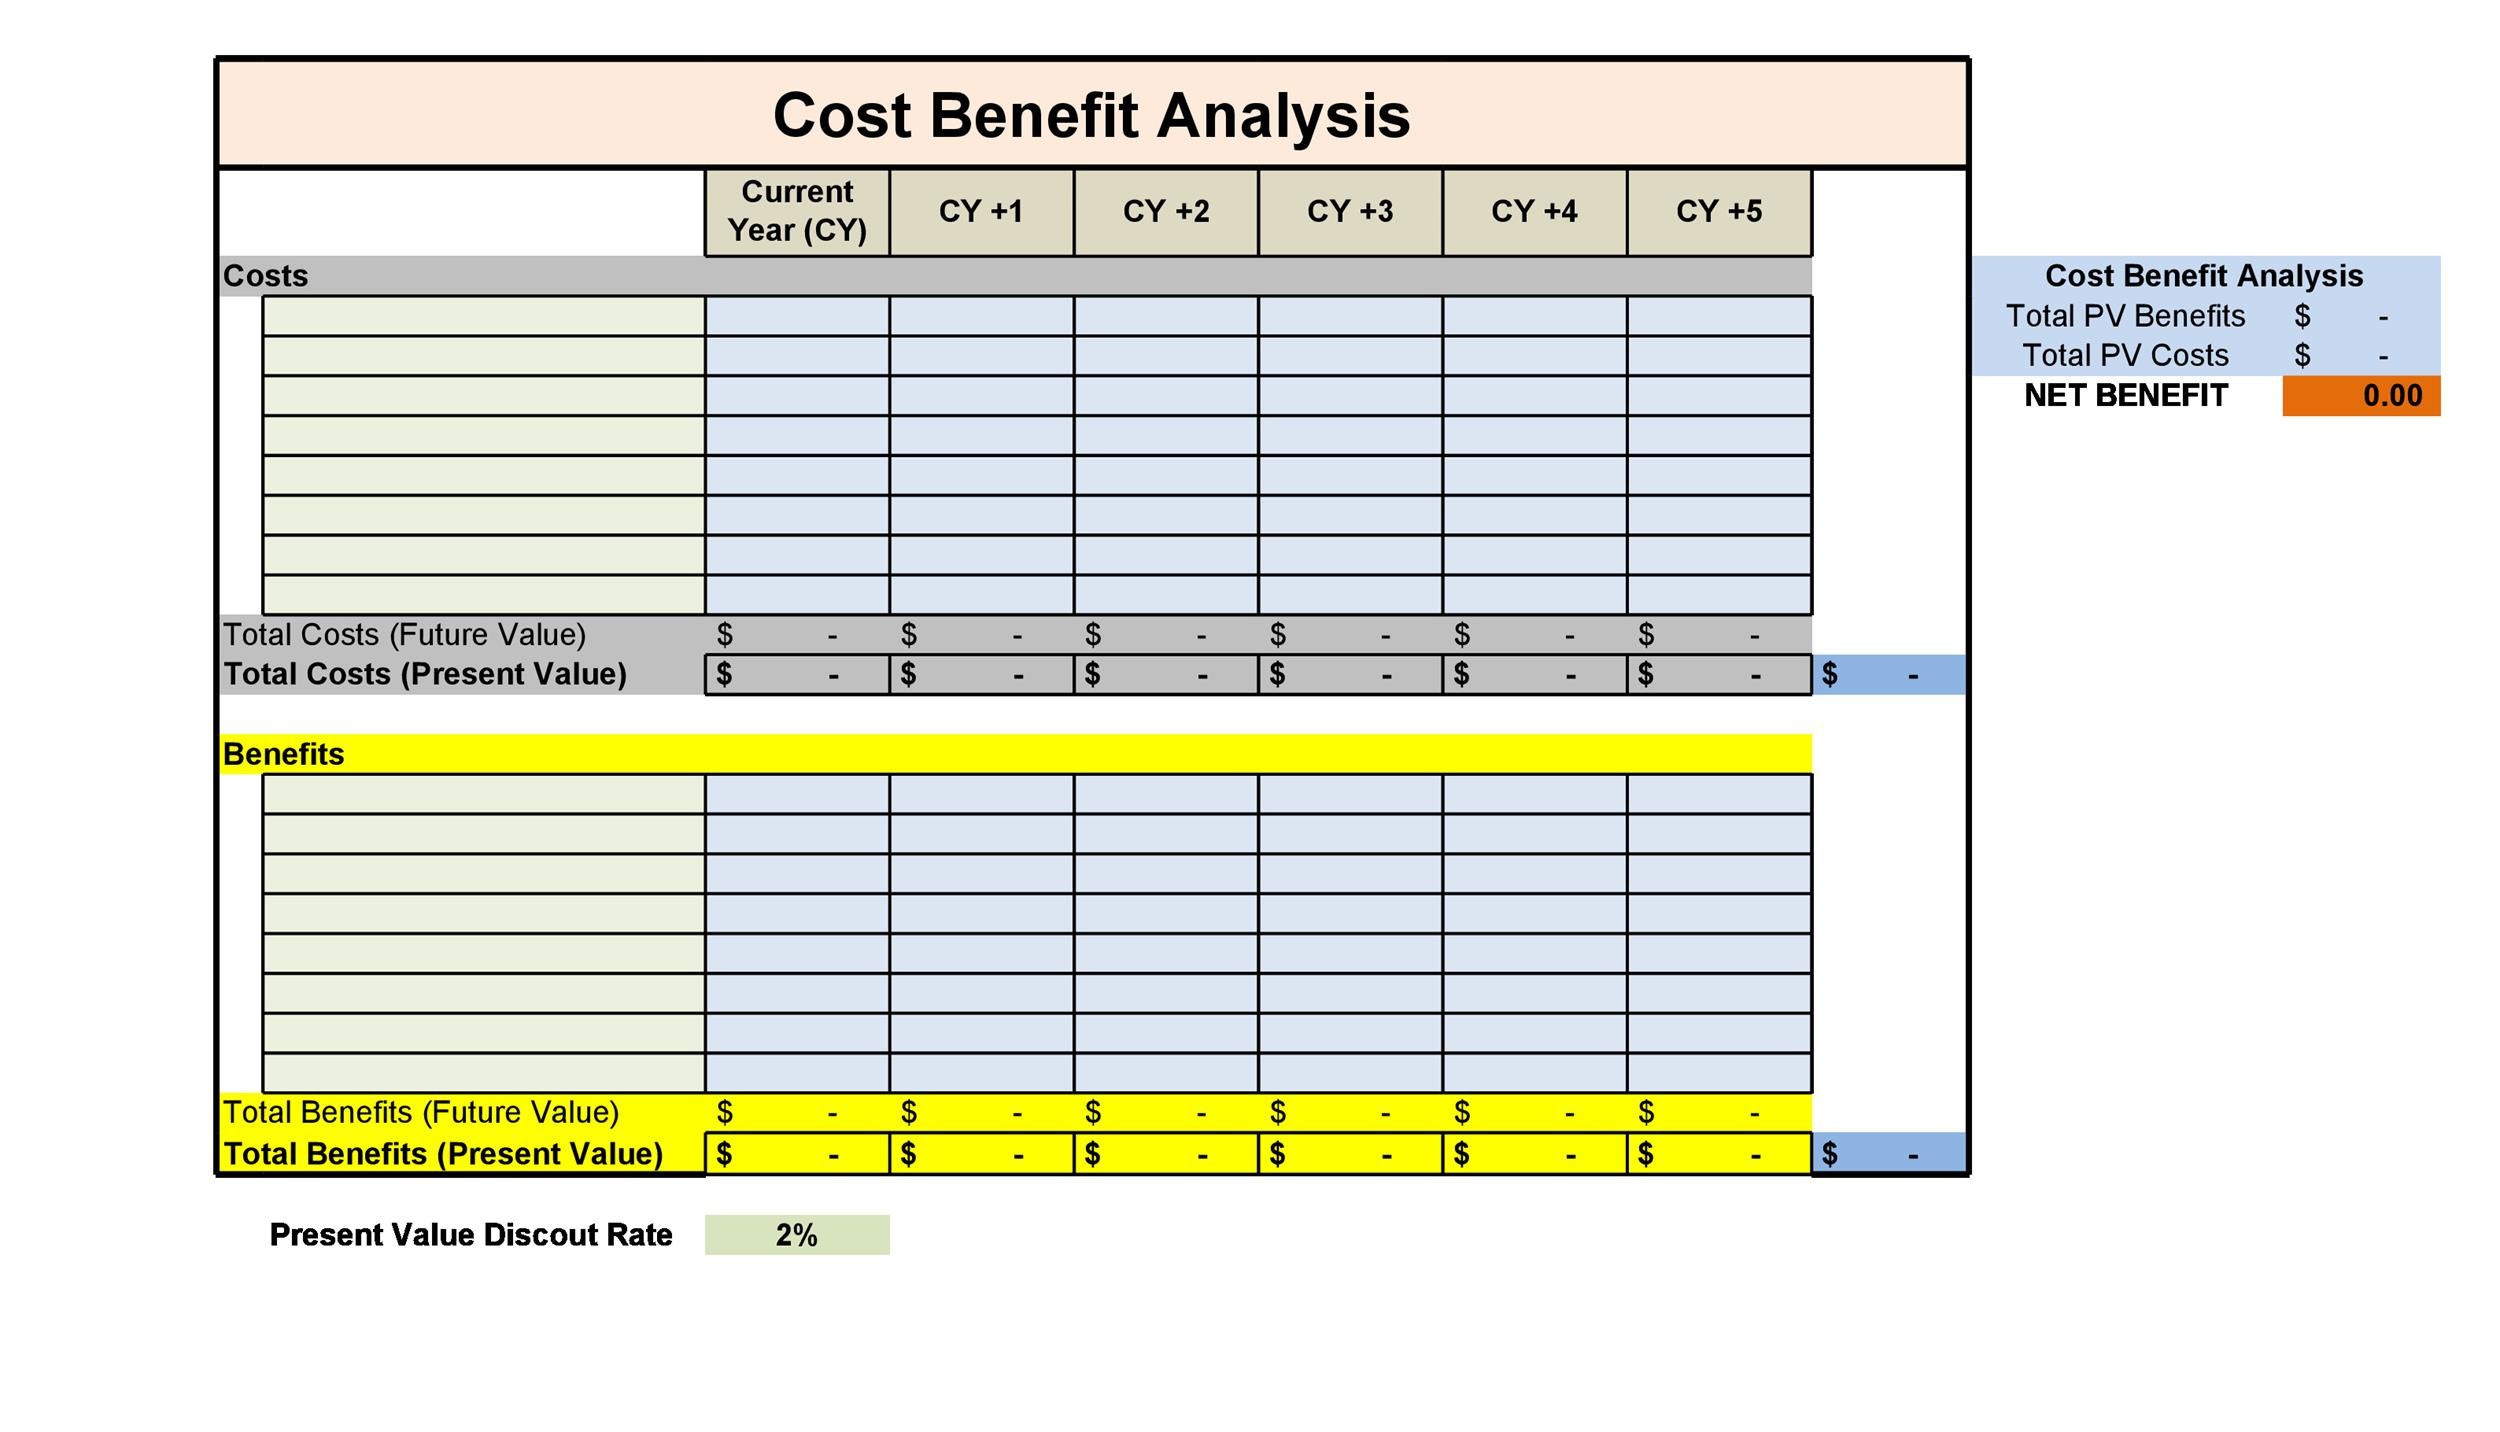
Cost Benefit Risk Analysis Template is a versatile tool that empowers project managers, executives, and analysts to quantify value, assess uncertainty, and make informed decisions. By combining financial metrics with risk metrics, this template moves beyond traditional cost–benefit calculations and adds a layer of realism that is crucial for today’s volatile business environment.
Why a Dedicated Cost Benefit Risk Analysis Template Matters
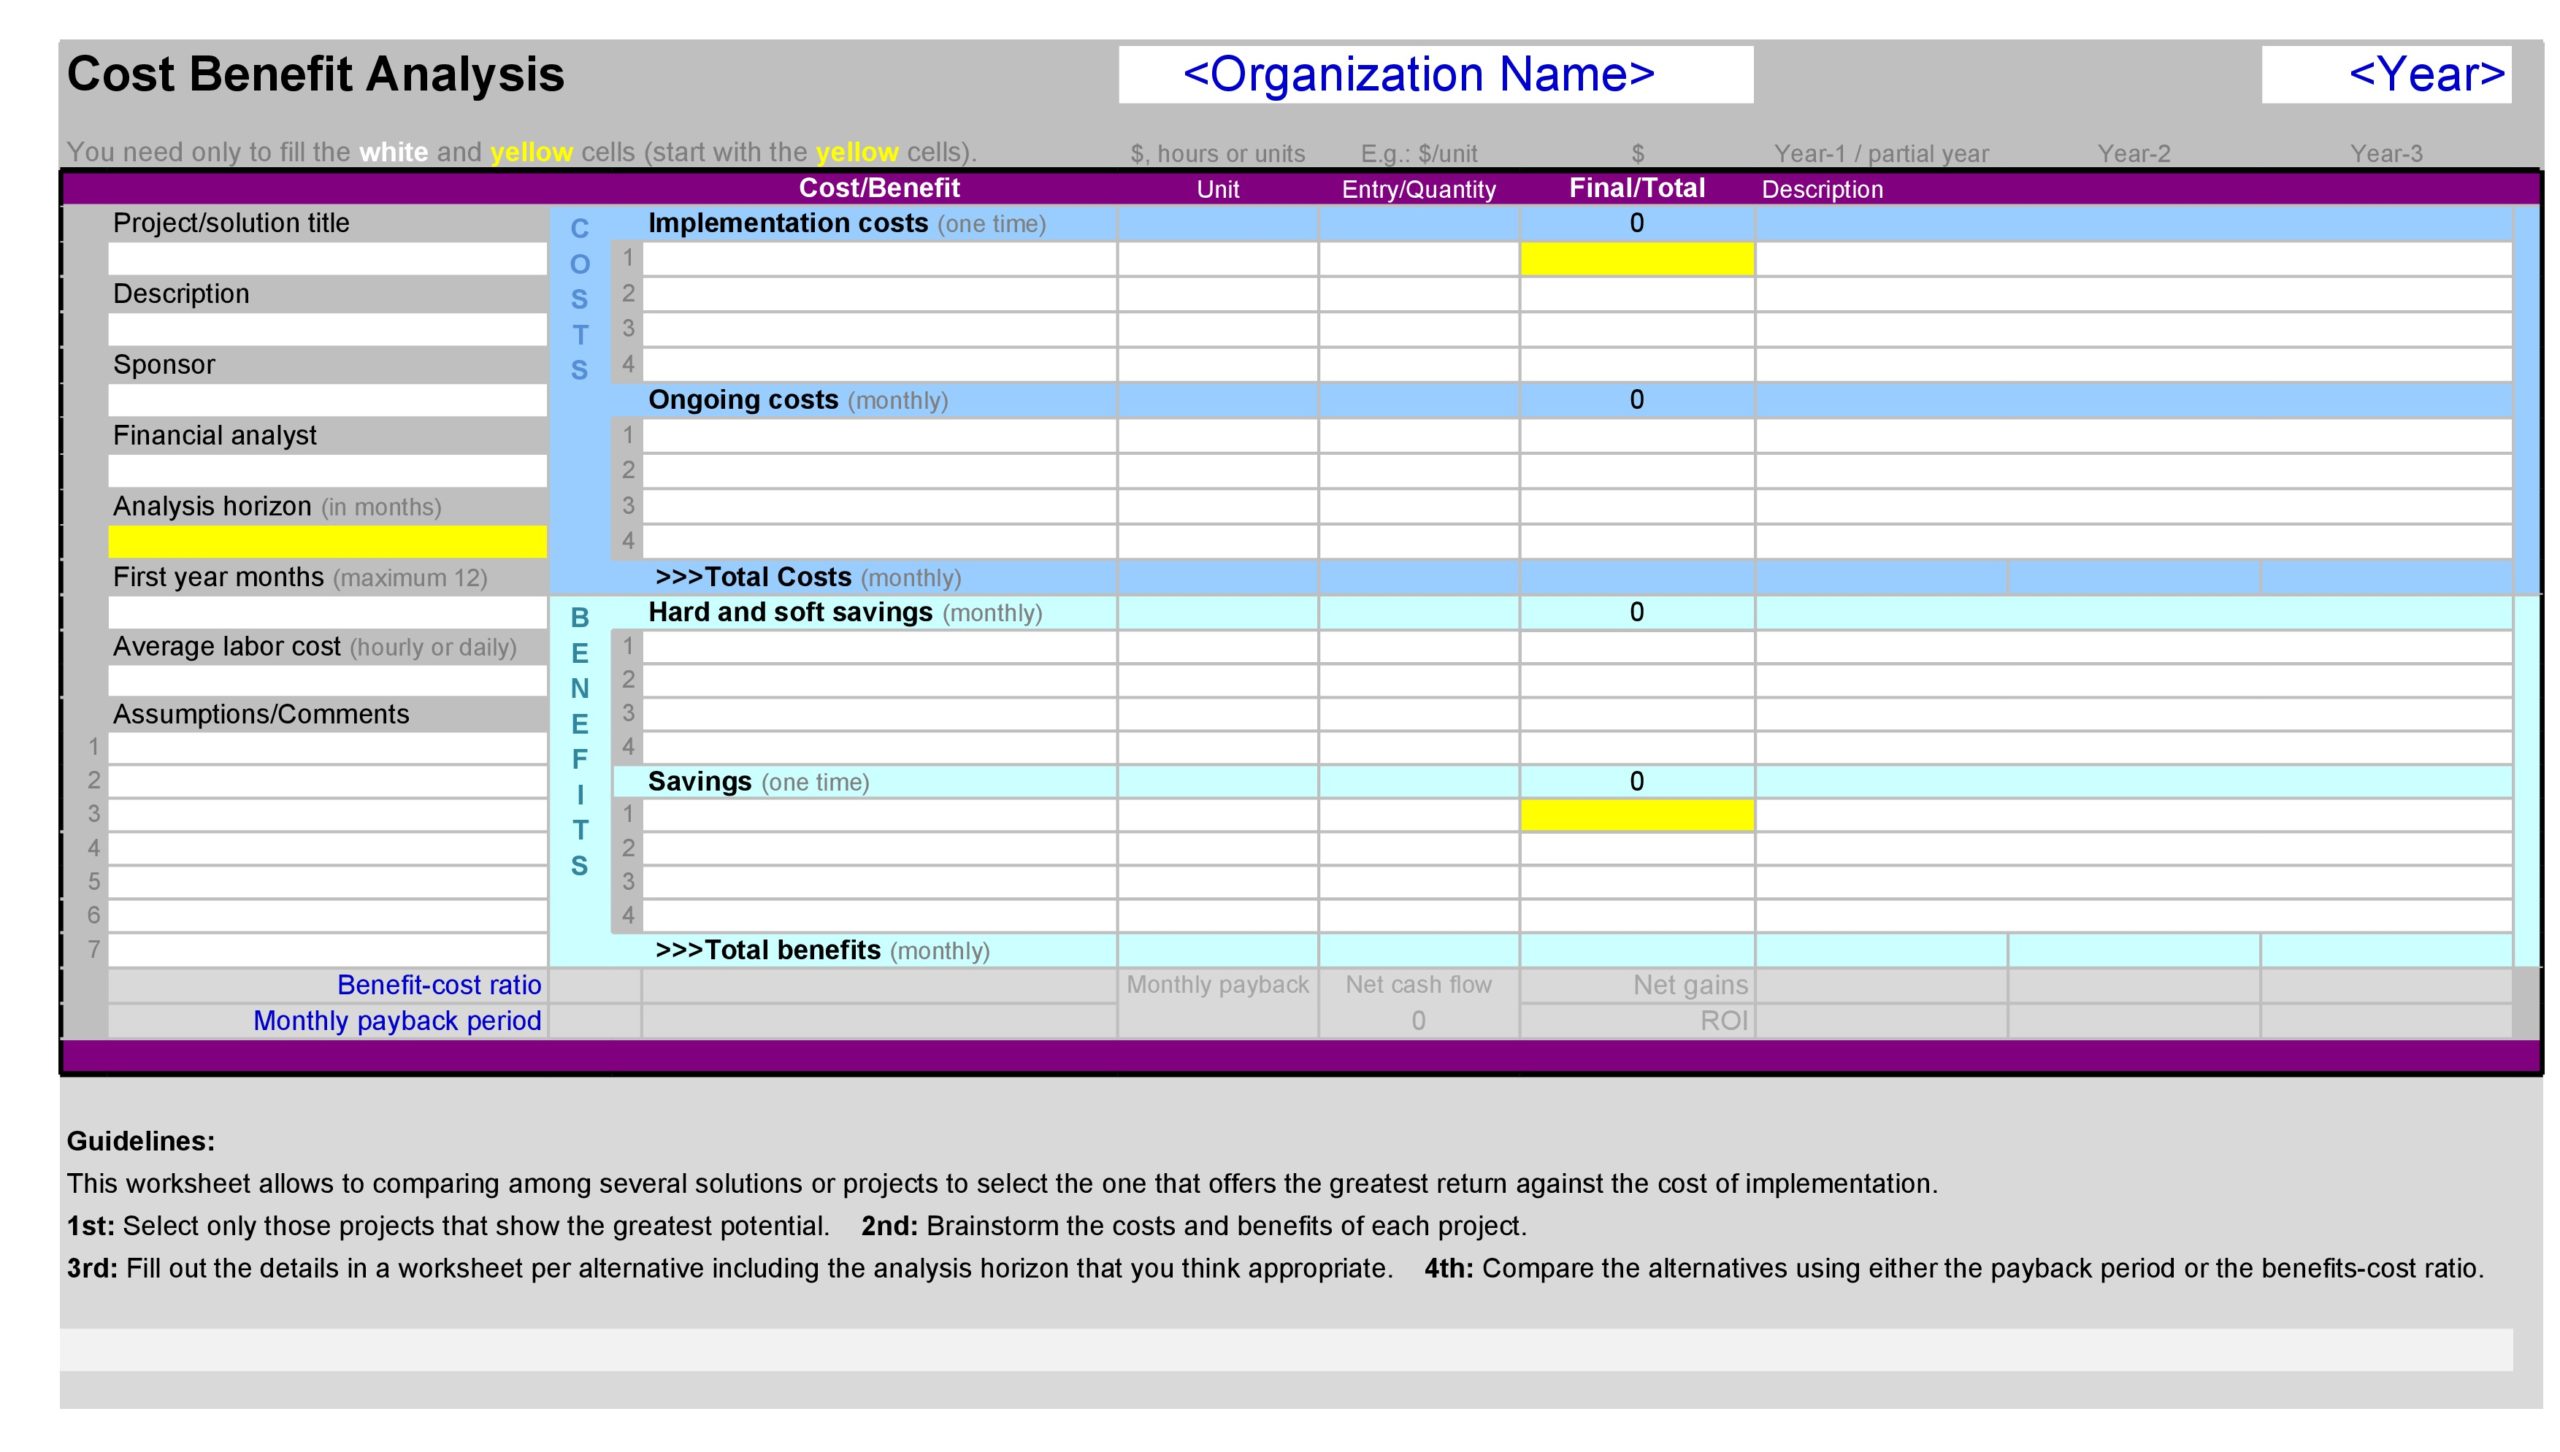
Traditional cost-benefit analyses often present a static picture of expected outcomes, ignoring the stochastic nature of markets, technology, and human factors. A Cost Benefit Risk Analysis Template bridges that gap by incorporating probability distributions, sensitivity checks, and scenario planning. When you embed risk assessment into your template, you achieve three core benefits:
- Credible Decision‑Making: Quantified risk exposure enables stakeholders to compare projects on a common risk-adjusted basis.
- Resource Optimization: By identifying high‑impact uncertainties, you can allocate contingency budgets more effectively.
- Communication Clarity: A visual and quantitative risk profile translates complex assumptions into digestible insights for non‑technical audiences.
Case Study: Launching a New Product Line
A mid‑size consumer goods company was evaluating a new product line. The traditional cost-benefit calculation projected a 15% return on investment. After applying a Cost Benefit Risk Analysis Template and simulating market penetration rates, the risk‑adjusted return fell to 9%. This shift prompted the company to re‑design the marketing strategy, ultimately improving the risk-adjusted payoff by 4% through targeted campaigns.
Core Components of a Cost Benefit Risk Analysis Template
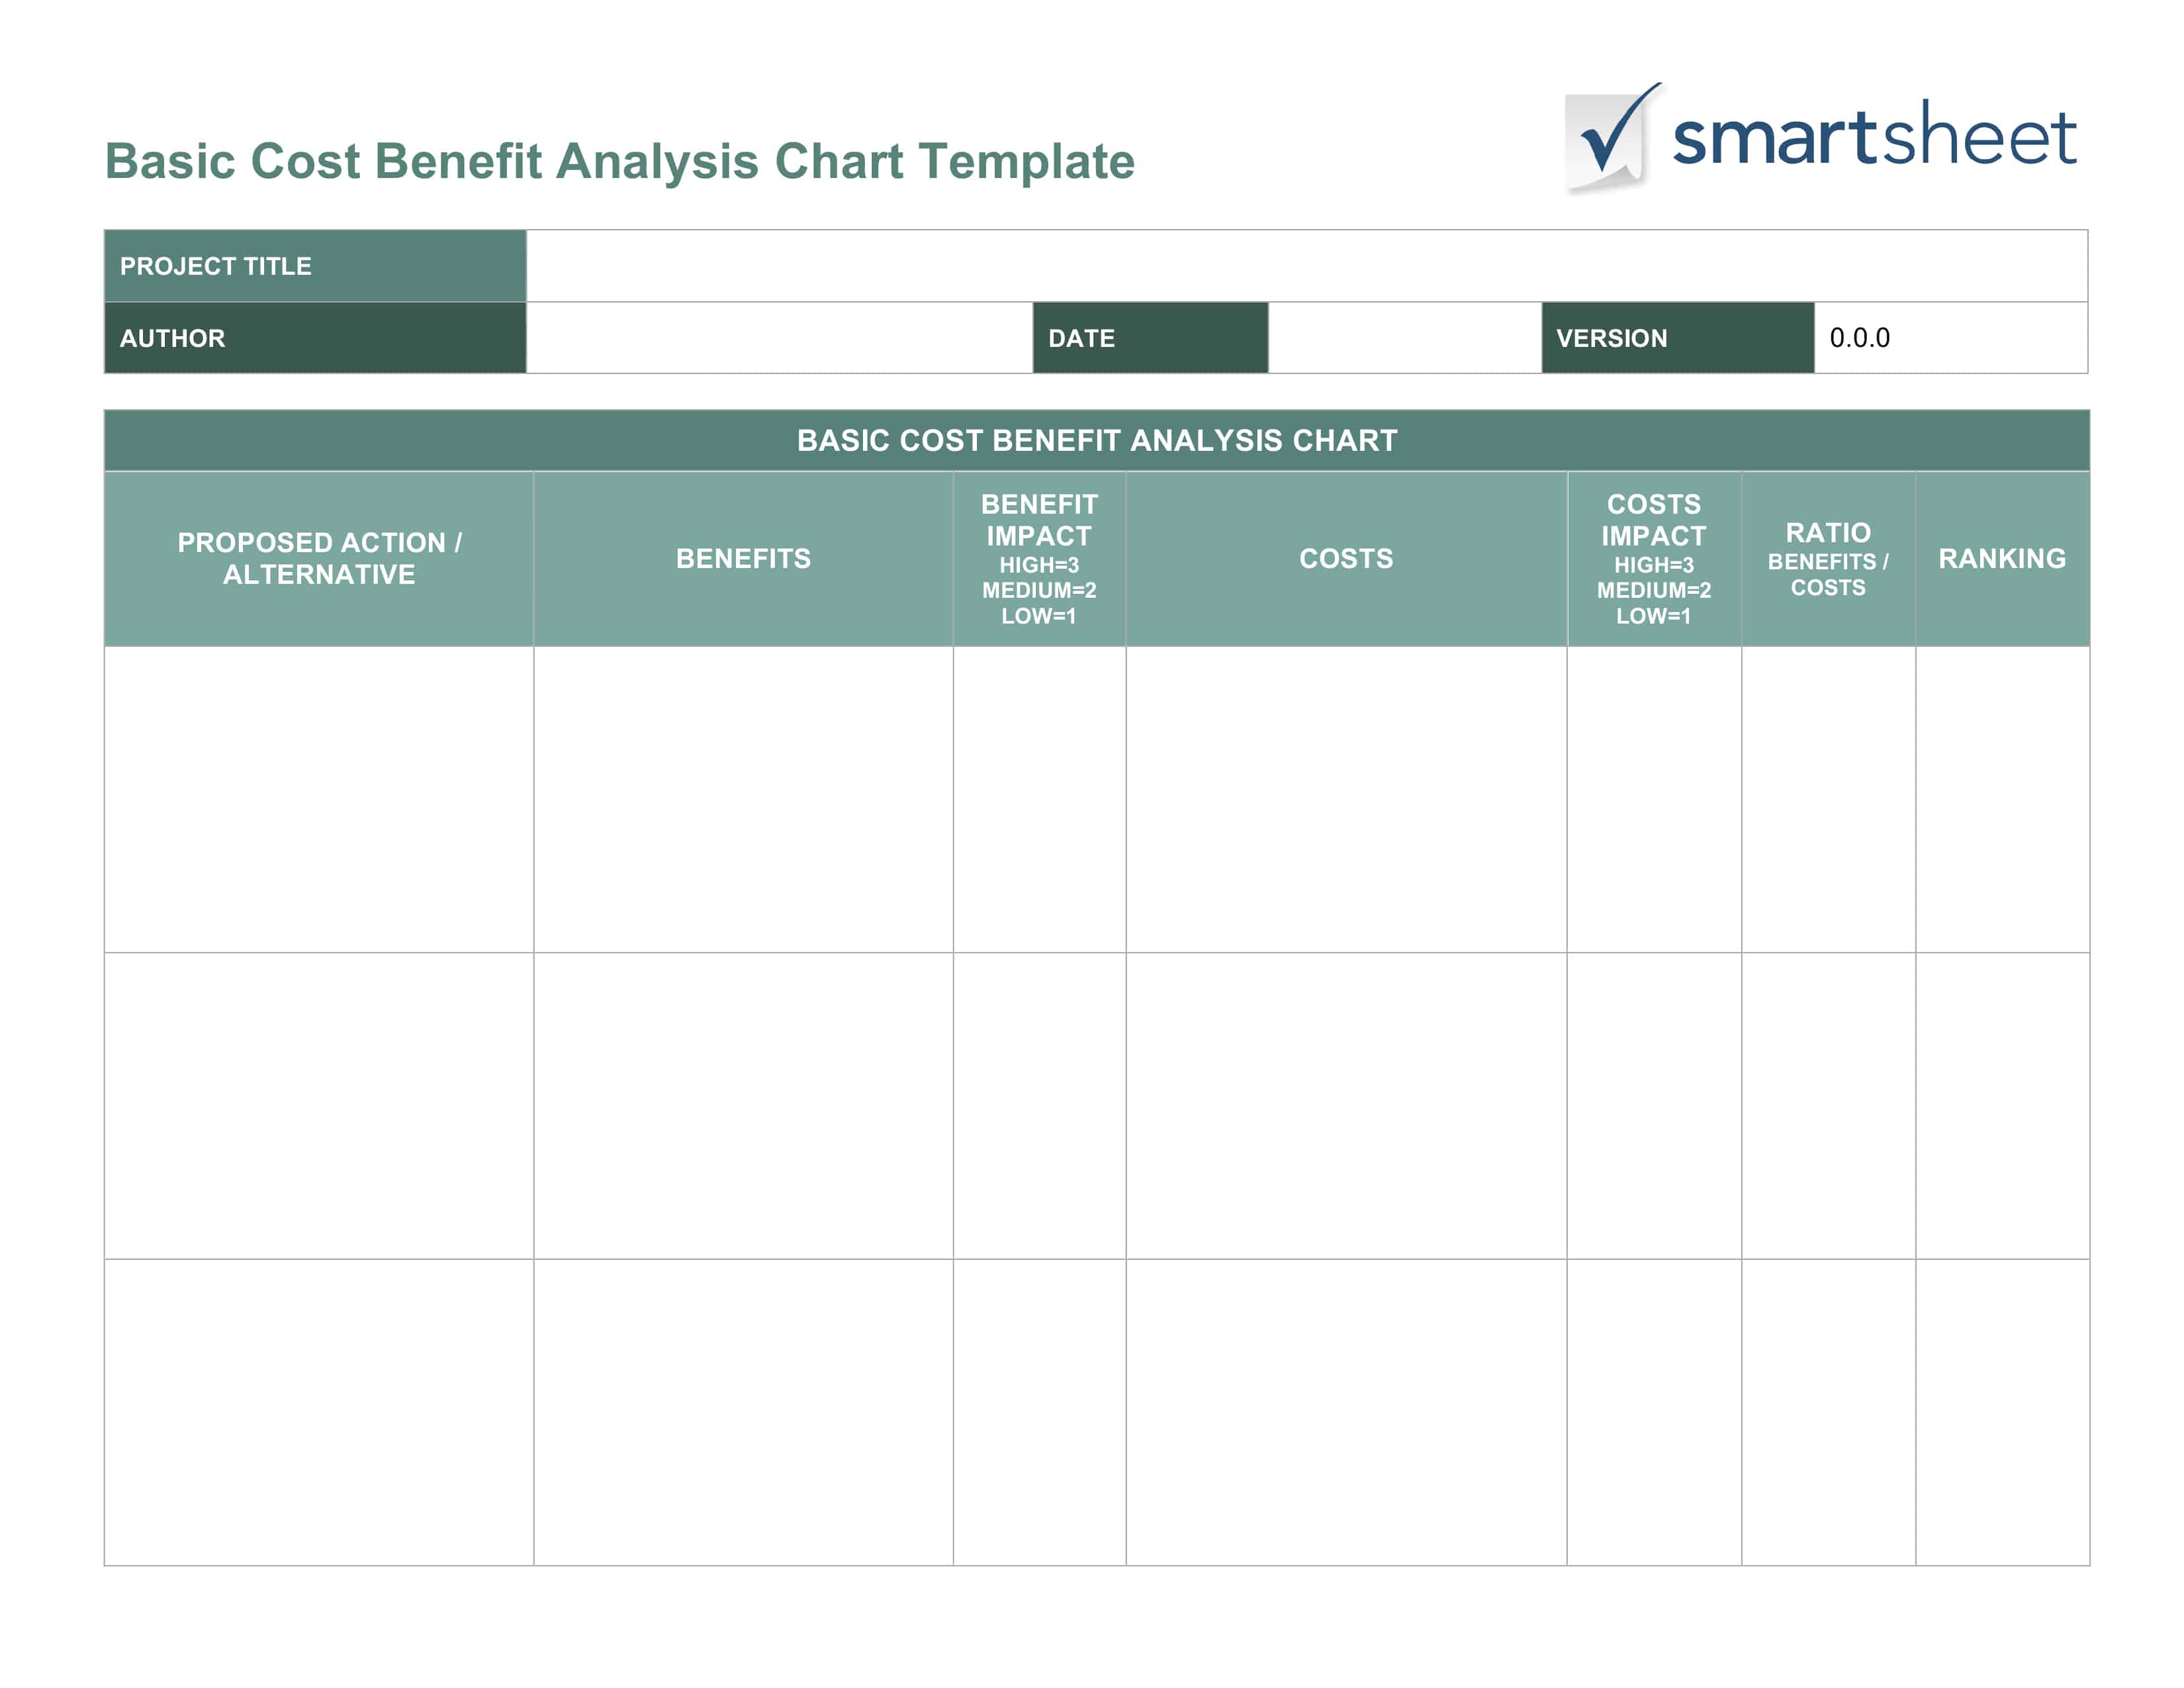
A robust template usually contains six key sections: Objectives, Assumptions, Financial Metrics, Risk Identification, Risk Quantification, and Sensitivity Analysis. Each section feeds into a single spreadsheet or dashboard that delivers a clear risk‑adjusted net present value (NPV) and internal rate of return (IRR).
Objectives and Scope
Define the purpose of the analysis and the decision thresholds. Capture questions such as:
- What is the maximum acceptable risk level?
- Which stakeholder groups must approve the outcome?
- Are there regulatory or compliance constraints?
Assumptions
Document every variable that influences the calculation. For example:
- Projected sales volume
- Unit cost of production
- Discount rate
- Technology adoption rate
Use a dedicated sheet to log each assumption, its source, and its sensitivity range.
Financial Metrics
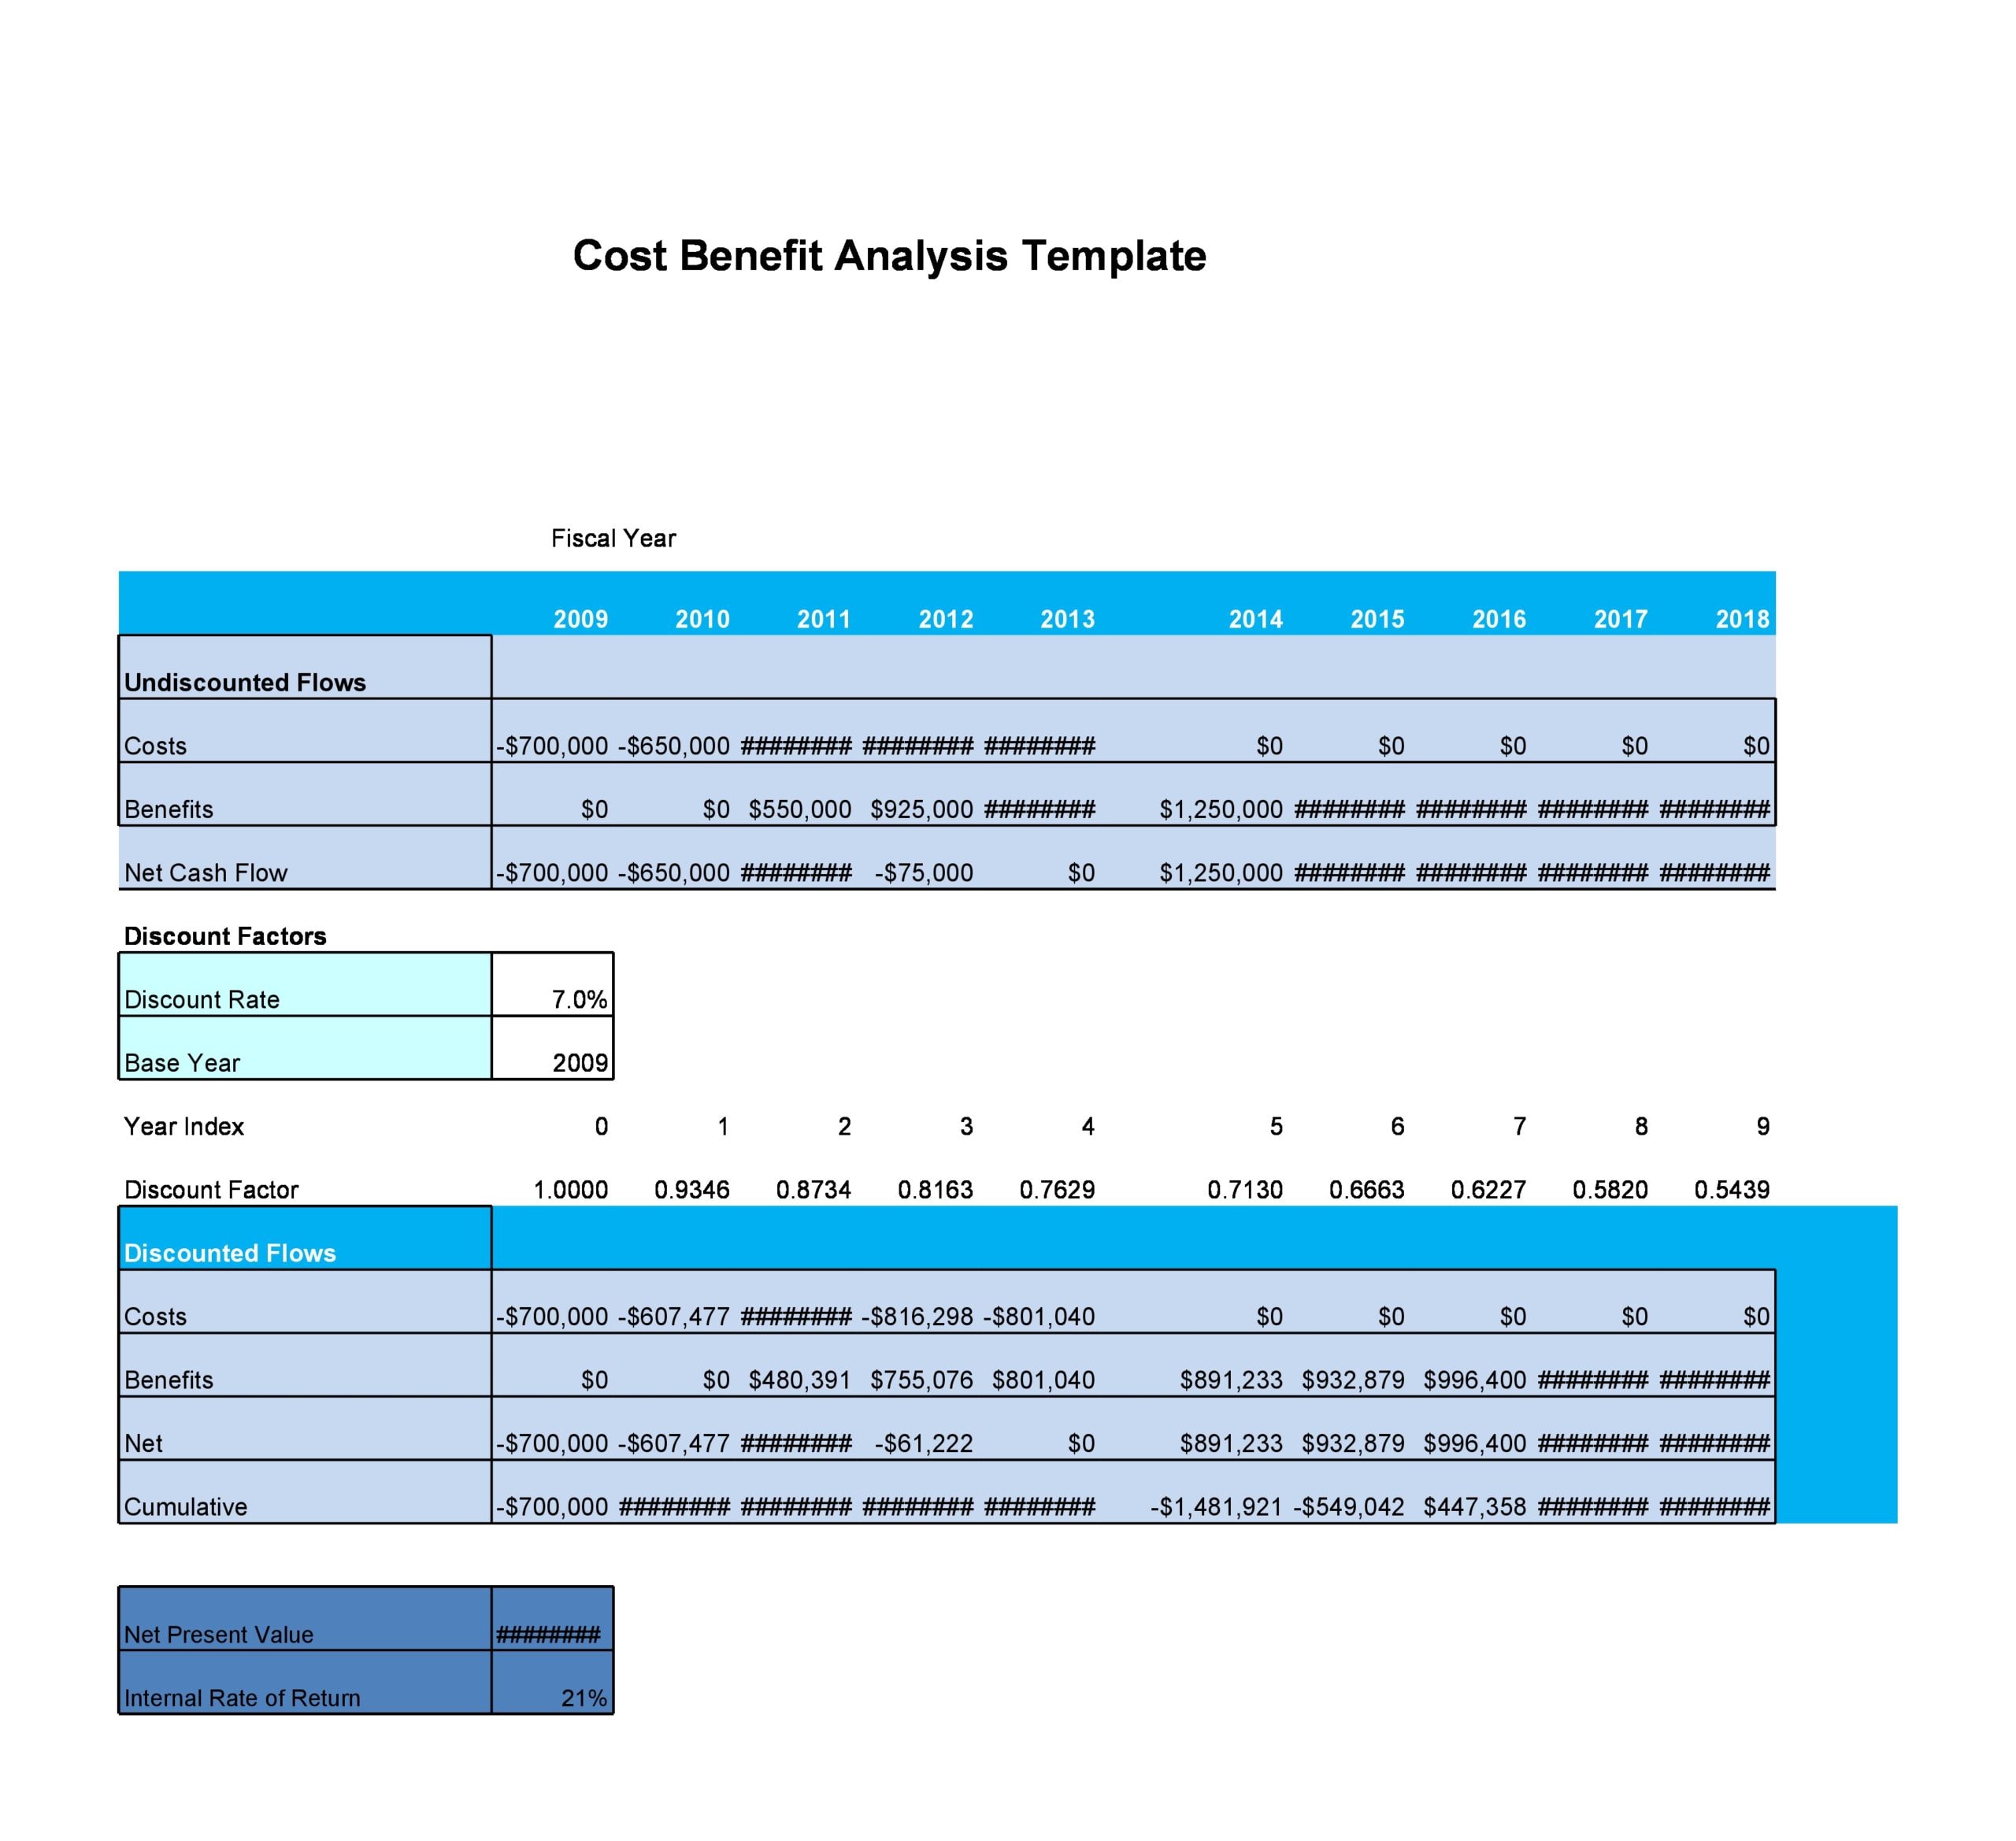
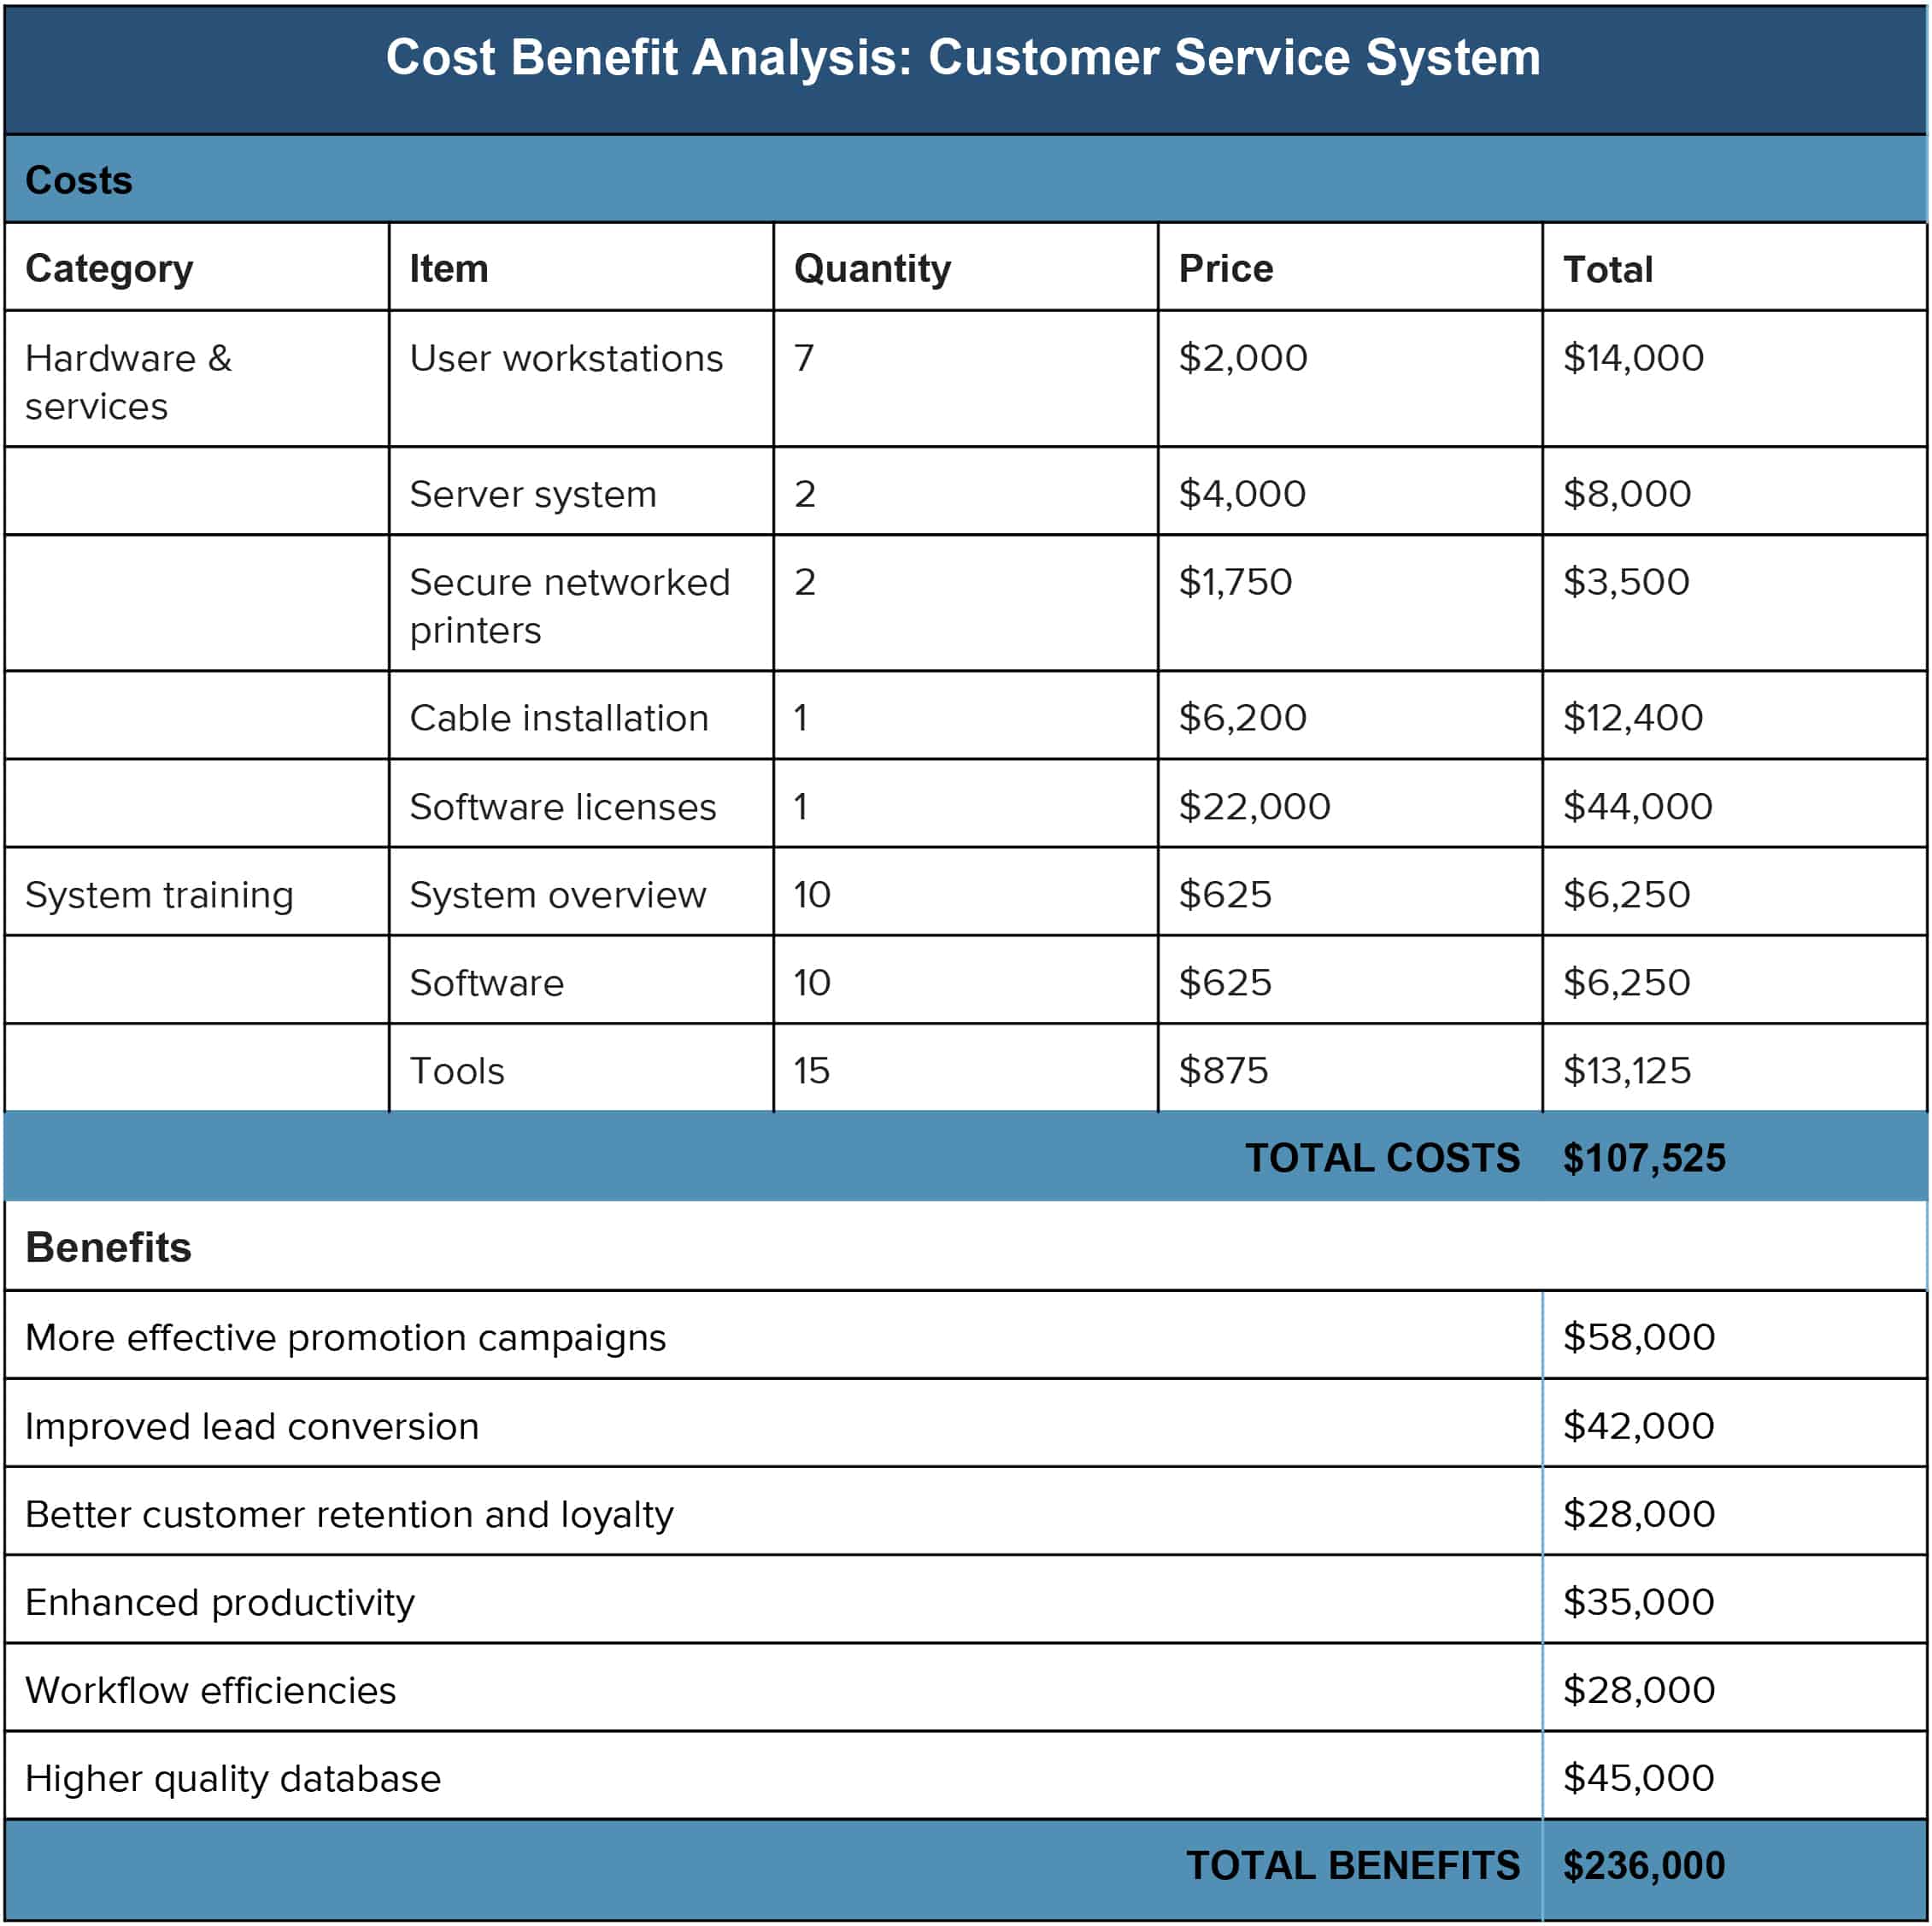
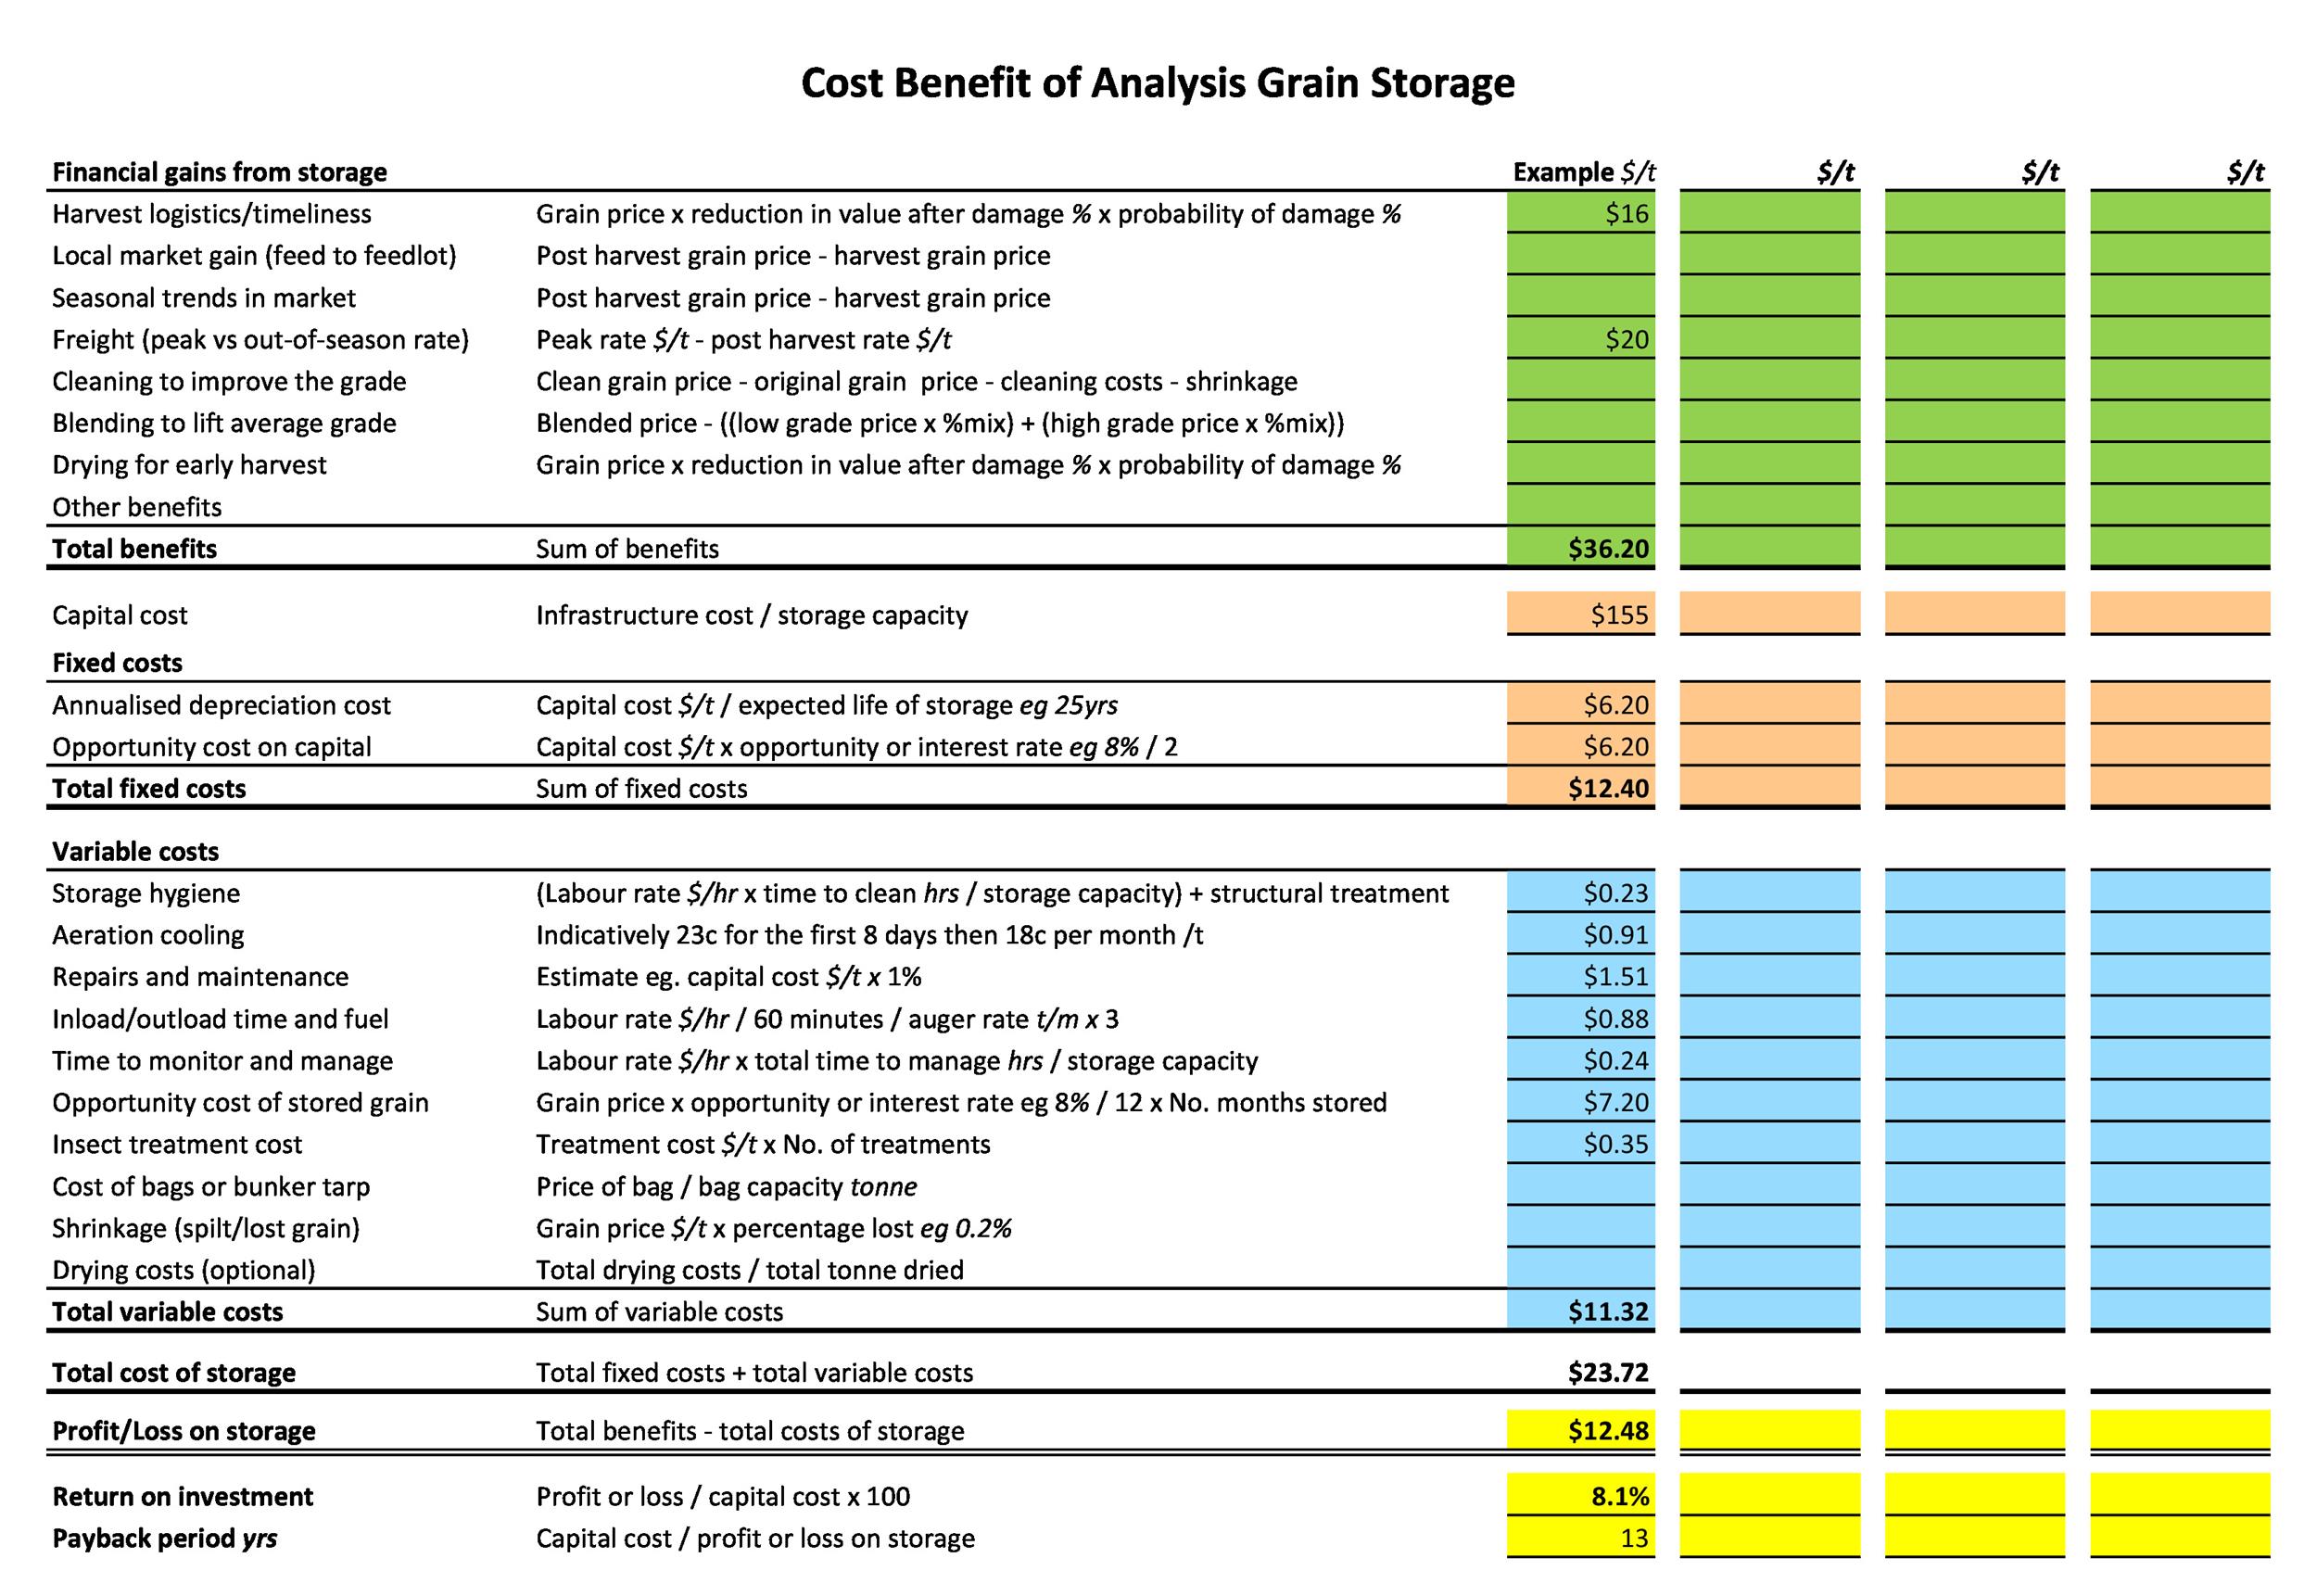
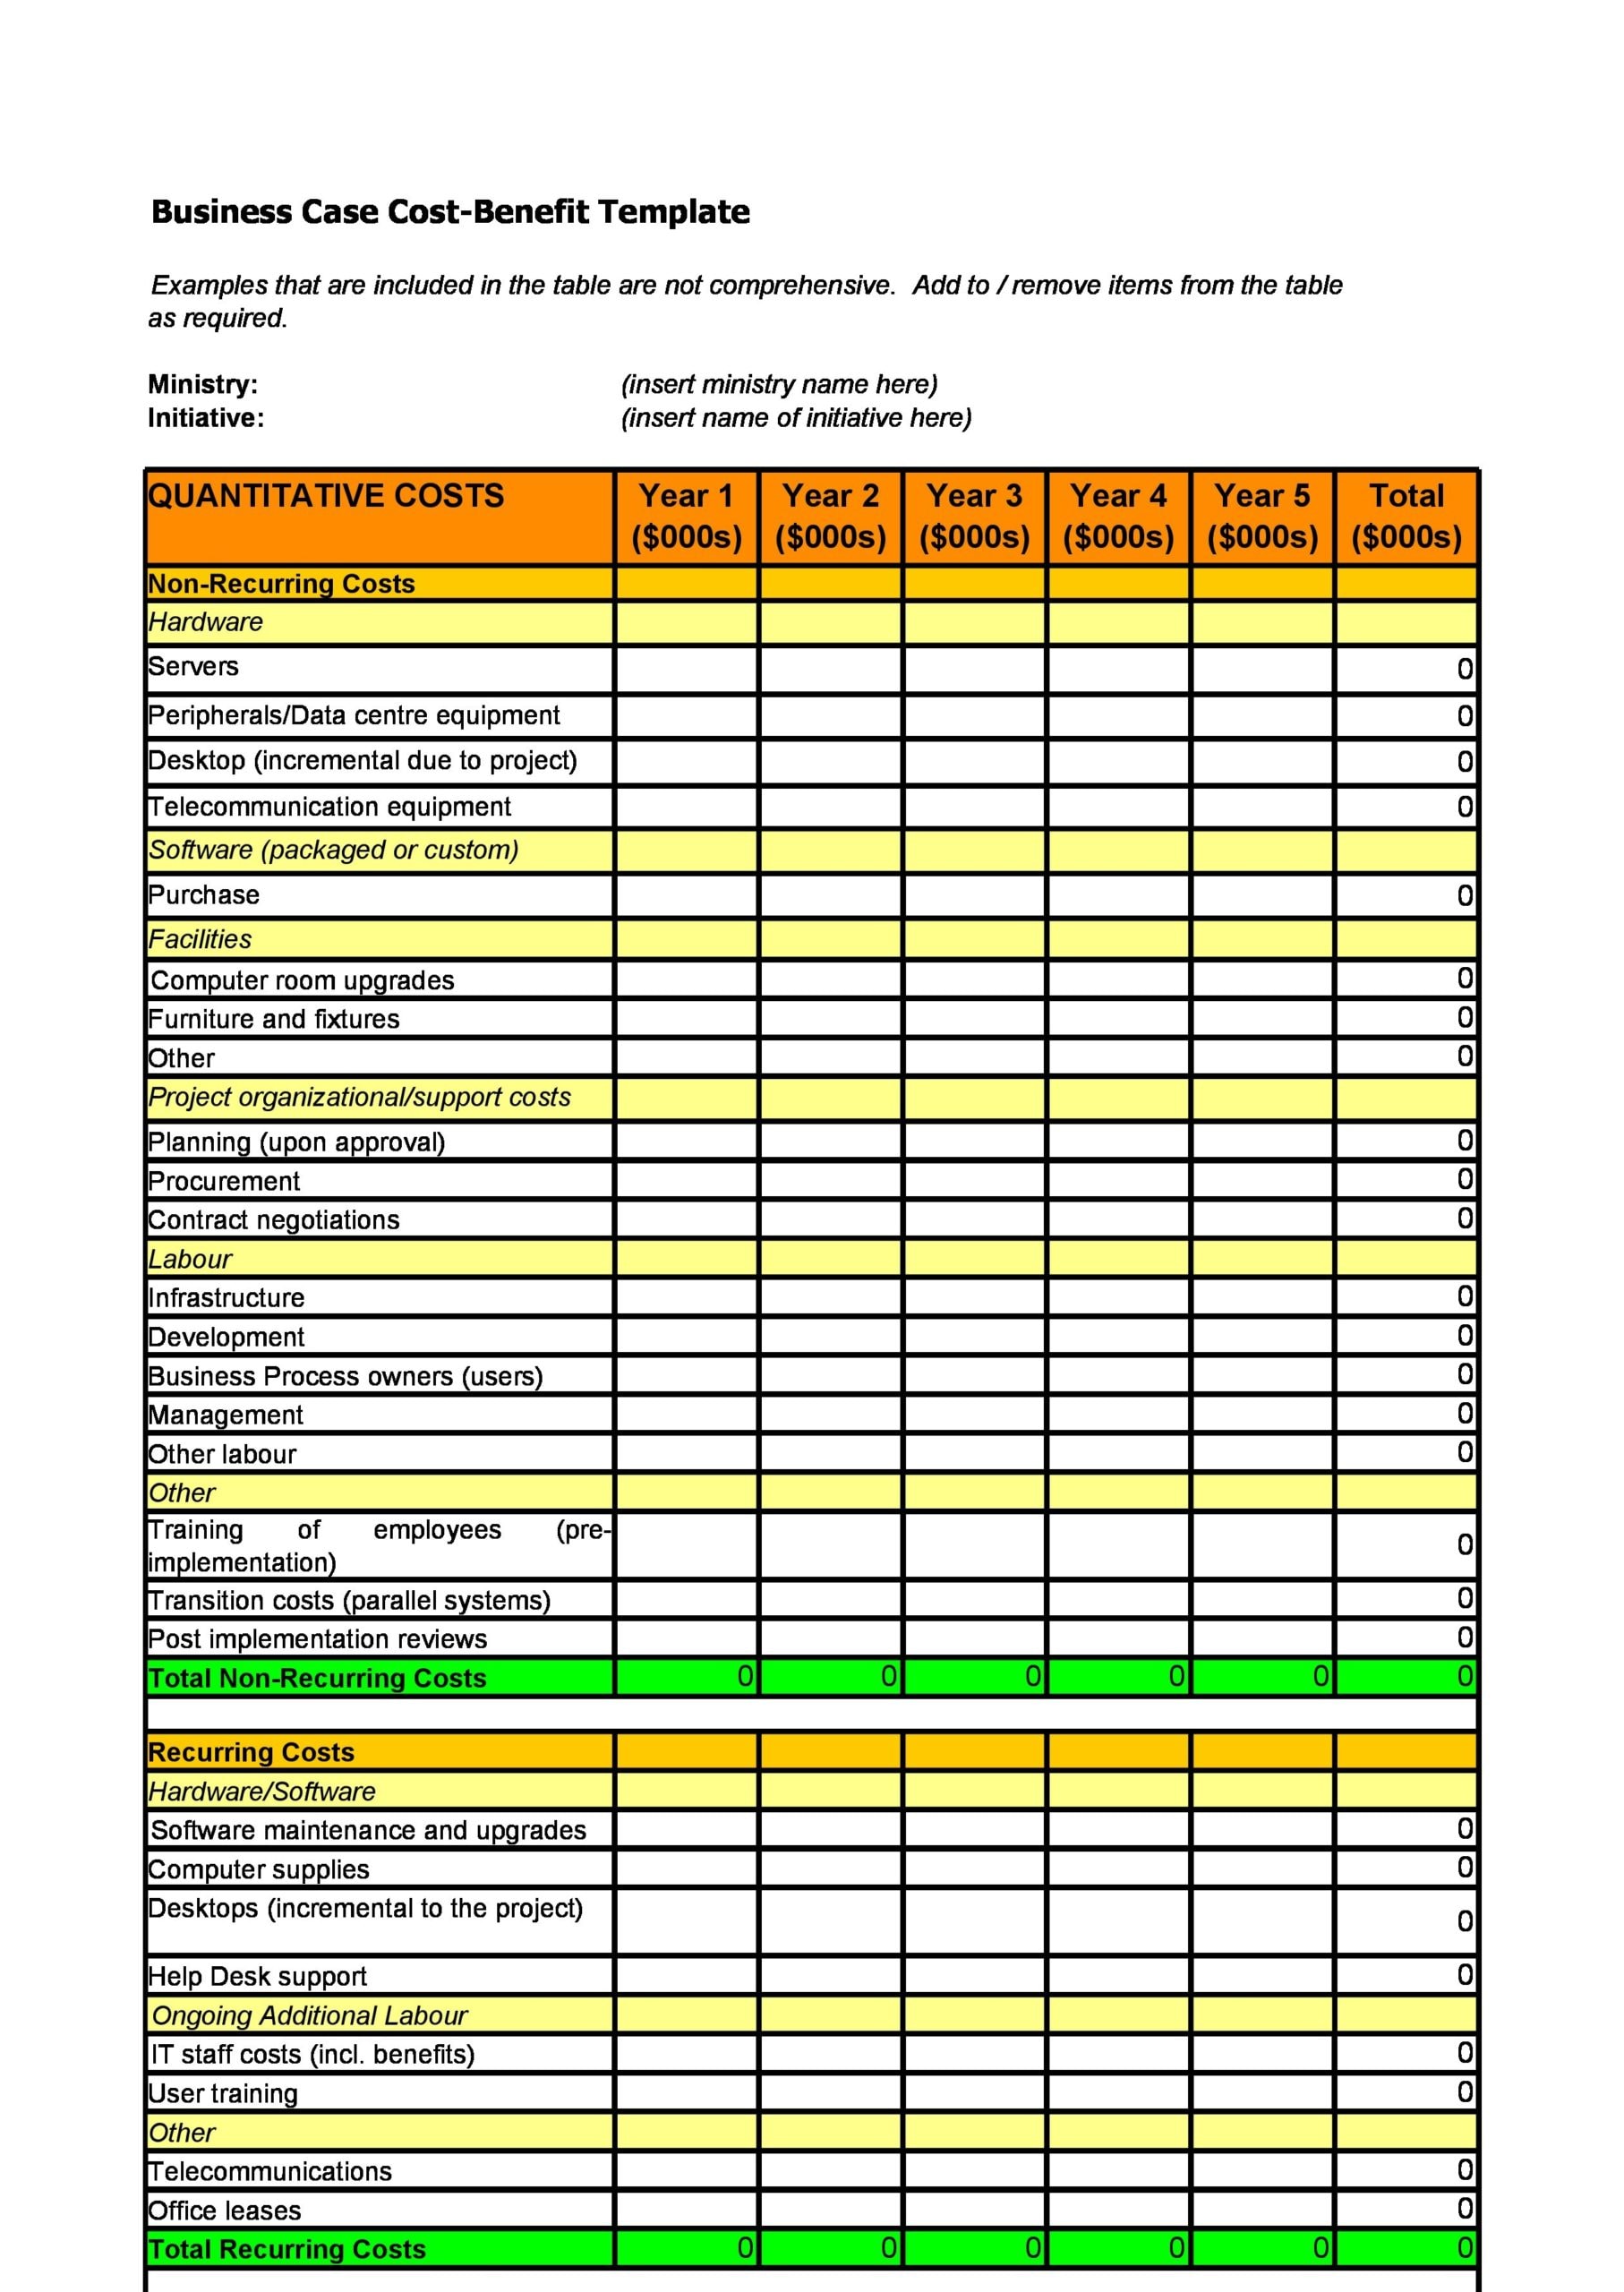
Build a standard cost–benefit flow:
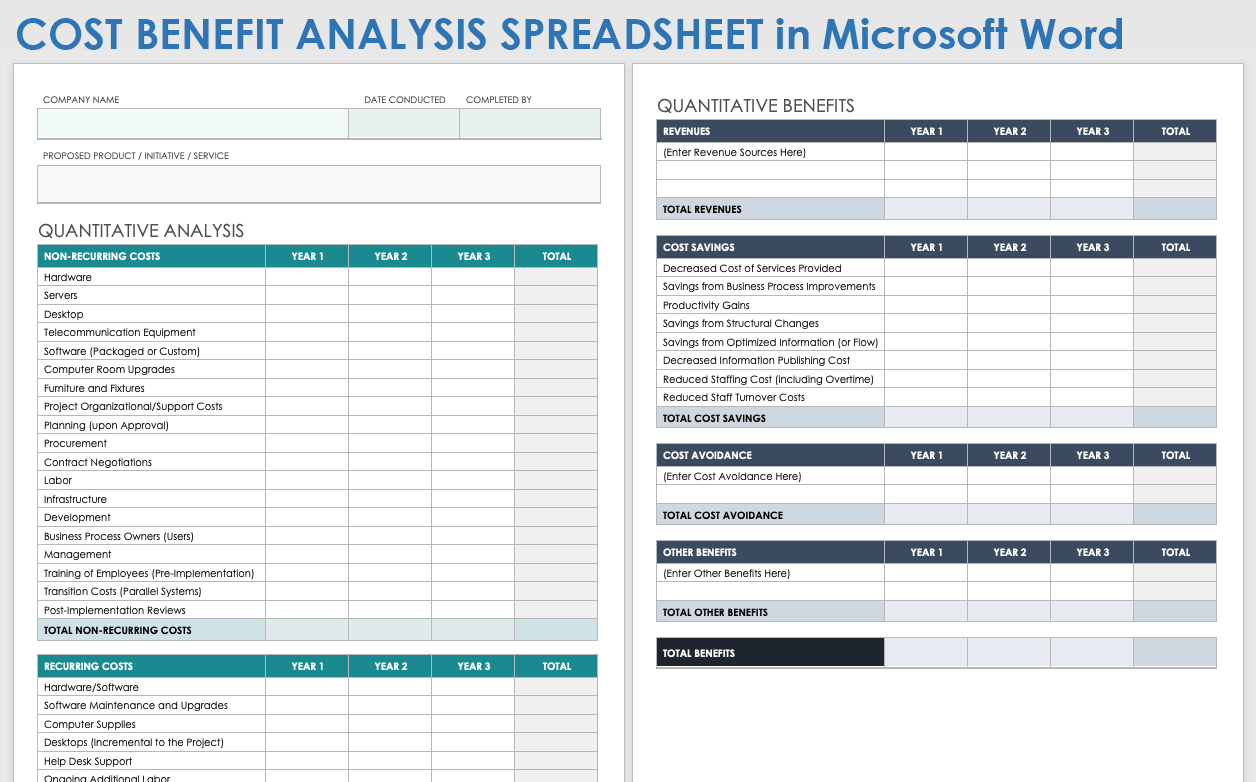
- Revenue Forecasts: Include price per unit, sales volume, and growth rate.
- Operating Costs: Fixed costs, variable costs, and overhead.
- Capital Expenditures: One‑time investments and maintenance expenses.
- Discounting: Apply the appropriate discount rate to capture time value of money.
- Net Present Value (NPV): Sum of discounted cash flows minus initial investment.
- Internal Rate of Return (IRR): The discount rate that makes NPV zero.
Risk Identification
Identify risk categories relevant to the project. Common categories include:
- Market Risk – changes in demand or competition.
- Operational Risk – supply chain disruptions or quality issues.
- Financial Risk – currency fluctuations or credit availability.
- Regulatory Risk – new compliance requirements.
- Technological Risk – adoption of new platforms or obsolescence.
Risk Quantification
Assign a probability and impact to each risk. Two popular methods are:
- Monte Carlo Simulation: Run thousands of iterations to generate probability distributions for NPV and IRR.
- Scenario Analysis: Define best‑case, worst‑case, and most‑likely scenarios to see how outcomes shift.
In the template, each risk receives a risk score calculated as Probability × Impact. High scores trigger deeper investigation or mitigation plans.
Sensitivity Analysis
Use data tables or conditional formatting to identify which variables most affect the NPV. Highlighting these sensitivities allows you to prioritize risk management efforts. For example, if a 5% dip in sales volume drops NPV below the threshold, consider securing a sales guarantee or adjusting the pricing strategy.
Building Your Template: Step‑by‑Step Guide

1. Select the Right Tool
While advanced software such as @RISK or Palisade can automate simulations, most organizations begin with Excel or Google Sheets. Ensure your platform supports:
- Dynamic range definitions
- Data validation for input controls
- Charting capabilities for visual risk reports
2. Create a Clear Layout
Divide the workbook into distinct tabs:
- Input Assumptions
- Financial Model
- Risk Register
- Simulation Results
- Dashboard
Use named ranges to simplify formulas and reduce errors.
3. Populate Assumptions
For each assumption, add:
- A brief description
- Source of data
- Assumed value and range (min/max)
- Probability of variation (if applicable)
4. Build the Core Financial Model
Link the assumptions to a cash flow statement. Apply the discount factor:
Discounted Cash Flow = Cash Flow / (1 + Discount Rate)^Year
Sum the discounted cash flows to calculate NPV.
5. Integrate Risk Scores
Create a risk register table. Each row contains:
- Risk Description
- Likelihood (1–5)
- Impact (1–5)
- Risk Score = Likelihood × Impact
- Mitigation Strategy
Use conditional formatting to flag high‑score risks in red.
6. Run Simulations
Set up a Monte Carlo engine or scenario matrix:
- Define input distributions for uncertain variables.
- Specify the number of iterations (e.g., 5,000).
- Generate output tables showing NPV percentiles.
Visualize results with histograms or tornado charts.
7. Develop a Dashboard
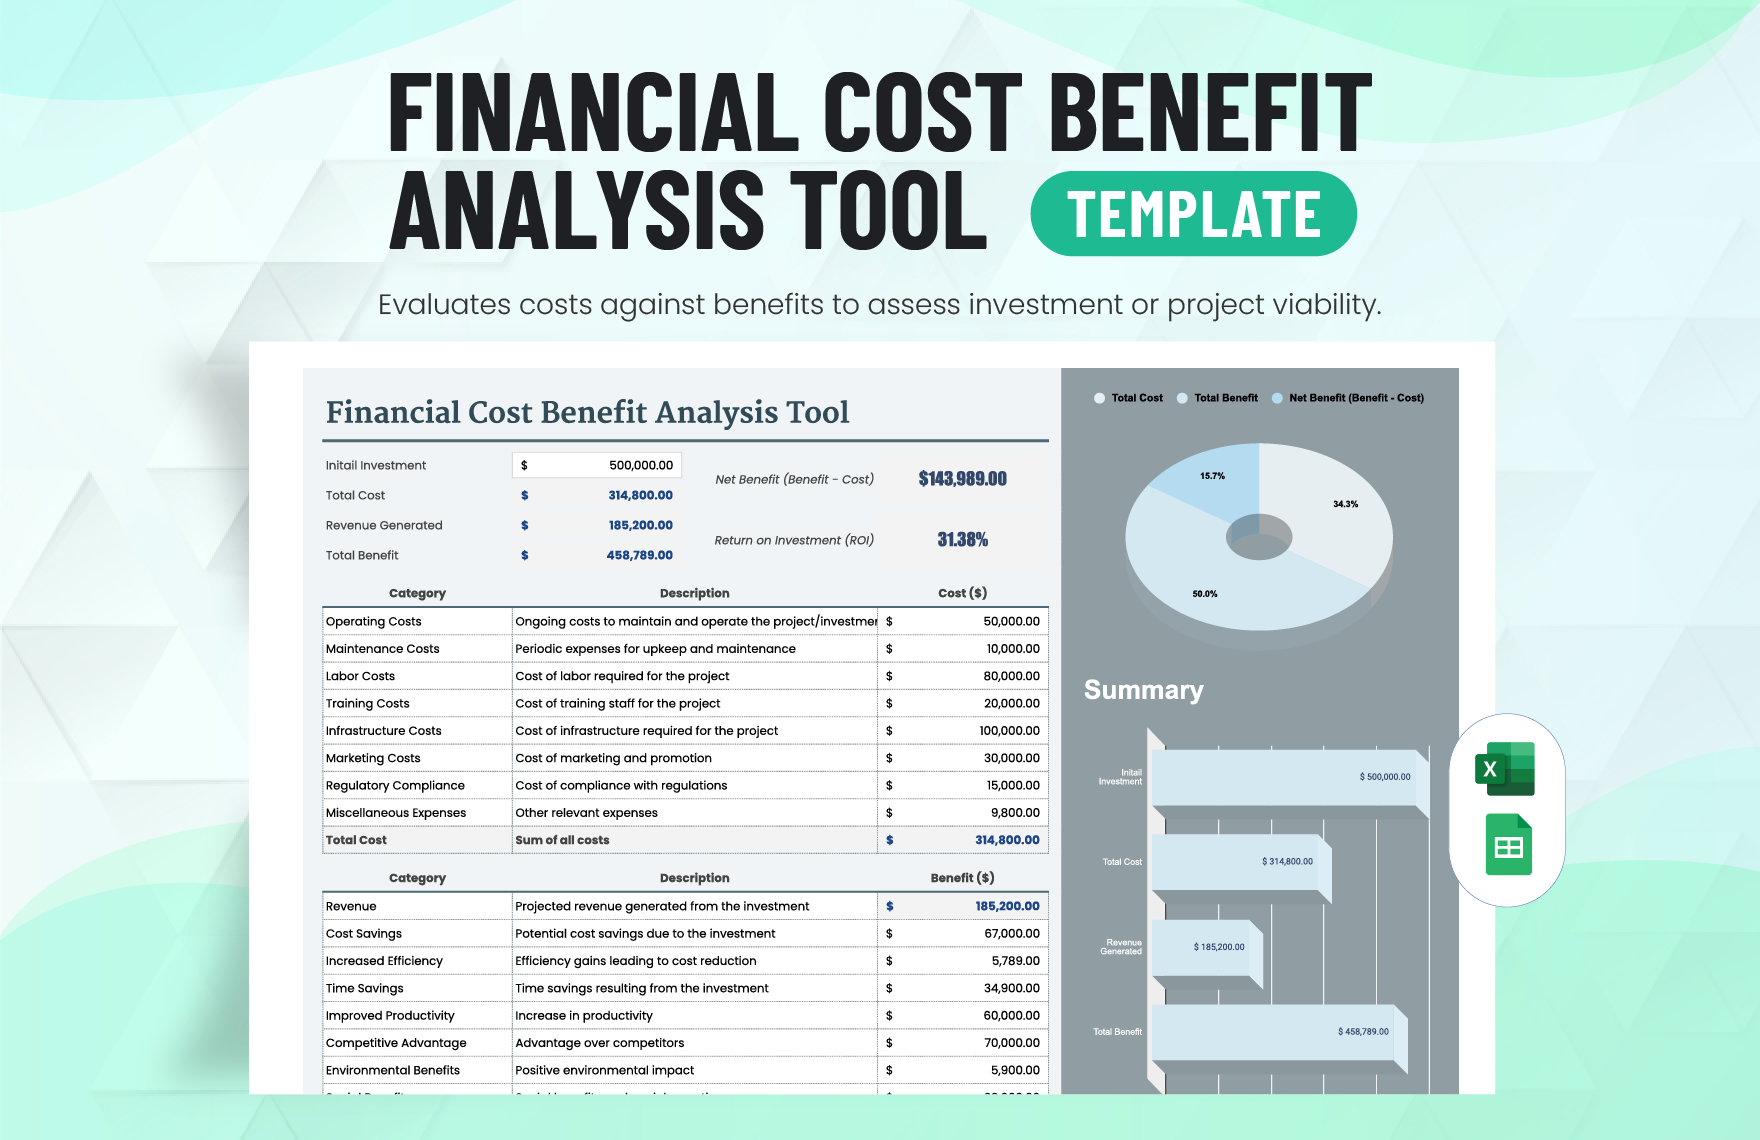
Consolidate key metrics into a single view:
- NPV and IRR with confidence intervals.
- Probability of achieving the target NPV.
- Top five risk drivers.
- Recommended actions for risk mitigation.
Use slicers or dropdowns to let decision makers explore alternative scenarios interactively.
Applying the Template to Different Industries
Technology Start‑ups
For new software initiatives, the template helps quantify uncertainties in user adoption, platform integration, and data privacy compliance. By modeling different pricing strategies and churn rates, founders can choose the path with the highest risk‑adjusted payoff.
Construction Projects
In construction, the template is invaluable for estimating overruns, regulatory delays, and material price volatility. Integrating a risk register for supplier reliability and labor availability ensures that contingency budgets are based on quantifiable data.
Healthcare Programs
When launching a new health service, risk factors such as patient uptake, reimbursement rates, and regulatory changes are critical. A Cost Benefit Risk Analysis Template can align clinical outcomes with financial performance, providing a holistic view for hospital administrators.
Best Practices for Maintaining Accuracy

Keep Assumptions Transparent
Document every assumption in a change log. When new data arrives, update the log and recalibrate the model to maintain integrity.
Validate Input Data
Cross‑check key inputs with external benchmarks—industry averages, market reports, or expert interviews. A single outlier can skew the entire analysis.
Review Risk Scores Periodically
Risk appetite evolves. Perform quarterly reviews to adjust likelihoods or impacts, ensuring the template remains relevant.
Involve Cross‑Functional Teams
Engage finance, operations, legal, and risk departments to capture diverse perspectives. Their insights enrich the risk register and improve model robustness.
Common Pitfalls and How to Avoid Them

Overlooking Correlation Between Risks
Assuming risks are independent can underestimate portfolio risk. Use correlation matrices to capture interdependencies, especially in financial or market risk modeling.
Relying on Static Discount Rates
A fixed discount rate may not reflect changing macroeconomic conditions. Implement a dynamic rate that adjusts based on inflation, credit spreads, or project maturity.
Ignoring Qualitative Factors
Quantitative metrics alone rarely capture strategic fit or brand impact. Combine the template with a strategic scoring system that evaluates qualitative elements.
Conclusion: Turning Uncertainty into Opportunity
A well‑structured Cost Benefit Risk Analysis Template transforms speculative decisions into data‑driven strategies. By weaving together financial projections, risk scoring, and scenario analysis, organizations can navigate complex projects with confidence. Whether you’re launching a new product, constructing a building, or expanding into new markets, this template equips you to quantify value, manage uncertainty, and secure stakeholder buy‑in. The next step is to adapt the framework to your specific context, populate it with accurate data, and let the insights guide your strategic choices.

Related posts of "Cost Benefit Risk Analysis Template"
