
Financial Cost Benefit Analysis Template is the cornerstone of disciplined decision‑making for any organization that wants to weigh monetary outcomes before committing resources, and this article shows exactly how to master it from concept to execution.
Understanding Financial Cost Benefit Analysis

Cost‑benefit analysis (CBA) is a systematic approach that quantifies the total expected costs of a project or investment against its anticipated benefits, expressed in monetary terms. By converting intangible outcomes—such as risk reduction, brand equity, or employee satisfaction—into dollars, CBA provides a clear, objective basis for comparing alternatives. The analysis typically includes direct costs (materials, labor), indirect costs (overhead, opportunity cost), and the time value of money through discounting. Benefits may be revenue uplift, cost avoidance, or efficiency gains. When performed correctly, CBA answers the critical question: “Is the expected return worth the investment?”
Why a Template Is Essential
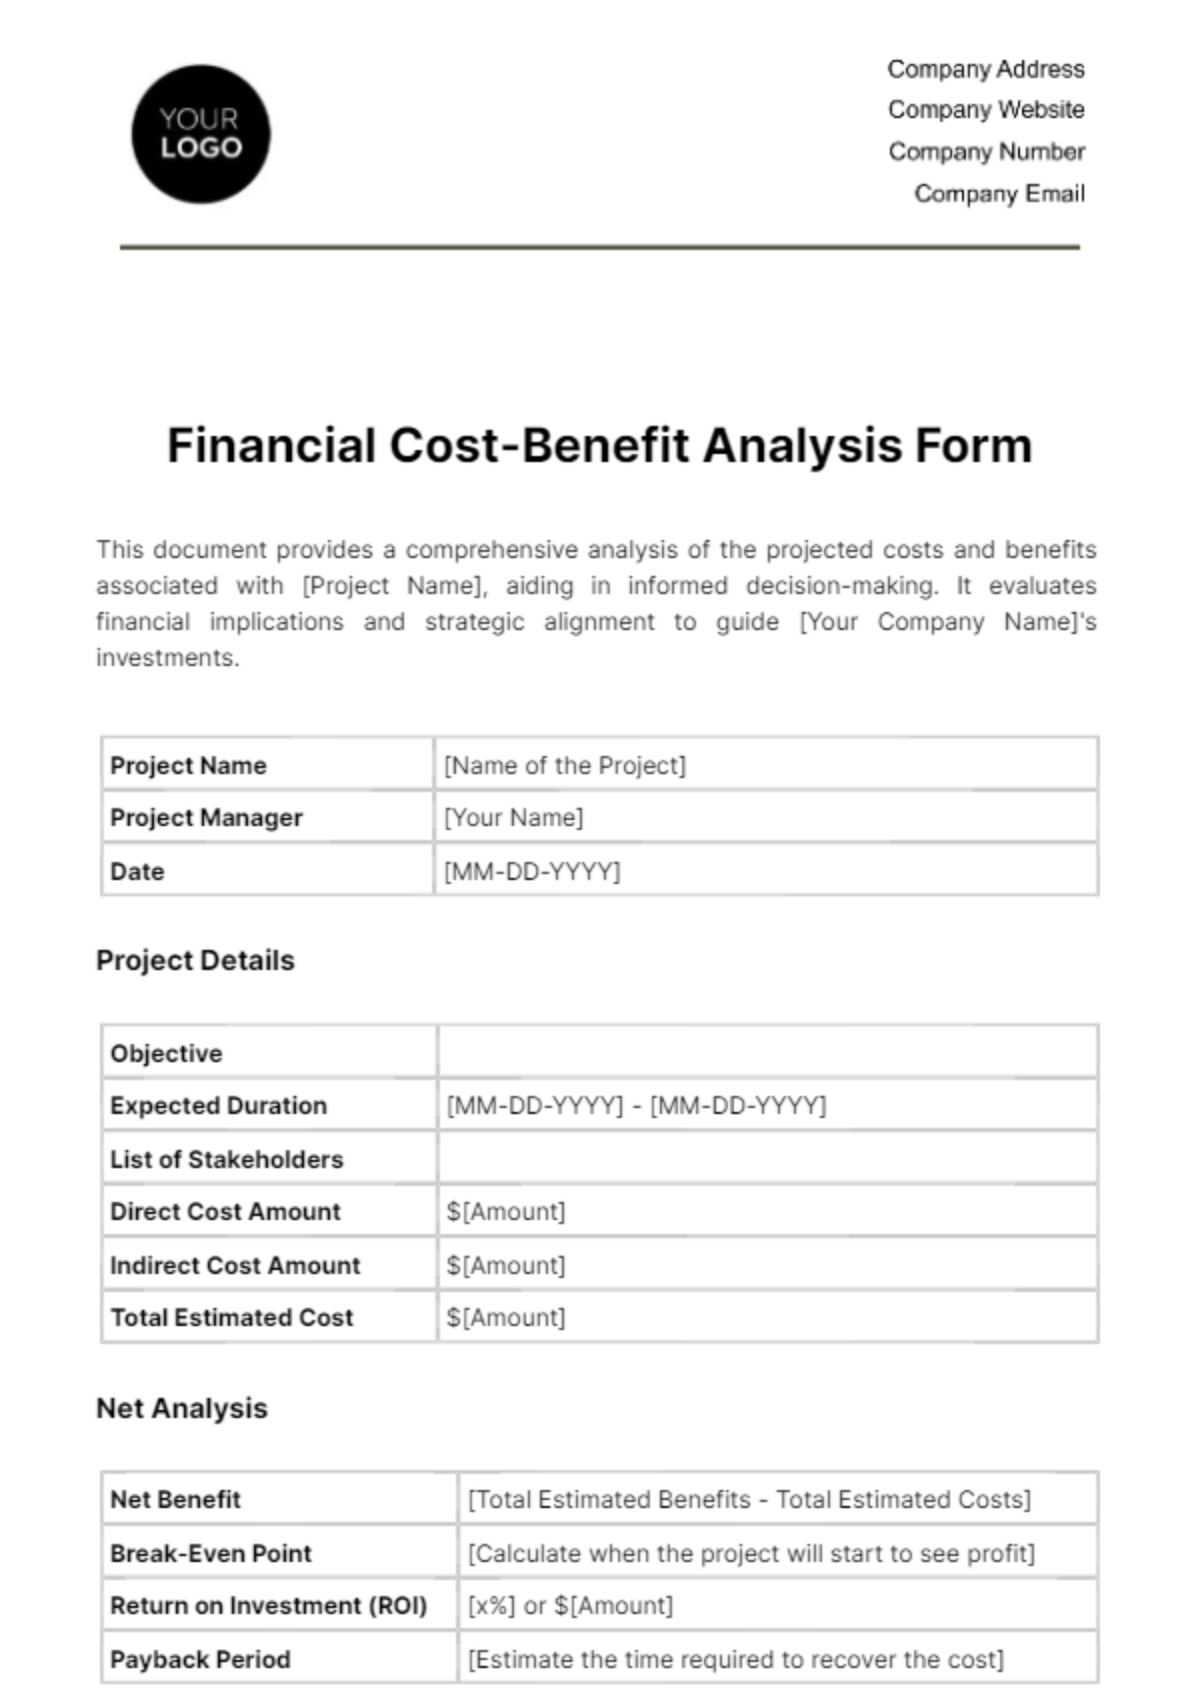
Manually recreating the same calculations for every project is inefficient and error‑prone. A well‑designed template standardizes methodology, ensures consistency across departments, and accelerates the analysis cycle. It also embeds best‑practice formulas—such as net present value (NPV), internal rate of return (IRR), and payback period—so users don’t have to reinvent the wheel each time. Moreover, a template acts as a living document that can be audited, version‑controlled, and shared with stakeholders, reinforcing transparency and accountability.
Core Components of a Financial Cost Benefit Analysis Template
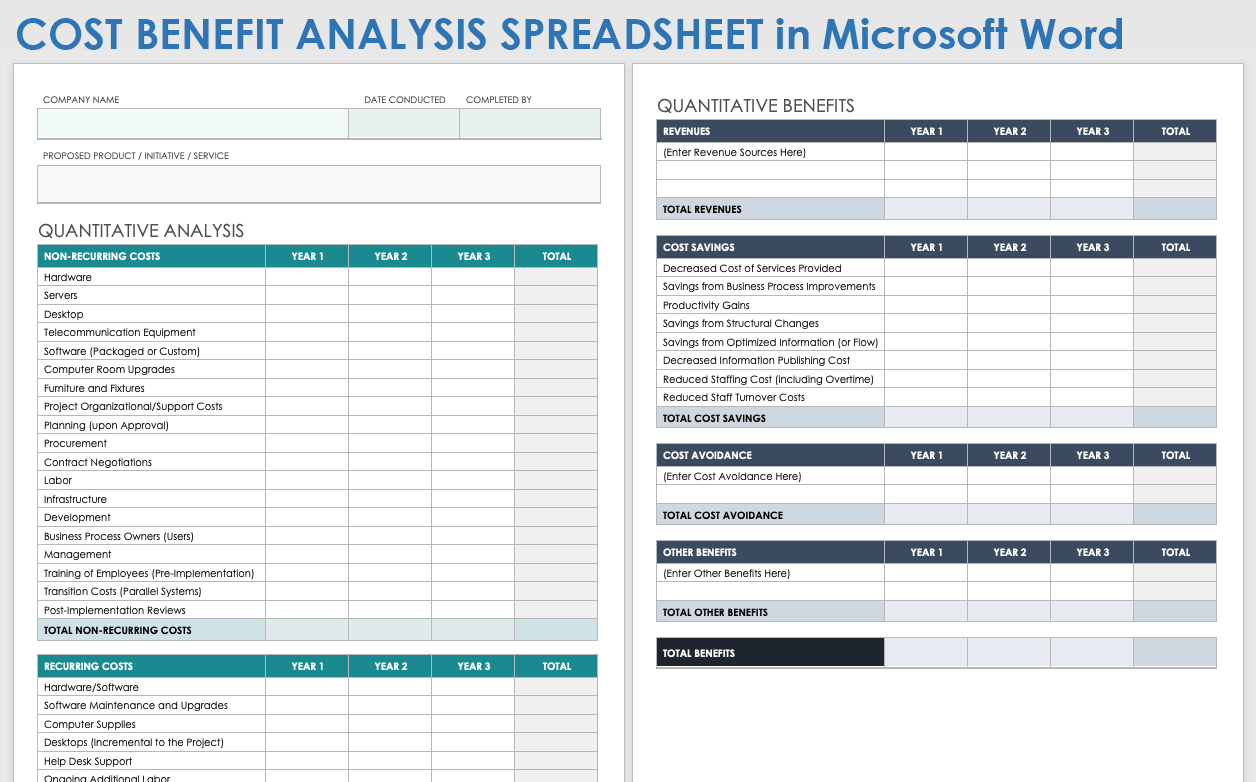
A robust template is built around several key sections, each serving a distinct purpose in the analytical workflow.
Project Overview
Capture the project name, description, sponsor, timeline, and strategic objectives. This context frames the analysis and aligns it with corporate goals.
Assumptions and Variables
List all assumptions—such as inflation rates, discount rates, and growth forecasts—so that readers can understand the basis of the calculations and adjust them as needed.
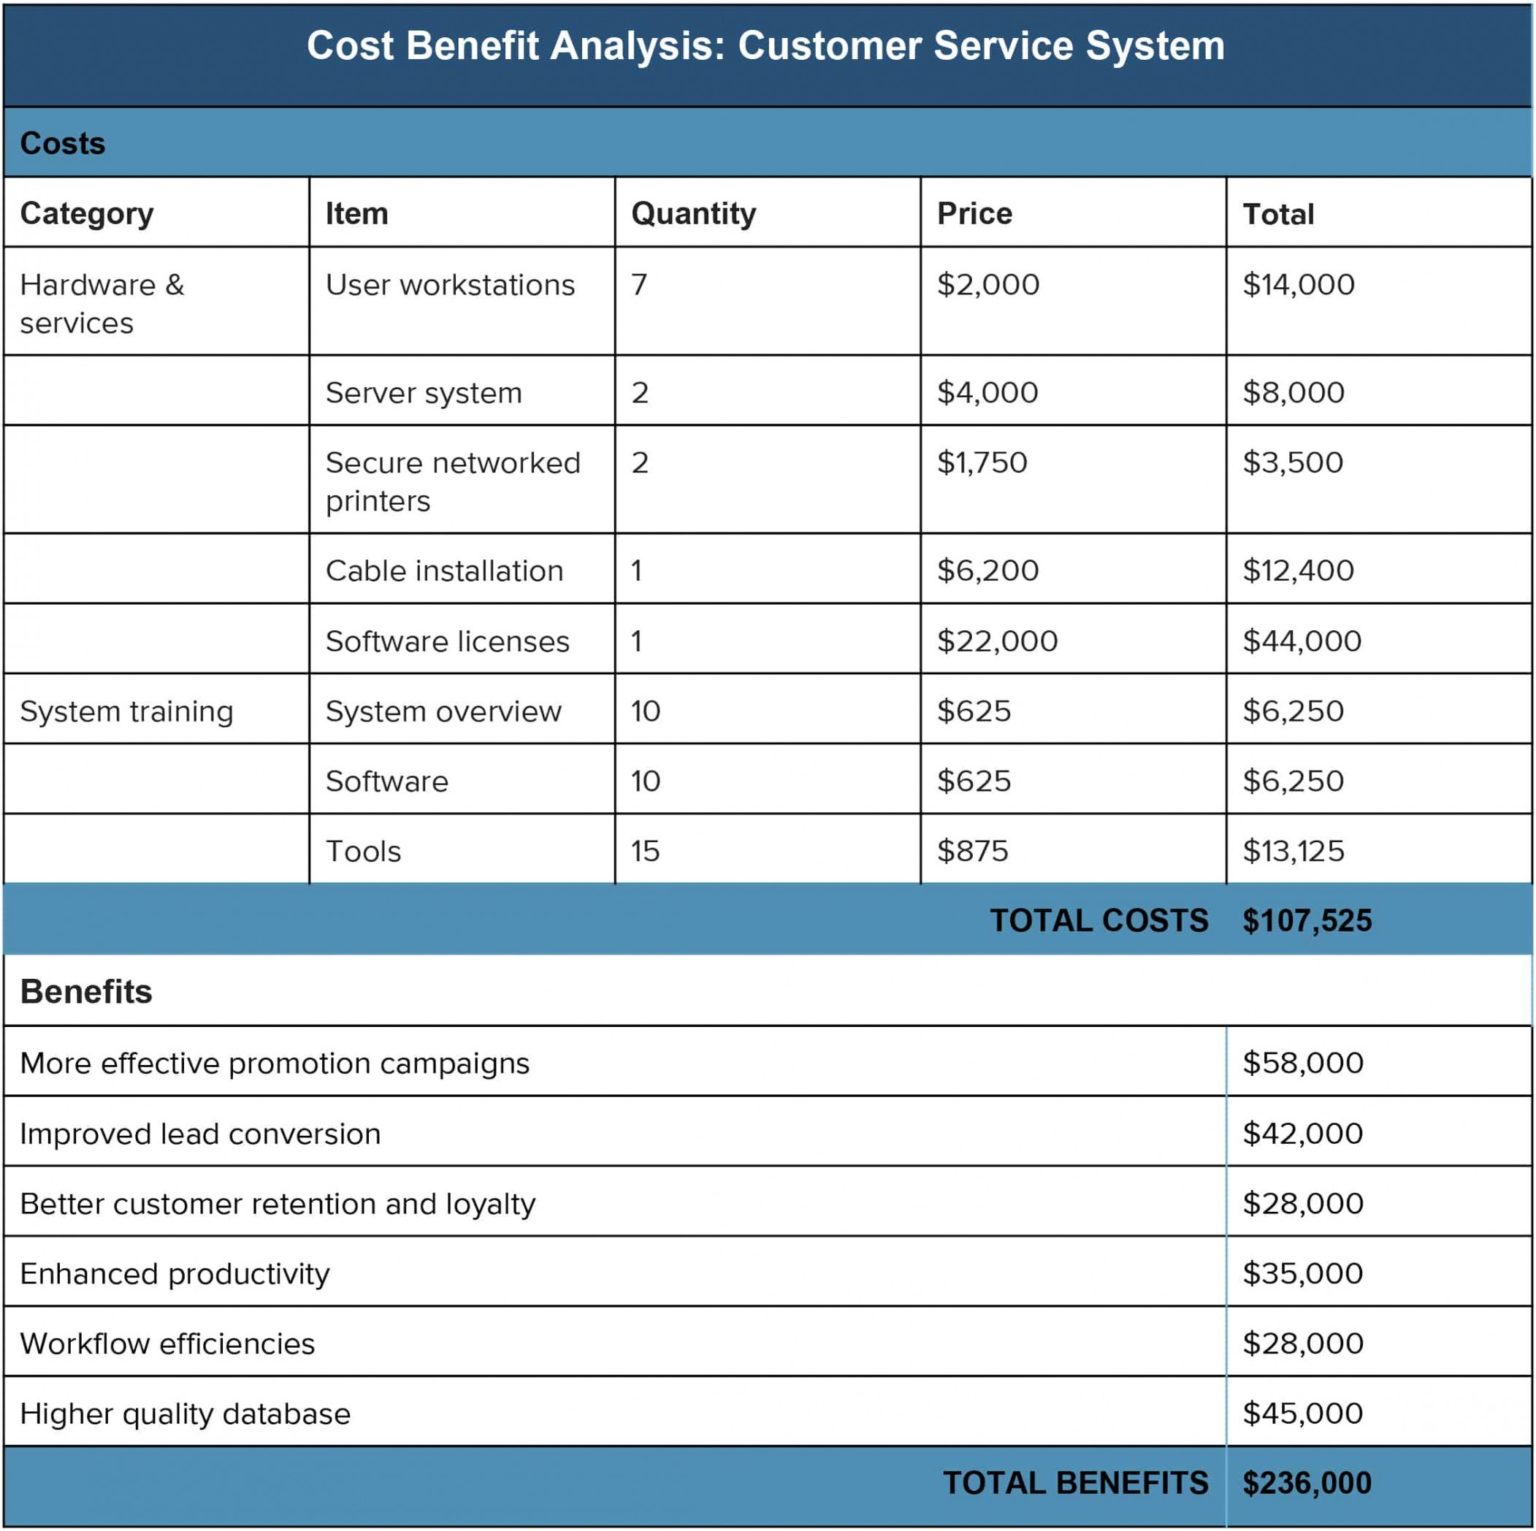
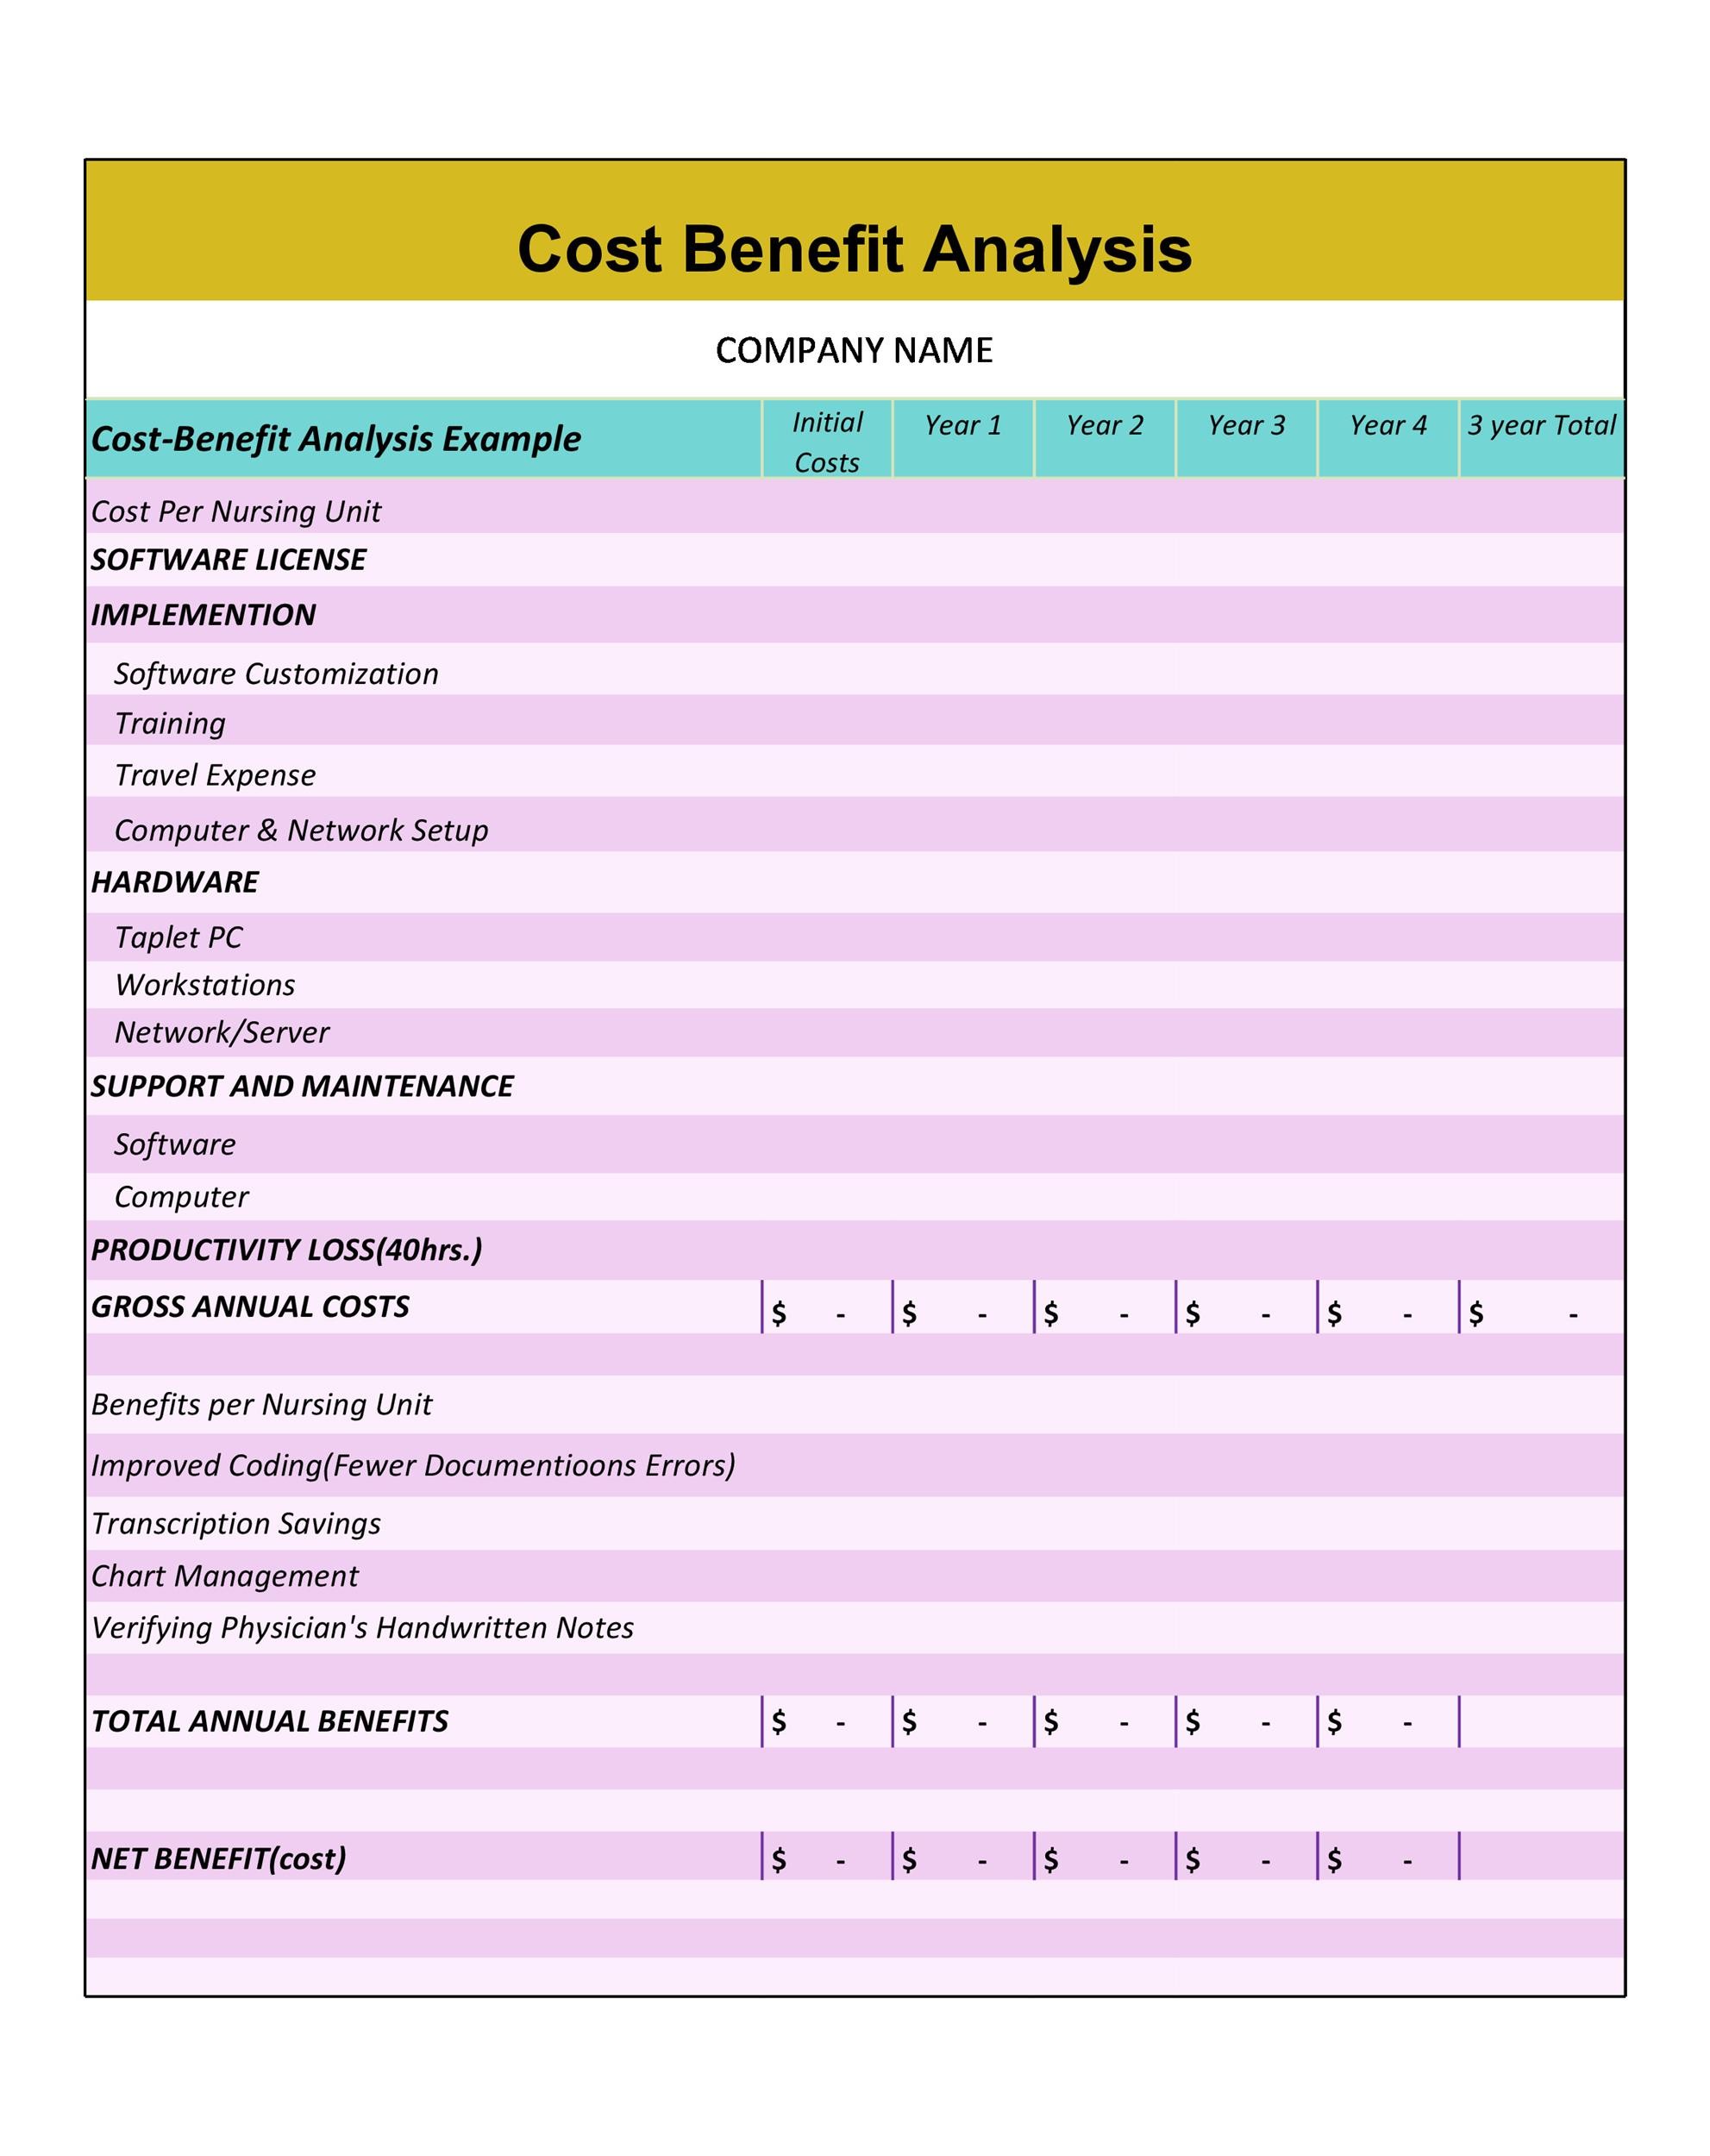
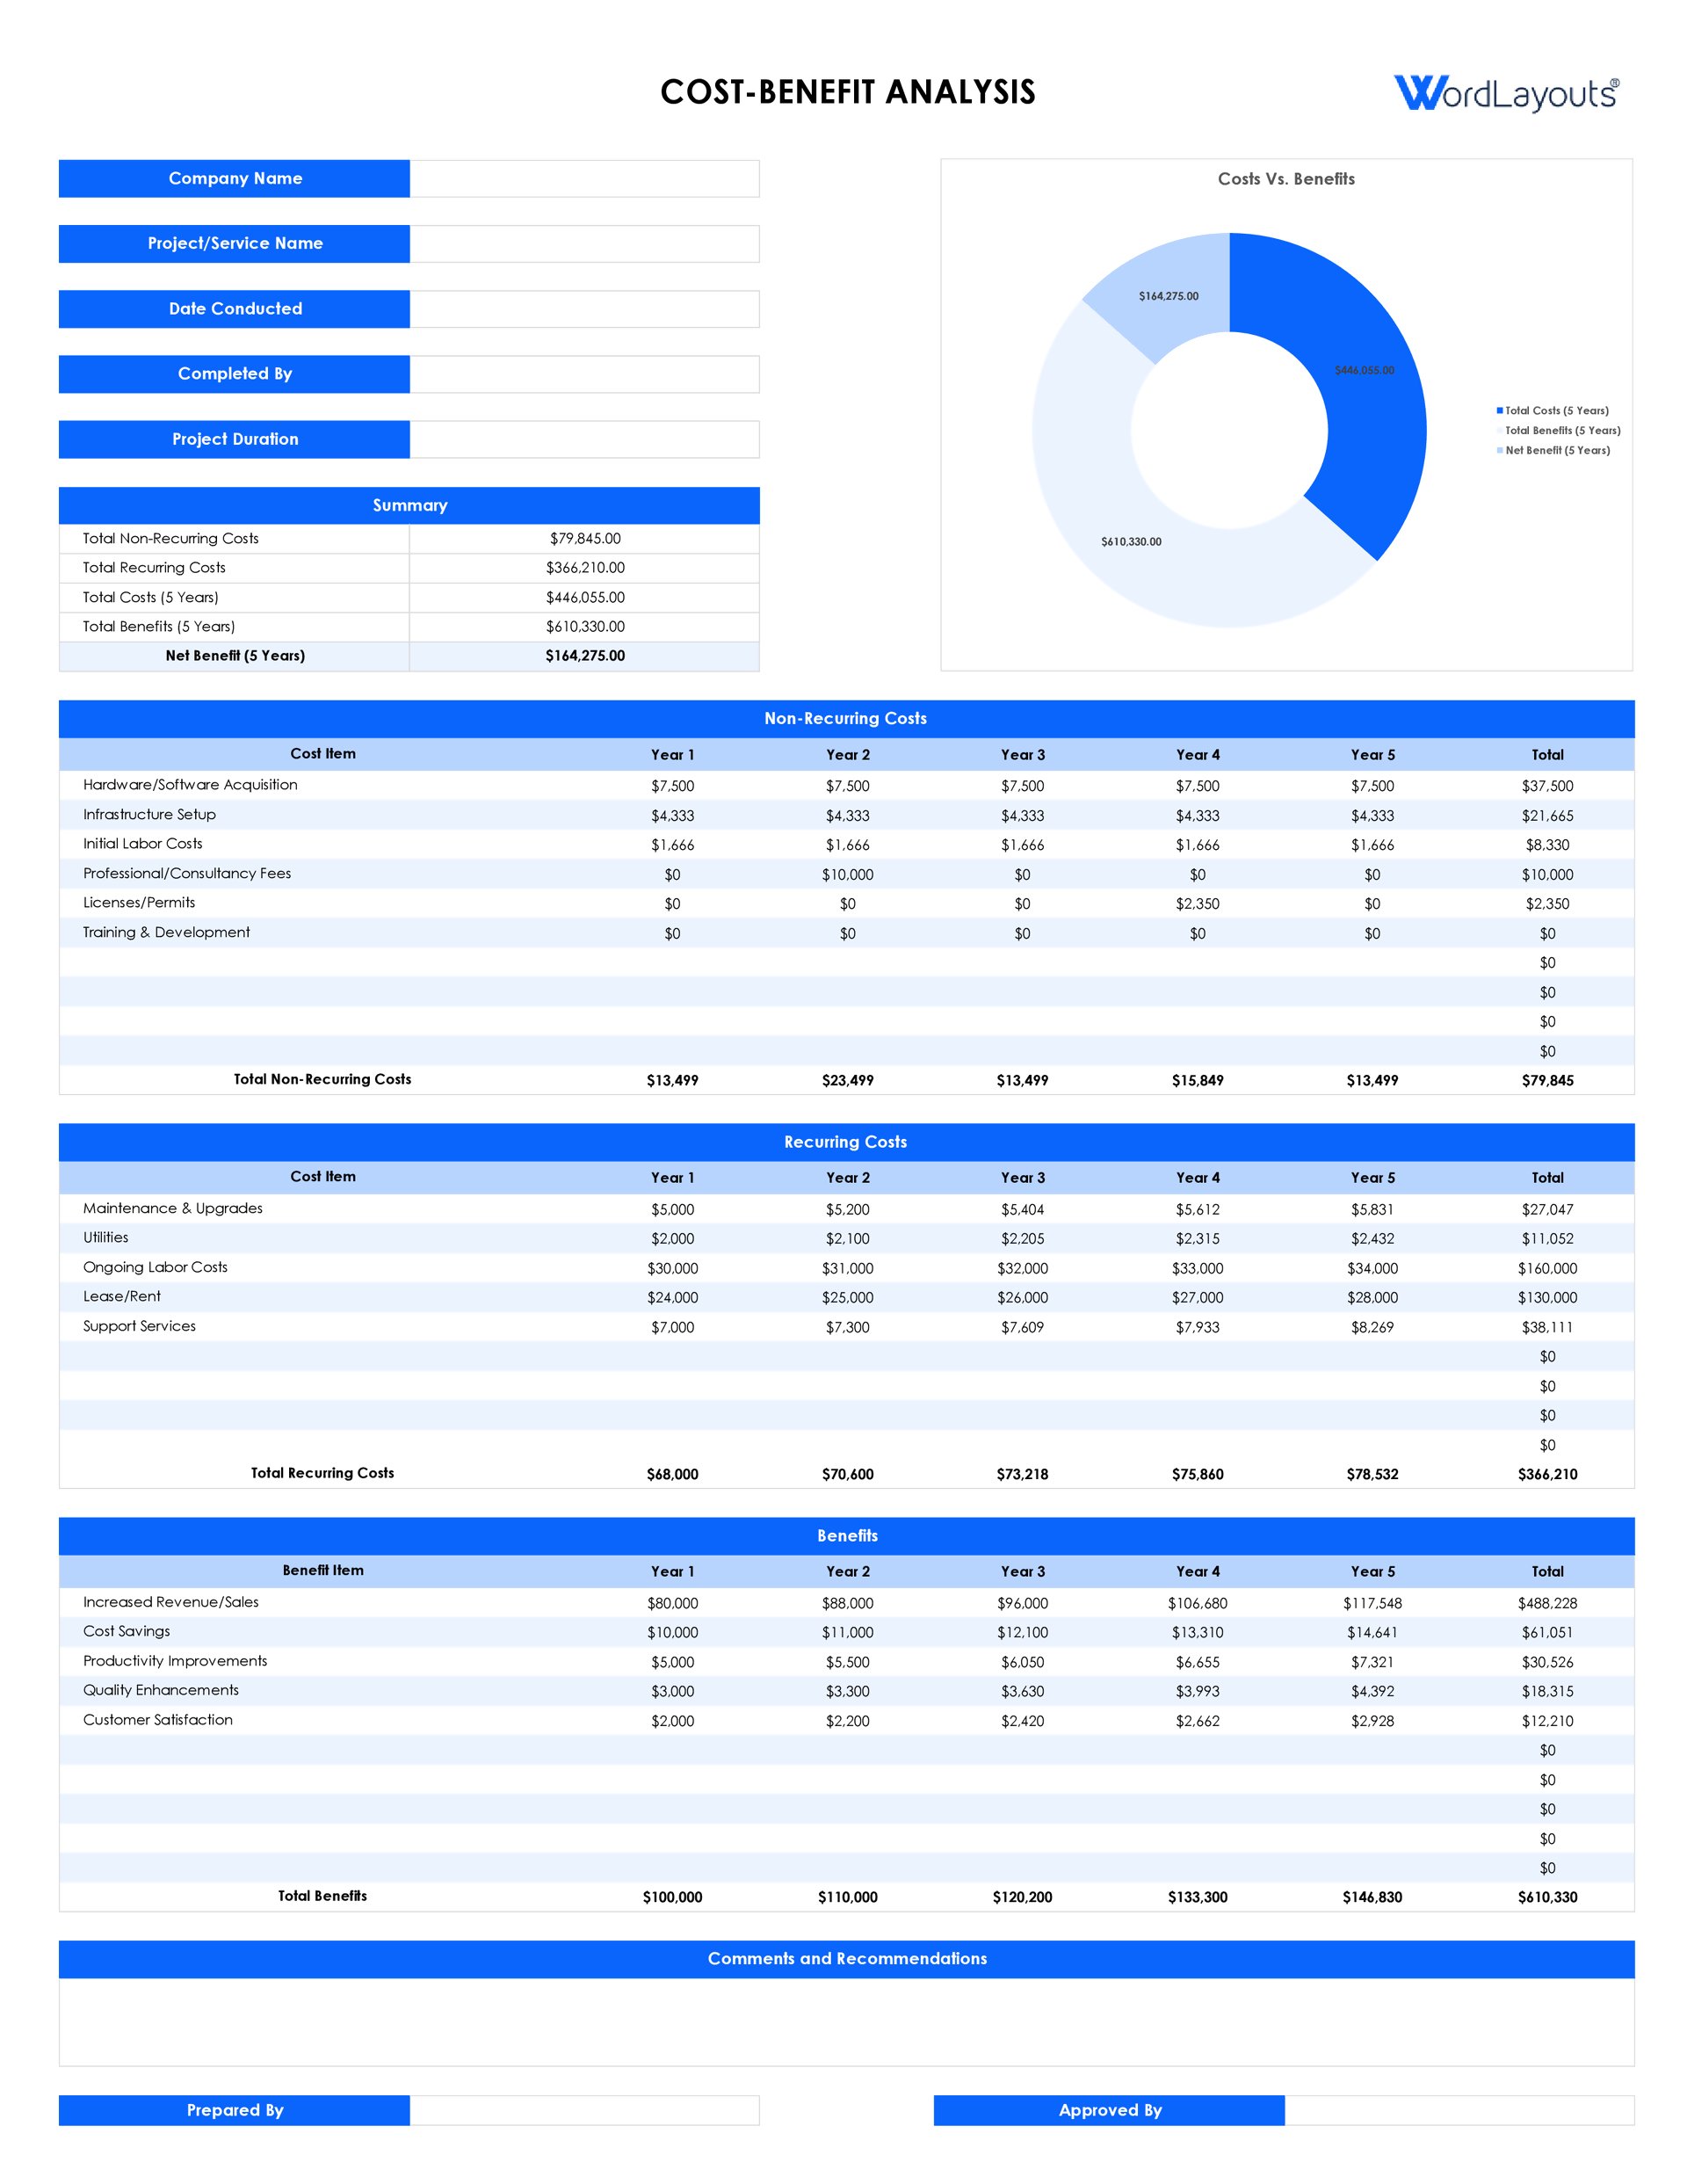
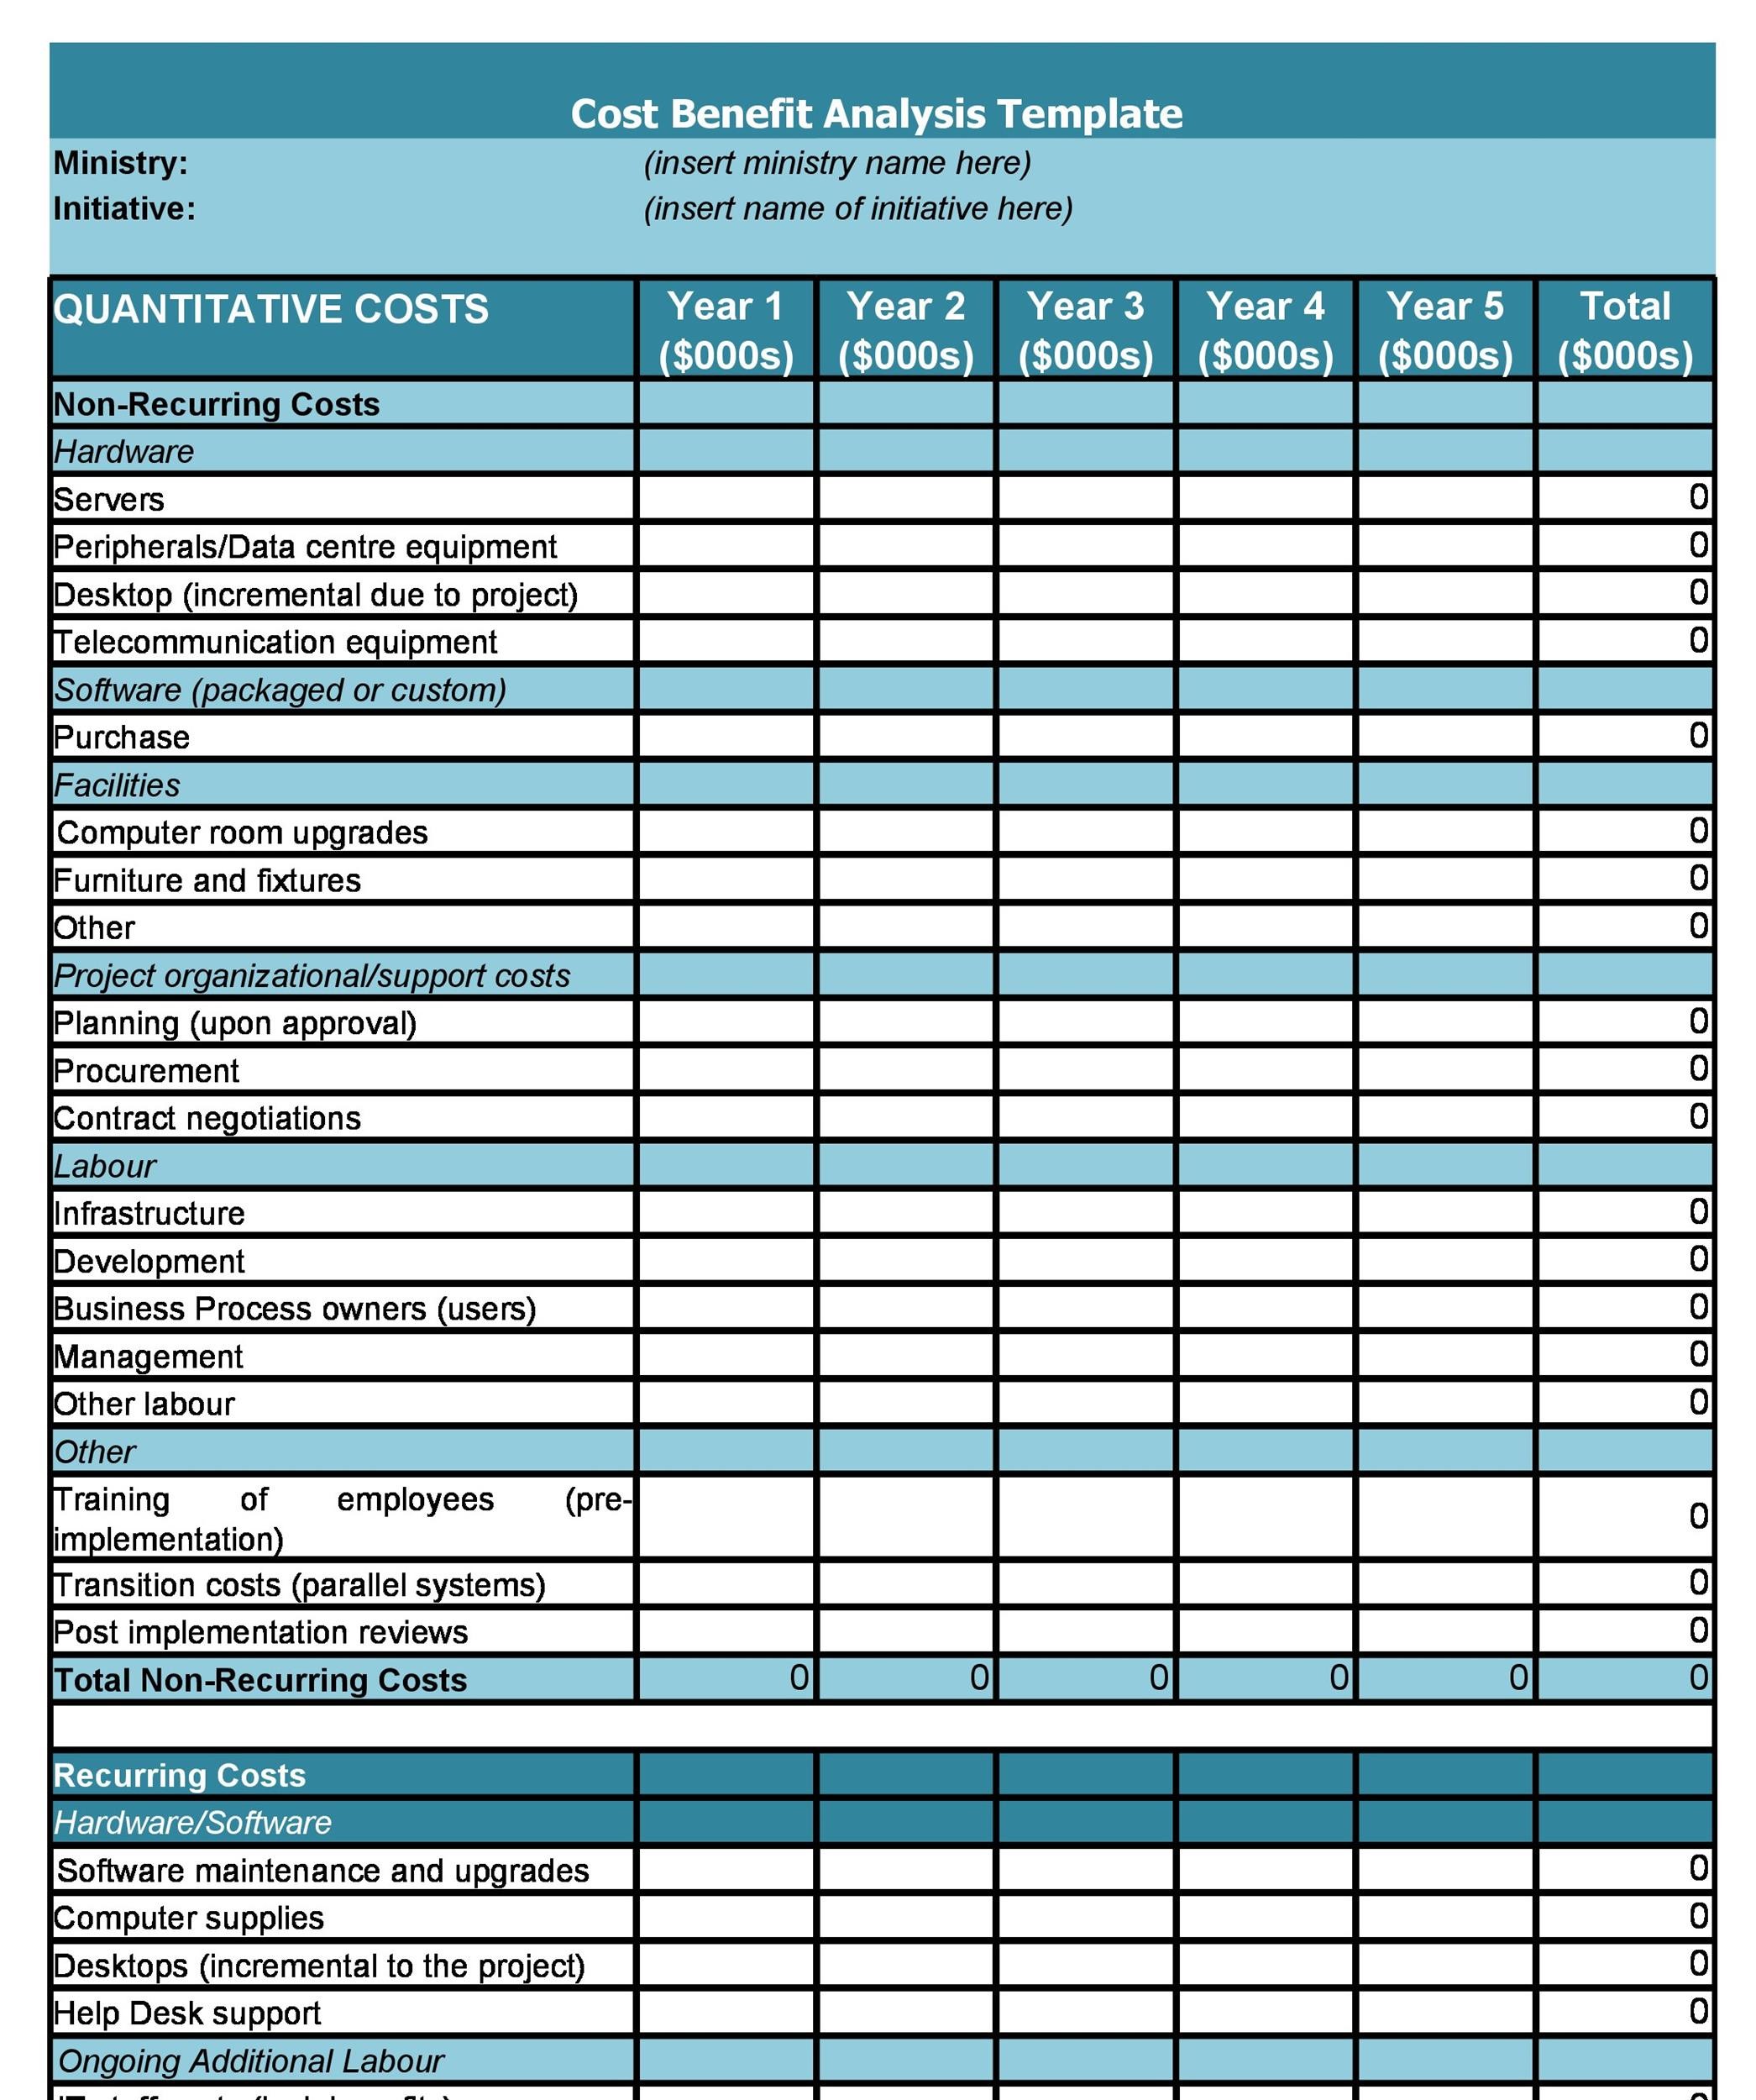
Cost Breakdown
- Capital Expenditures (CapEx): equipment, software licenses, facility upgrades.
- Operating Expenditures (OpEx): staffing, maintenance, utilities, training.
- One‑Time Costs: consulting fees, implementation services.
- Recurring Costs: subscription fees, consumables, ongoing labor.
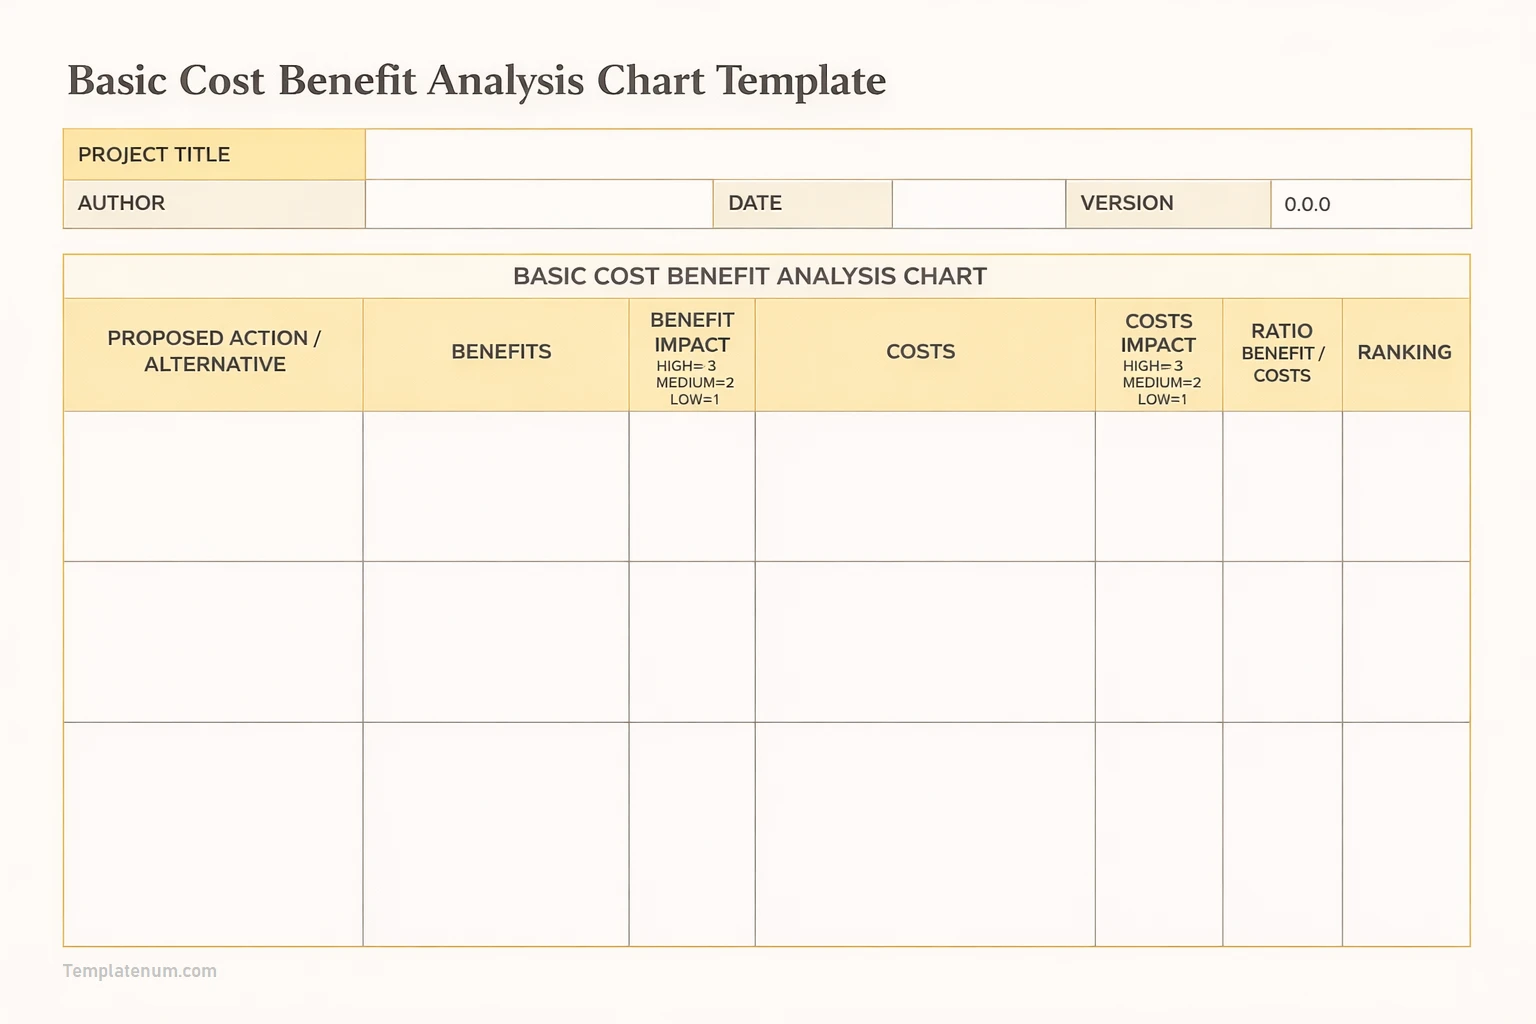
Benefit Identification
- Revenue Increases: new sales, upsell opportunities, pricing power.
- Cost Savings: process automation, waste reduction, energy efficiency.
- Intangible Gains: brand enhancement, regulatory compliance, employee morale (quantified where possible).
Financial Metrics
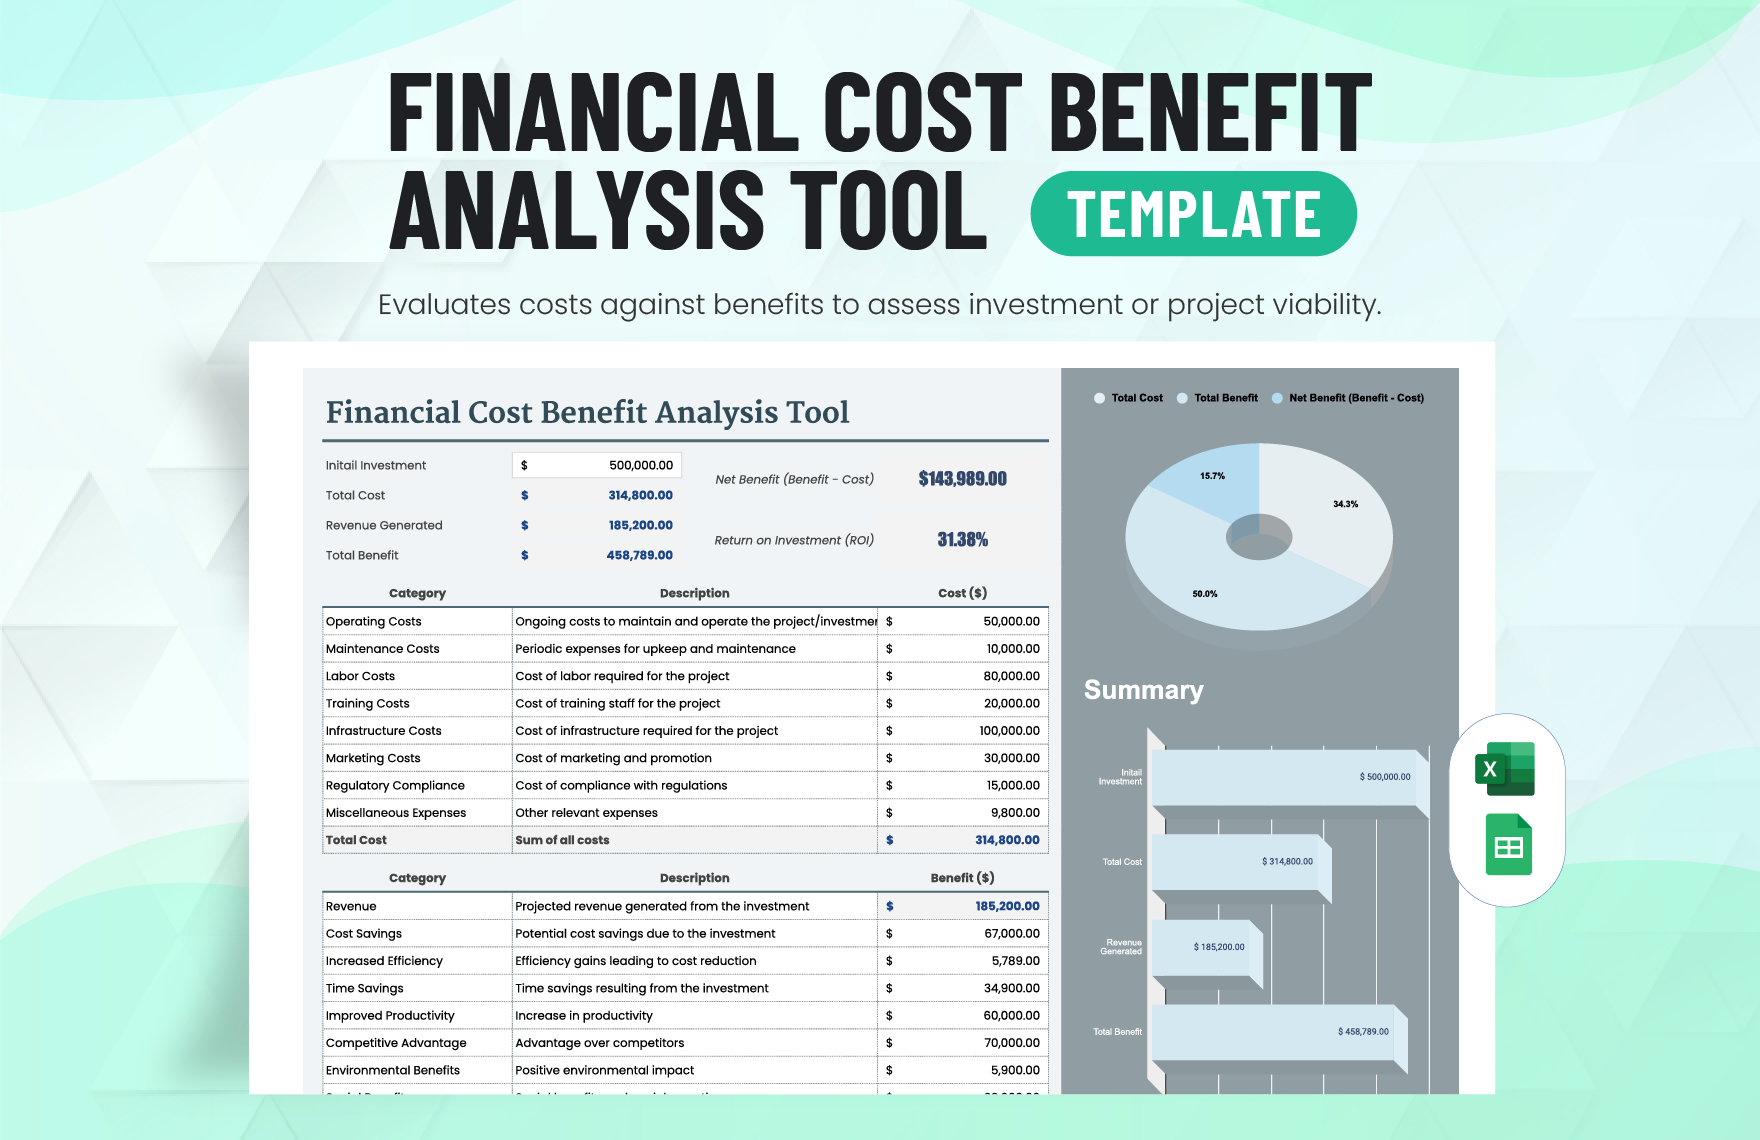
Integrate formulas for total cost, total benefit, net benefit, NPV, IRR, benefit‑cost ratio (BCR), and payback period. These metrics allow quick comparison across projects.
Sensitivity Analysis
Include a data table or scenario manager to test how changes in key variables—like discount rate or cost overruns—affect the outcome. This highlights risk exposure and informs contingency planning.
Building Your Own Template in Excel
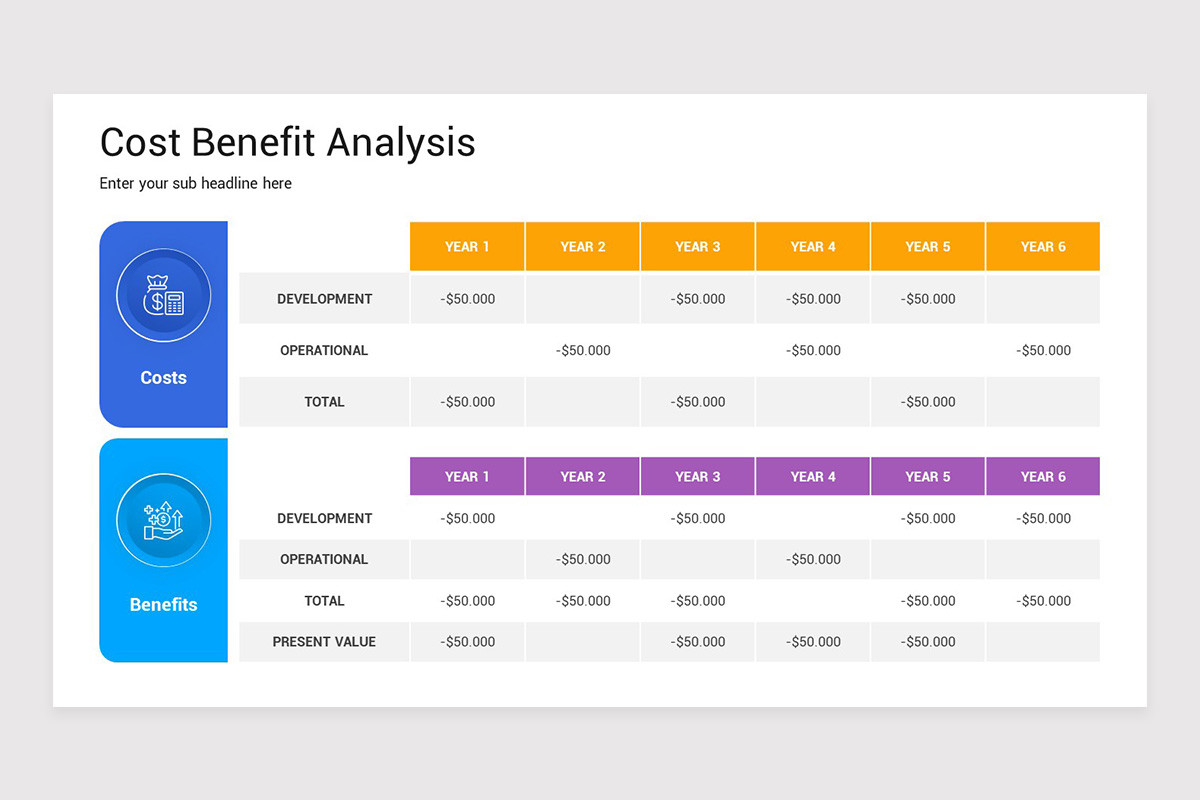
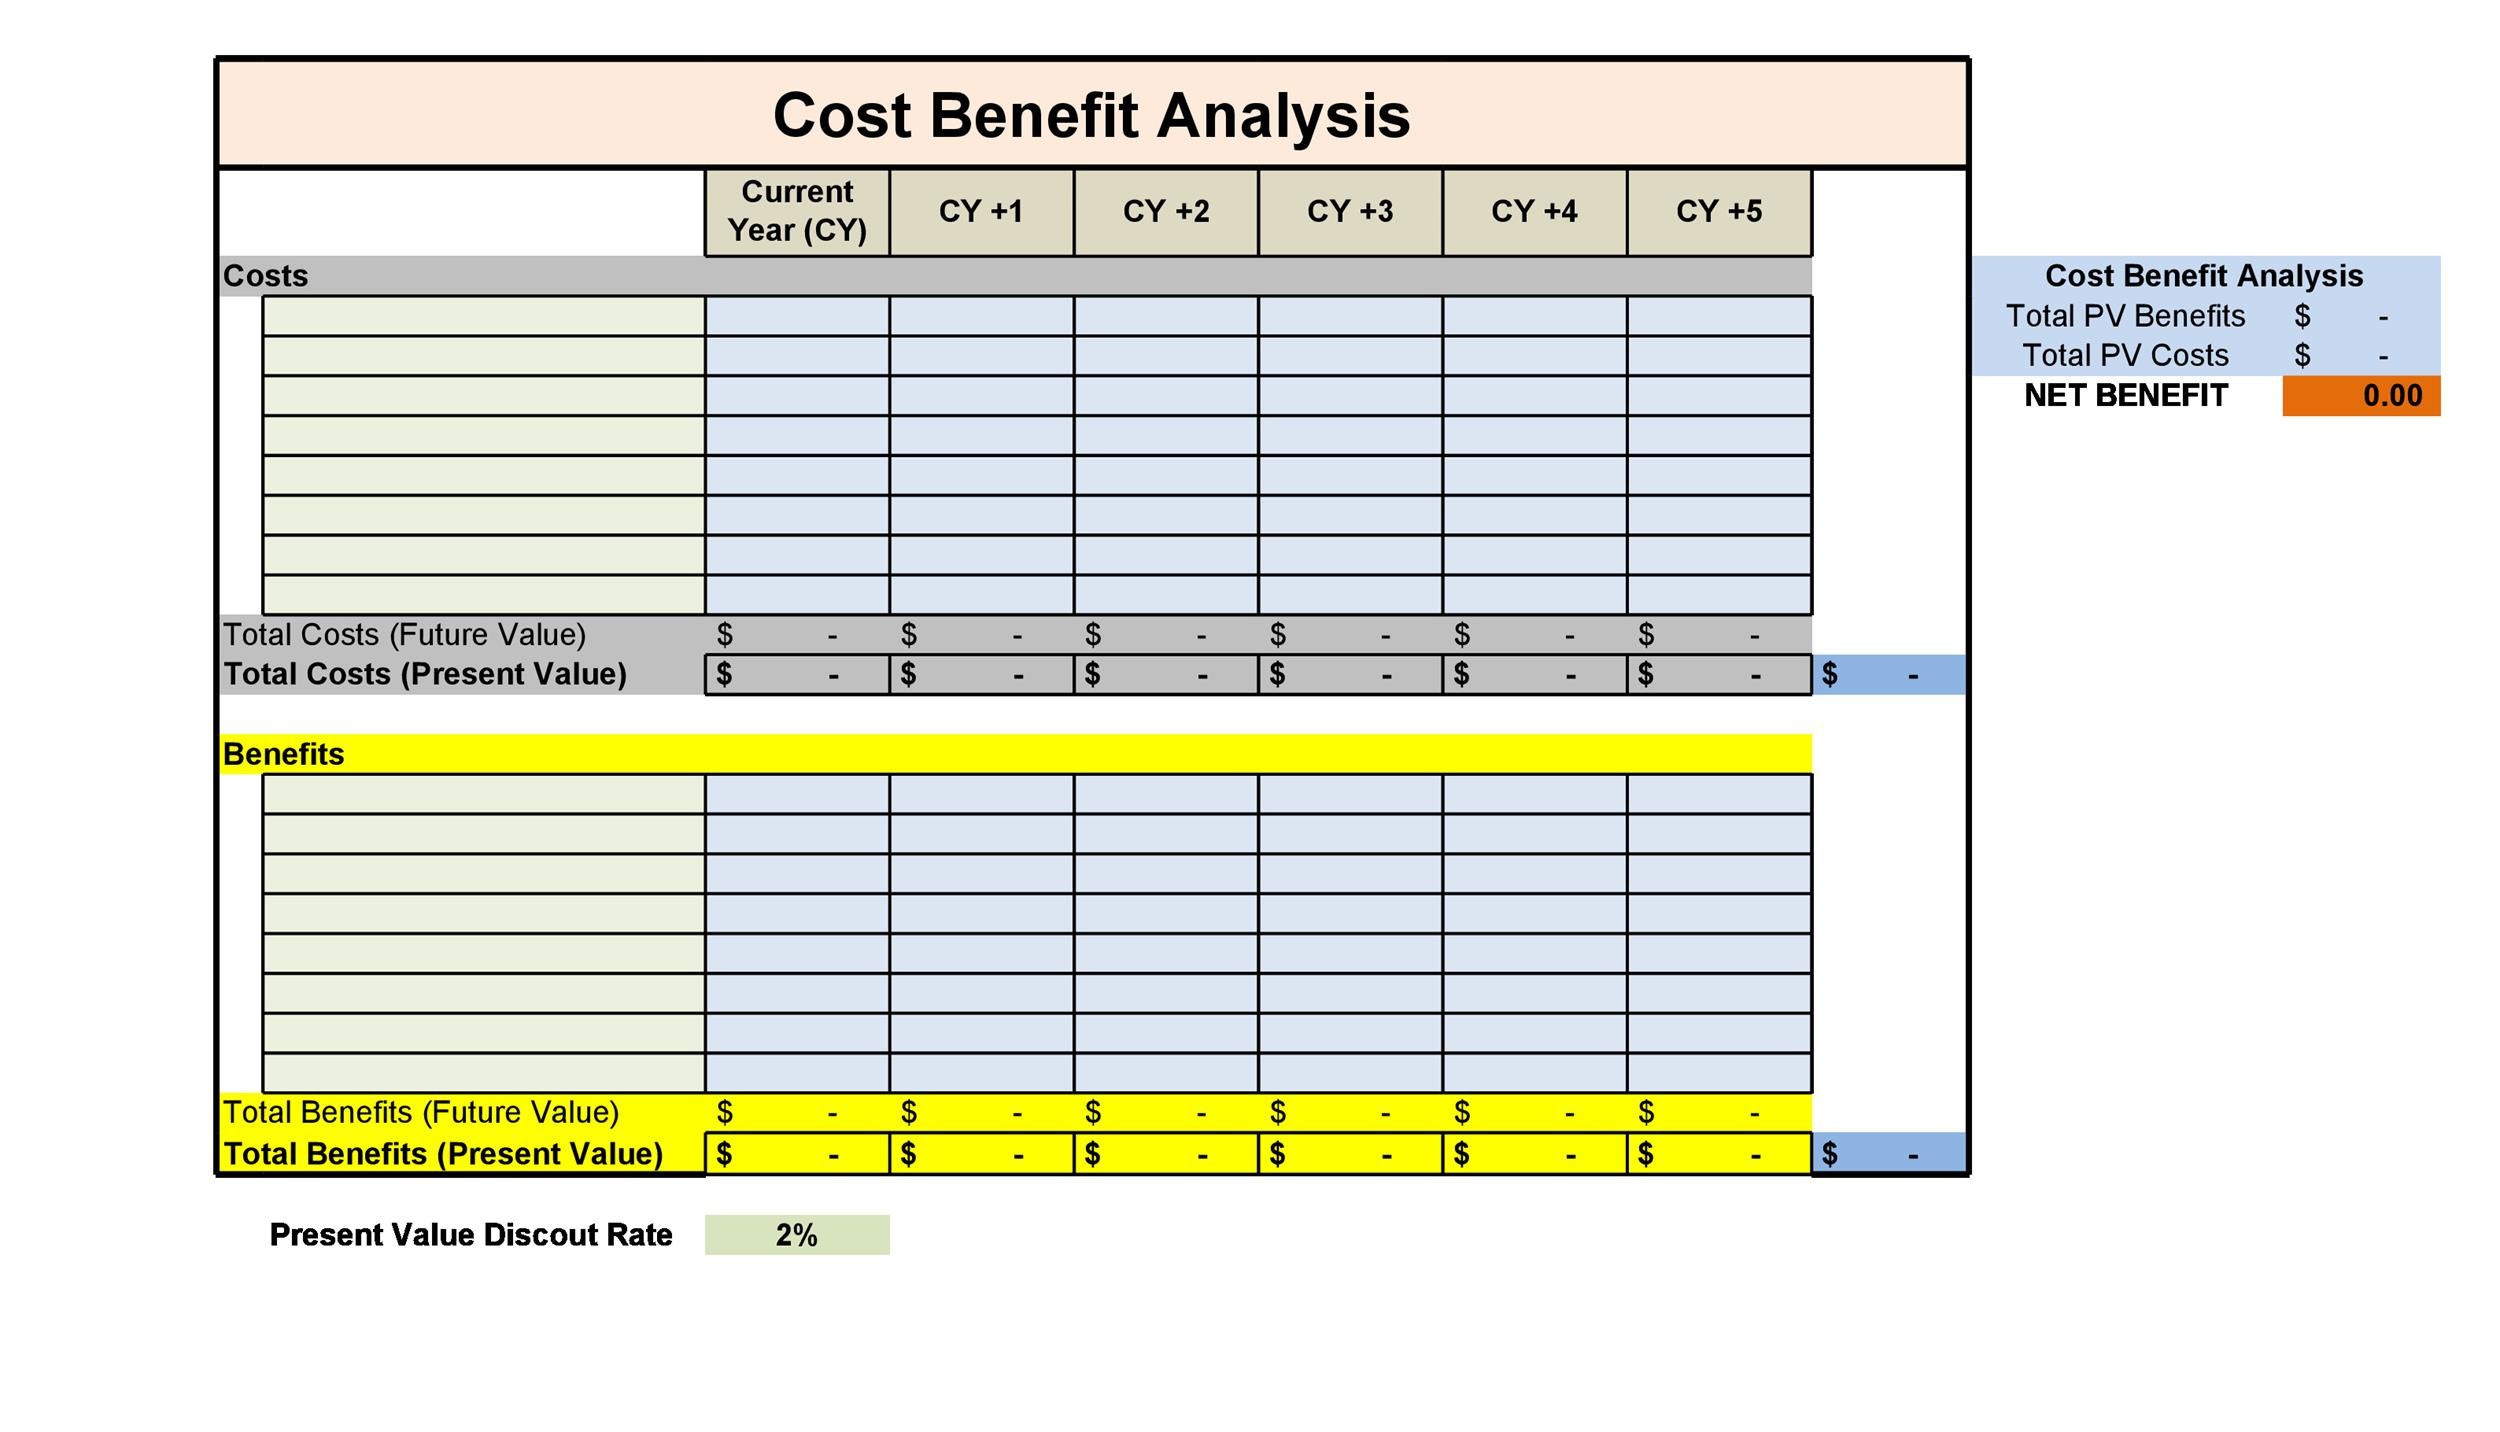
Excel remains the most accessible platform for constructing a cost‑benefit analysis template because of its flexibility, built‑in financial functions, and widespread corporate adoption.
Step 1: Set Up a Clean Workspace
Open a new workbook and create separate worksheets for “Inputs,” “Calculations,” and “Results.” Use clear tab names and protect the “Calculations” sheet to prevent accidental changes to formulas.
Step 2: Define Input Cells
On the “Inputs” sheet, label each input with a descriptive name, then format the cells with a distinct background color (e.g., light yellow) to signal editable fields. Include drop‑down lists for categorical choices such as “Cost Category” or “Benefit Type” using data validation.
Step 3: Build the Cost Matrix
In the “Calculations” sheet, reference the input cells to populate a cost matrix. Use the SUMIF function to aggregate costs by category, and apply the NPV function to discount future cash outflows. Example formula for discounted CapEx over five years:
=NPV($B$2, C3:C7)where $B$2 holds the discount rate and C3:C7 contains yearly capital expenditures.
Step 4: Model Benefits
Mirror the cost structure for benefits. For revenue forecasts, use growth assumptions (e.g., =C3*(1+$B$3) for year‑over‑year increase). Apply the same discounting logic to compute present value of benefits.
Step 5: Compute Key Metrics
Calculate net present value as:
=NPV($B$2, BenefitRange) - NPV($B$2, CostRange)Derive the benefit‑cost ratio with:
=SUM(BenefitRange) / SUM(CostRange)Use conditional formatting to flag projects with BCR below 1.0 in red, and those above 1.5 in green for quick visual cues.
Step 6: Add Sensitivity Tables
Insert a two‑way data table that varies discount rate and cost escalation percentages. This provides a matrix of NPV outcomes, helping executives see best‑case and worst‑case scenarios at a glance.
Step 7: Create a Dashboard
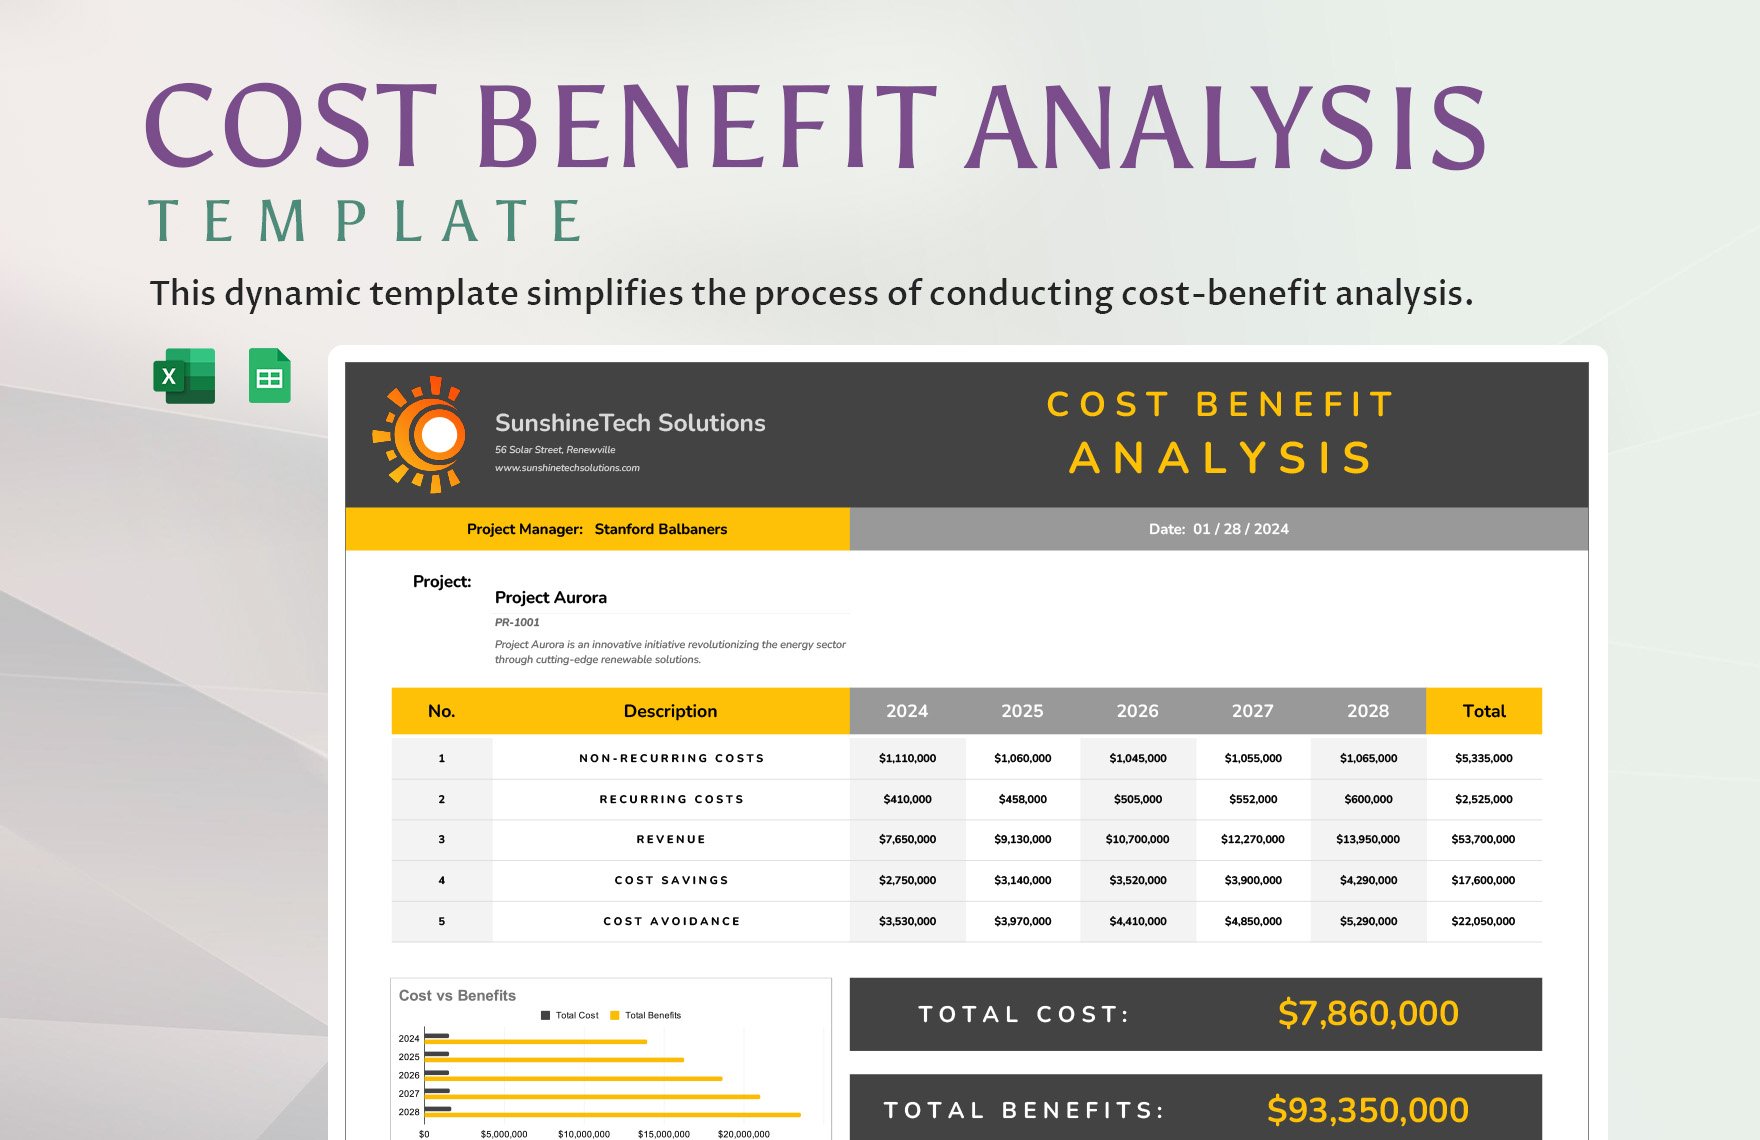
On the “Results” sheet, use charts—such as waterfall charts for cash flow, and gauge charts for IRR—to present a concise visual summary. Include a summary table that lists all key metrics side by side for each scenario.
Real‑World Example: Launching a New Product Line
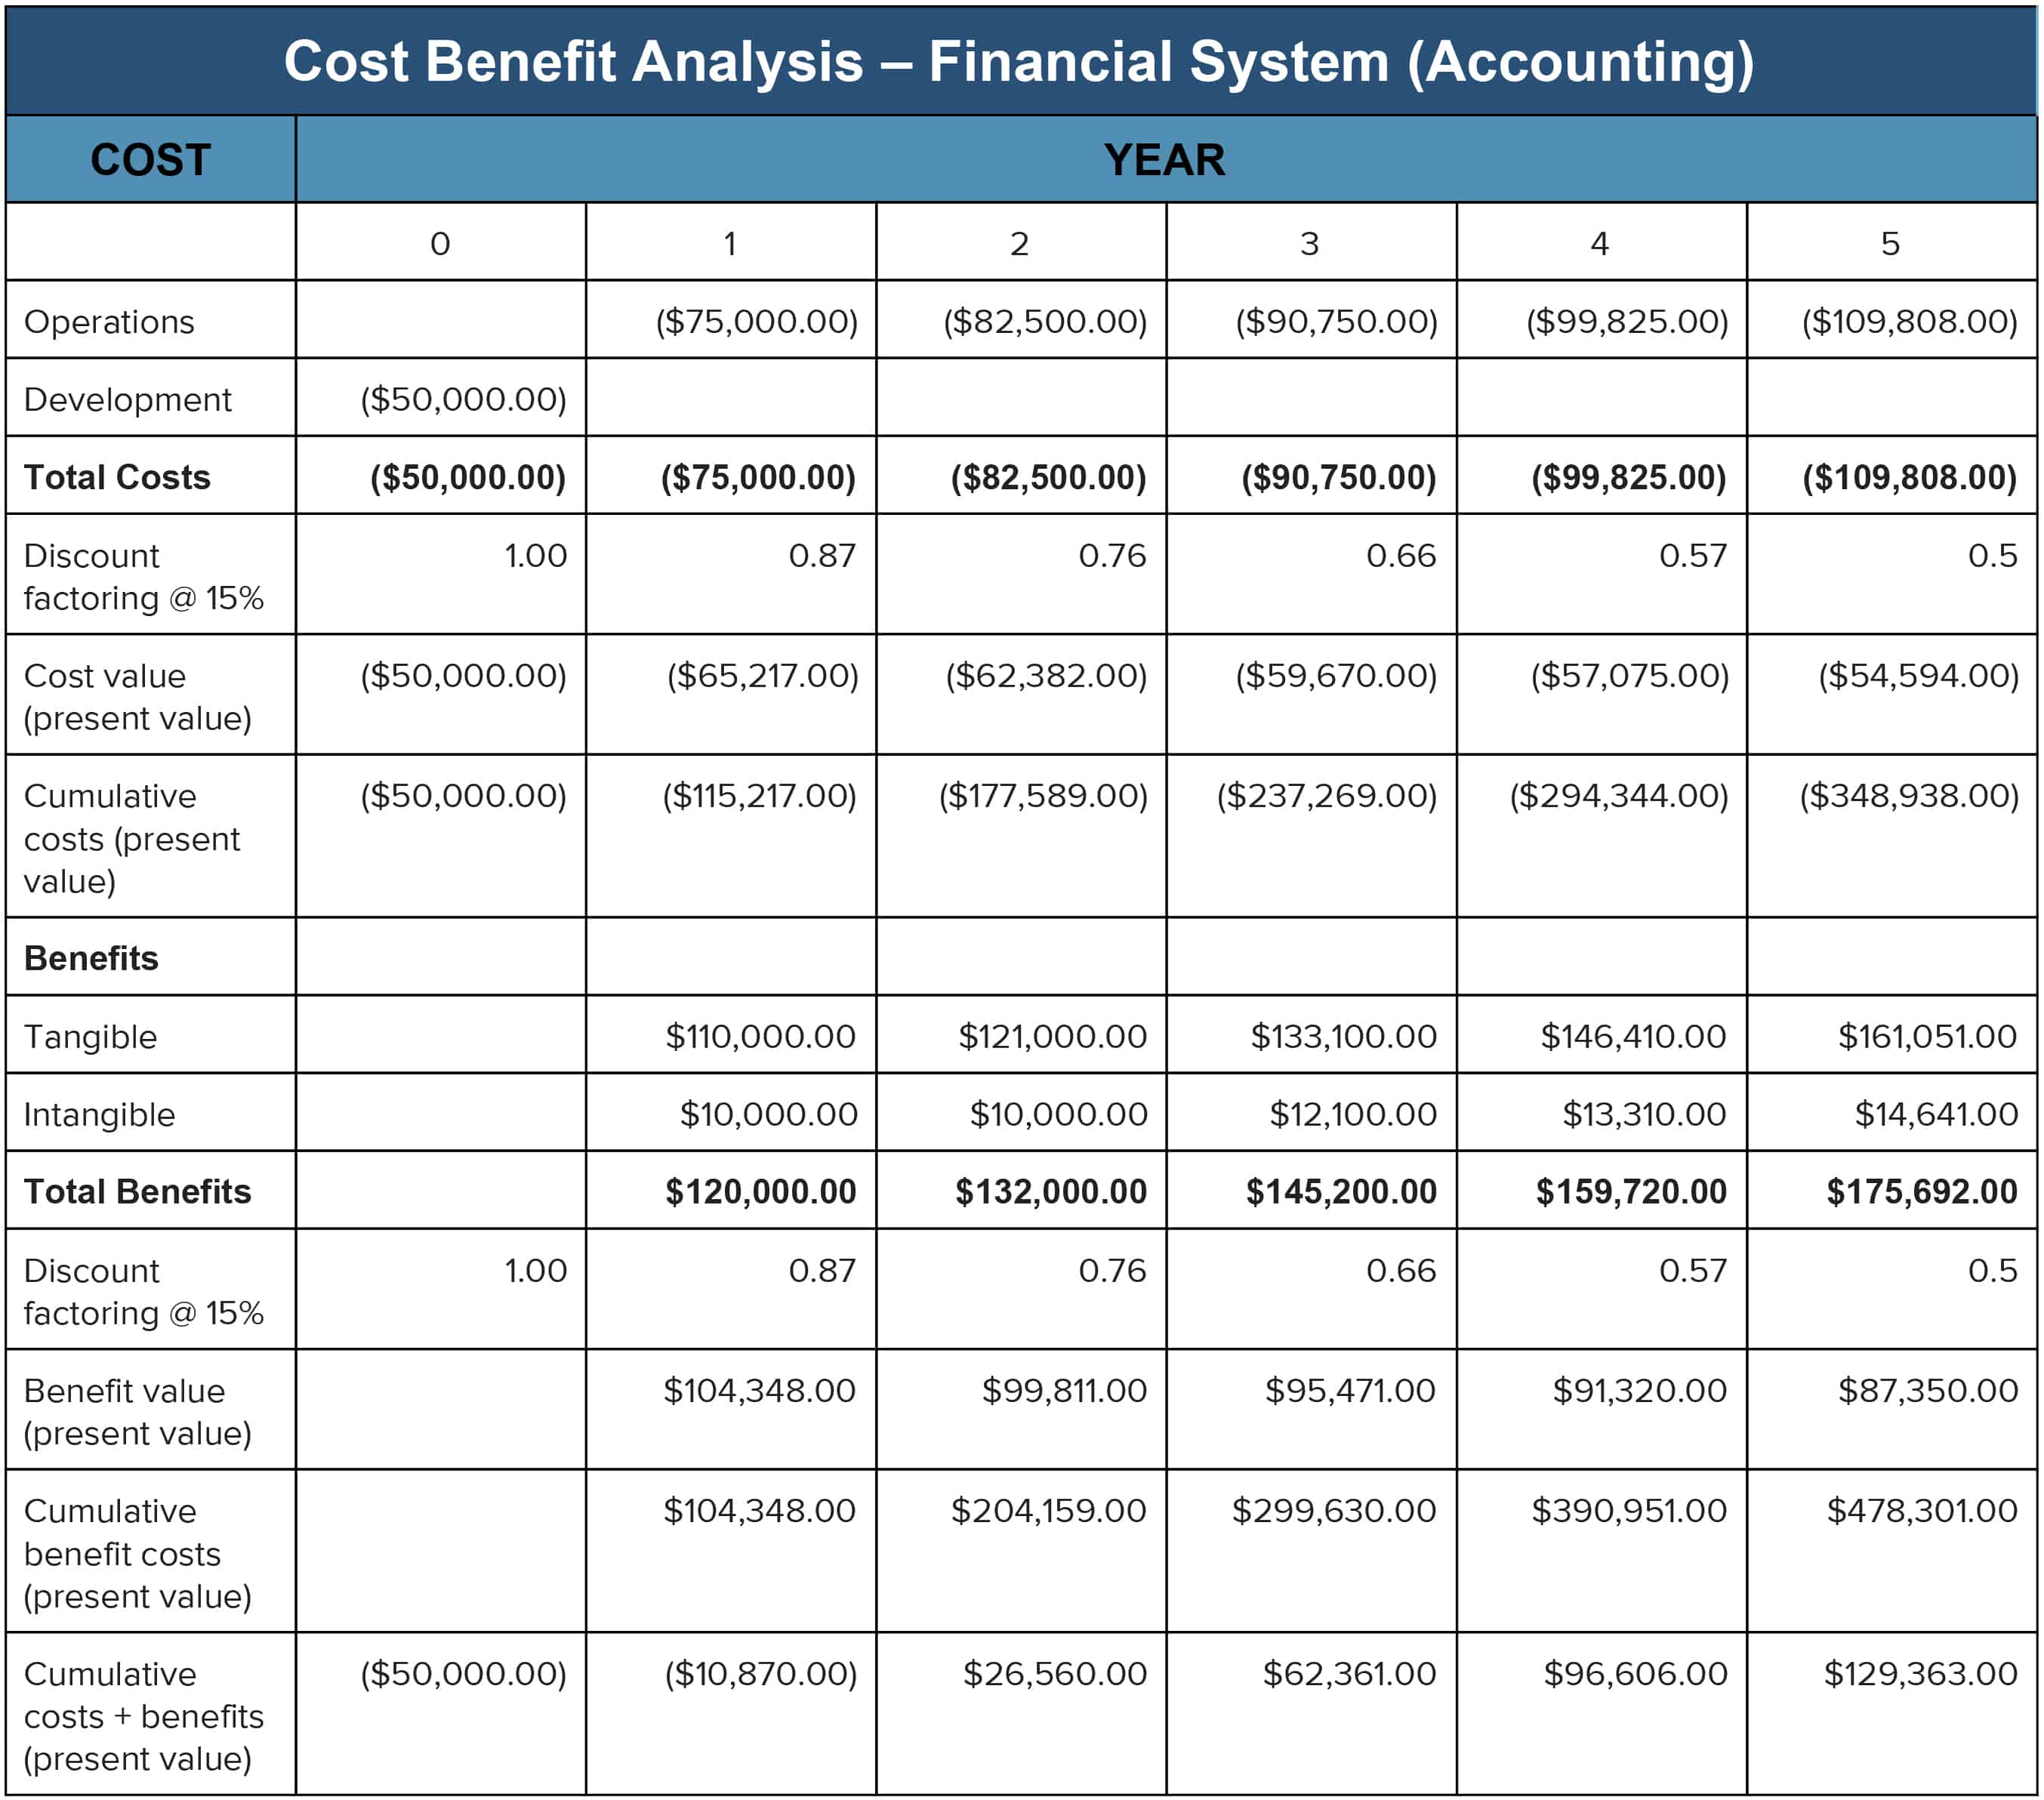
Imagine a mid‑size consumer goods company evaluating a $2 million investment to introduce a premium snack. The following simplified analysis demonstrates how a template streamlines decision‑making.
Assumptions
- Discount rate: 8 %
- Project horizon: 5 years
- Annual sales growth: 12 %
- Production cost per unit: $0.75, increasing 3 % annually
- Projected units sold in year 1: 1 million
Cost Summary
CapEx (equipment & tooling): $1.2 million
OpEx (materials, labor, marketing): $800,000 spread over five years, with a 5 % annual increase.
Benefit Summary
Year 1 revenue: 1 million units × $2.50 = $2.5 million
Revenue grows at 12 % per year, reaching $4.2 million in year 5.
Financial Metrics
Using the template, the analyst calculates:
- NPV of costs: –$1.84 million
- NPV of benefits: $5.13 million
- Net NPV: $3.29 million
- Benefit‑cost ratio: 2.78
- Payback period: 2.3 years
Because the NPV is strongly positive and the BCR exceeds the 2.0 benchmark, the template’s output gives senior leadership a compelling, data‑driven recommendation to proceed.
Common Pitfalls and How to Avoid Them
Even with a sophisticated template, errors can creep in if best practices are ignored.
Over‑Optimistic Assumptions
Inflated revenue forecasts or underestimated costs create a false sense of profitability. Mitigate this by benchmarking against industry averages and incorporating conservative “stress‑test” scenarios.
Ignoring Time Value of Money
Failing to discount future cash flows can dramatically overstate benefits. Always apply the appropriate discount rate that reflects the company’s weighted average cost of capital (WACC) or project‑specific risk.
Double‑Counting Benefits
Benefits that overlap—such as cost savings from automation that also boost revenue—must be allocated once. Use clear definitions and a benefit‑mapping worksheet to track each source.
Inadequate Documentation
Stakeholders need to understand the logic behind each input. Include comment boxes or a separate “Notes” column that explains the source of every assumption.
Static Templates
A template that isn’t updated for inflation, tax law changes, or new accounting standards quickly becomes obsolete. Schedule quarterly reviews and embed dynamic links to corporate finance data feeds where possible.
Tips for Ongoing Maintenance and Collaboration
Keeping the template relevant and user‑friendly requires disciplined processes.
Version Control
Save each major revision with a date stamp (e.g., CBA_Template_2024_09.xlsx) and maintain a change‑log that records who made updates and why.
User Permissions
Lock formula cells, but allow designated analysts to edit only the input fields. This prevents accidental overwriting while still enabling flexibility.
Training and Knowledge Sharing
Host short workshops that walk new team members through the template’s structure, highlighting where to find assumptions, how to run sensitivity analyses, and how to interpret the dashboard.
Integration with Business Intelligence Tools
Export the results to Power BI or Tableau for enterprise‑wide reporting. Linking the Excel file to a shared data lake ensures that the latest financial data populates the analysis automatically.
Frequently Asked Questions
Can I use a cost‑benefit analysis template for non‑financial projects?
Yes. While the core calculations rely on monetary values, you can assign dollar equivalents to intangible outcomes (e.g., reduced risk) using techniques such as contingent valuation or willingness‑to‑pay surveys.
What discount rate should I apply?
The discount rate should reflect the project’s risk profile. For low‑risk internal projects, use the company’s WACC. For high‑risk ventures, add a risk premium—typically 3‑5 %—to the base rate.
How often should the template be refreshed?
At a minimum, review and update assumptions annually. For fast‑moving industries, a quarterly refresh is advisable, especially for variables like commodity prices or exchange rates.
Is Excel sufficient for large‑scale analyses?
Excel handles most mid‑size projects well, but for enterprise‑level portfolio analysis, consider dedicated financial modeling platforms that offer multi‑user collaboration, audit trails, and advanced scenario management.
Conclusion
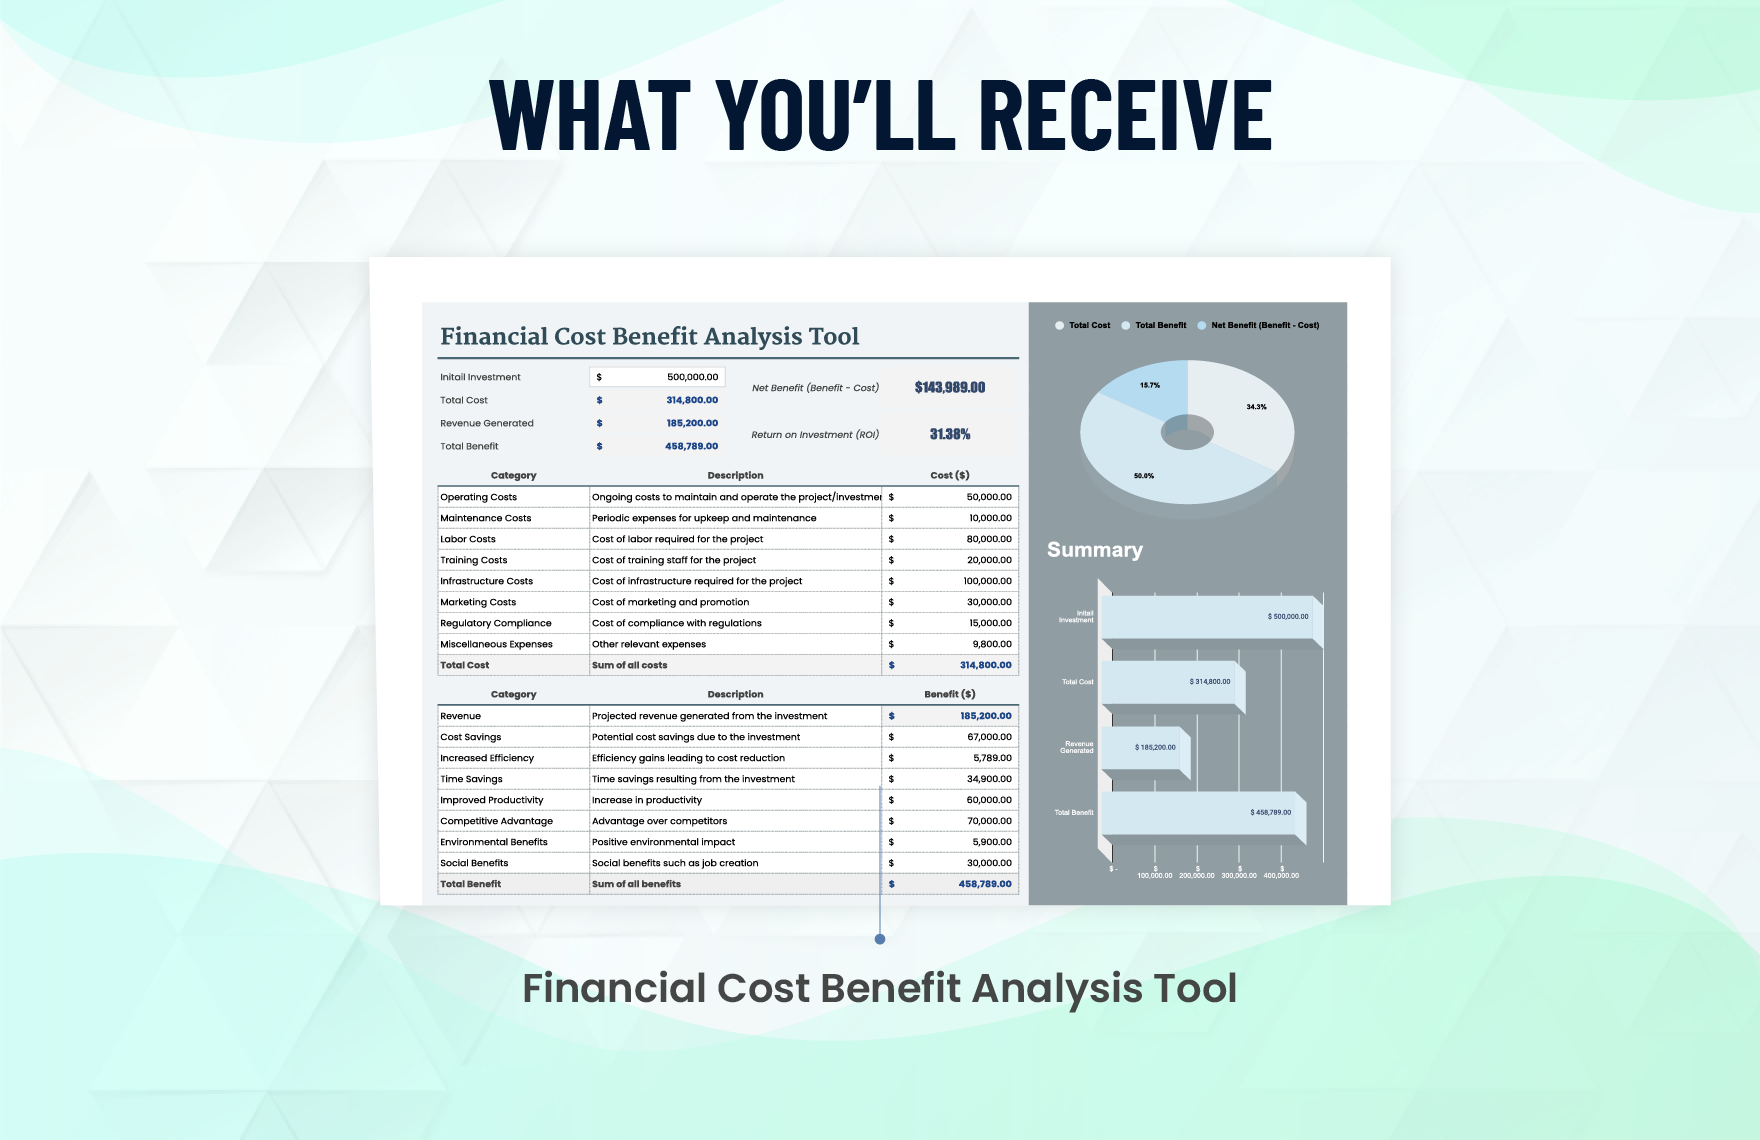
A Financial Cost Benefit Analysis Template is more than a spreadsheet—it is a strategic framework that transforms raw data into actionable insight, aligns investments with corporate objectives, and safeguards resources against uncertainty. By mastering the essential components, building a disciplined Excel model, and embedding best‑practice maintenance routines, finance professionals can deliver clear, defensible recommendations that drive sustainable growth. Whether evaluating a new product launch, a technology upgrade, or a cost‑reduction initiative, the template ensures every dollar is accounted for, every risk is quantified, and every decision is rooted in rigorous financial logic.


Related posts of "Financial Cost Benefit Analysis Template"
