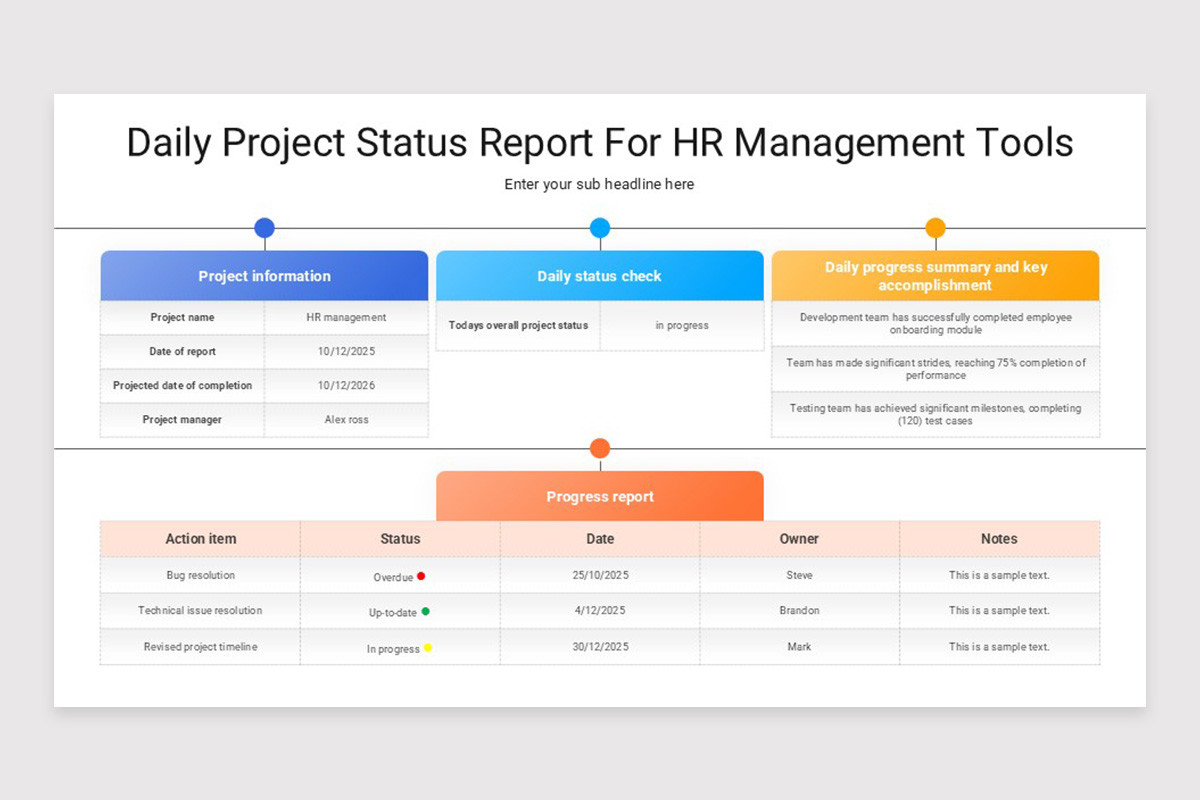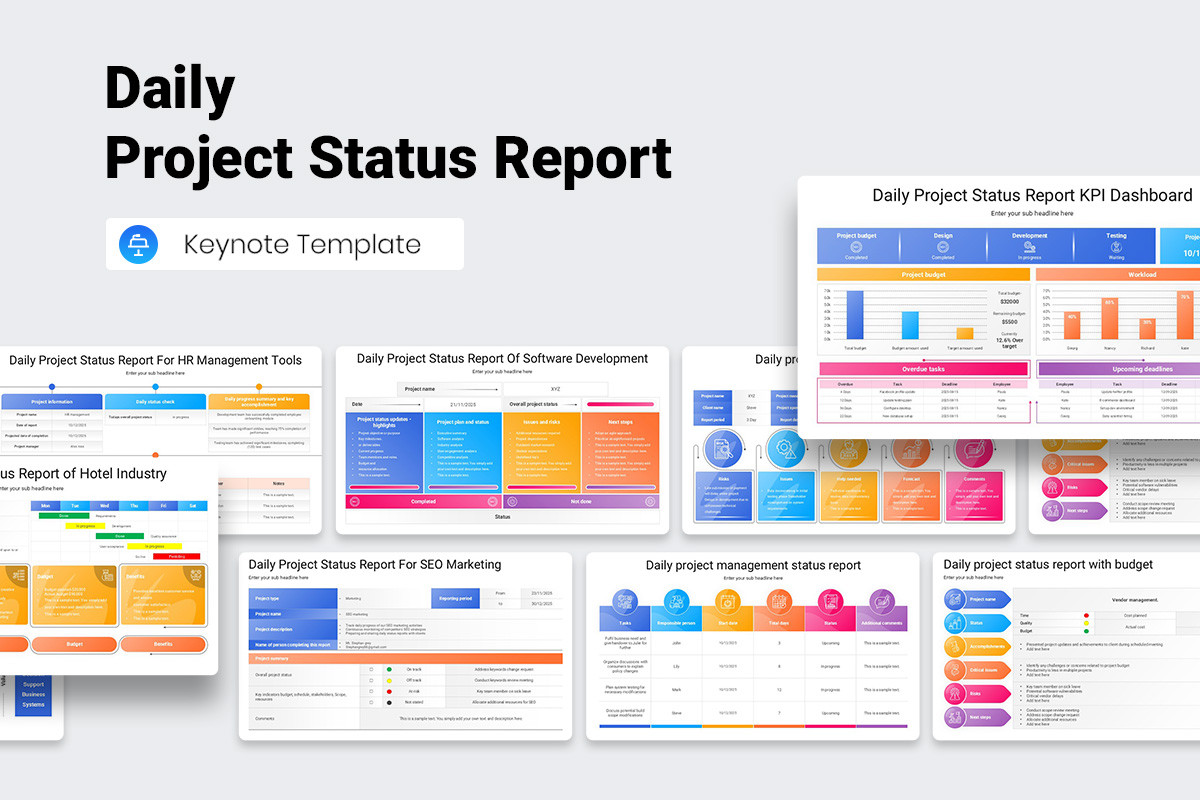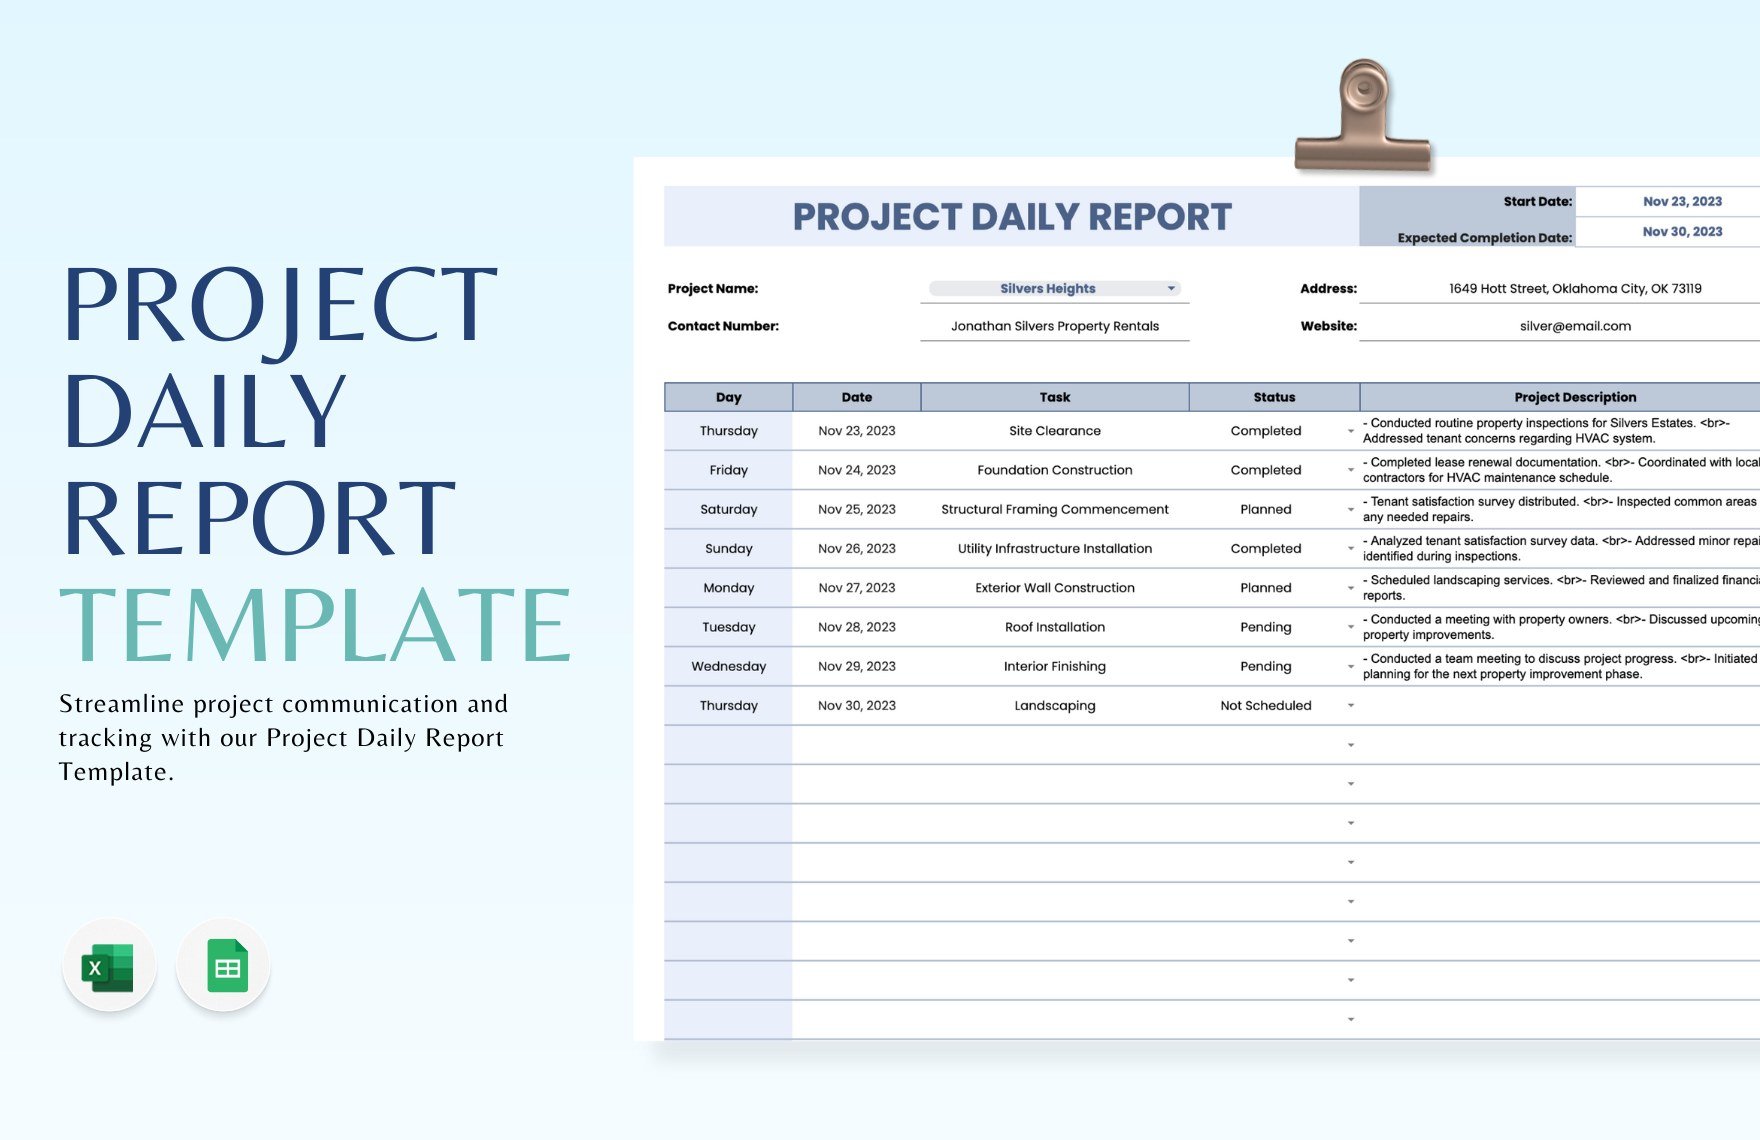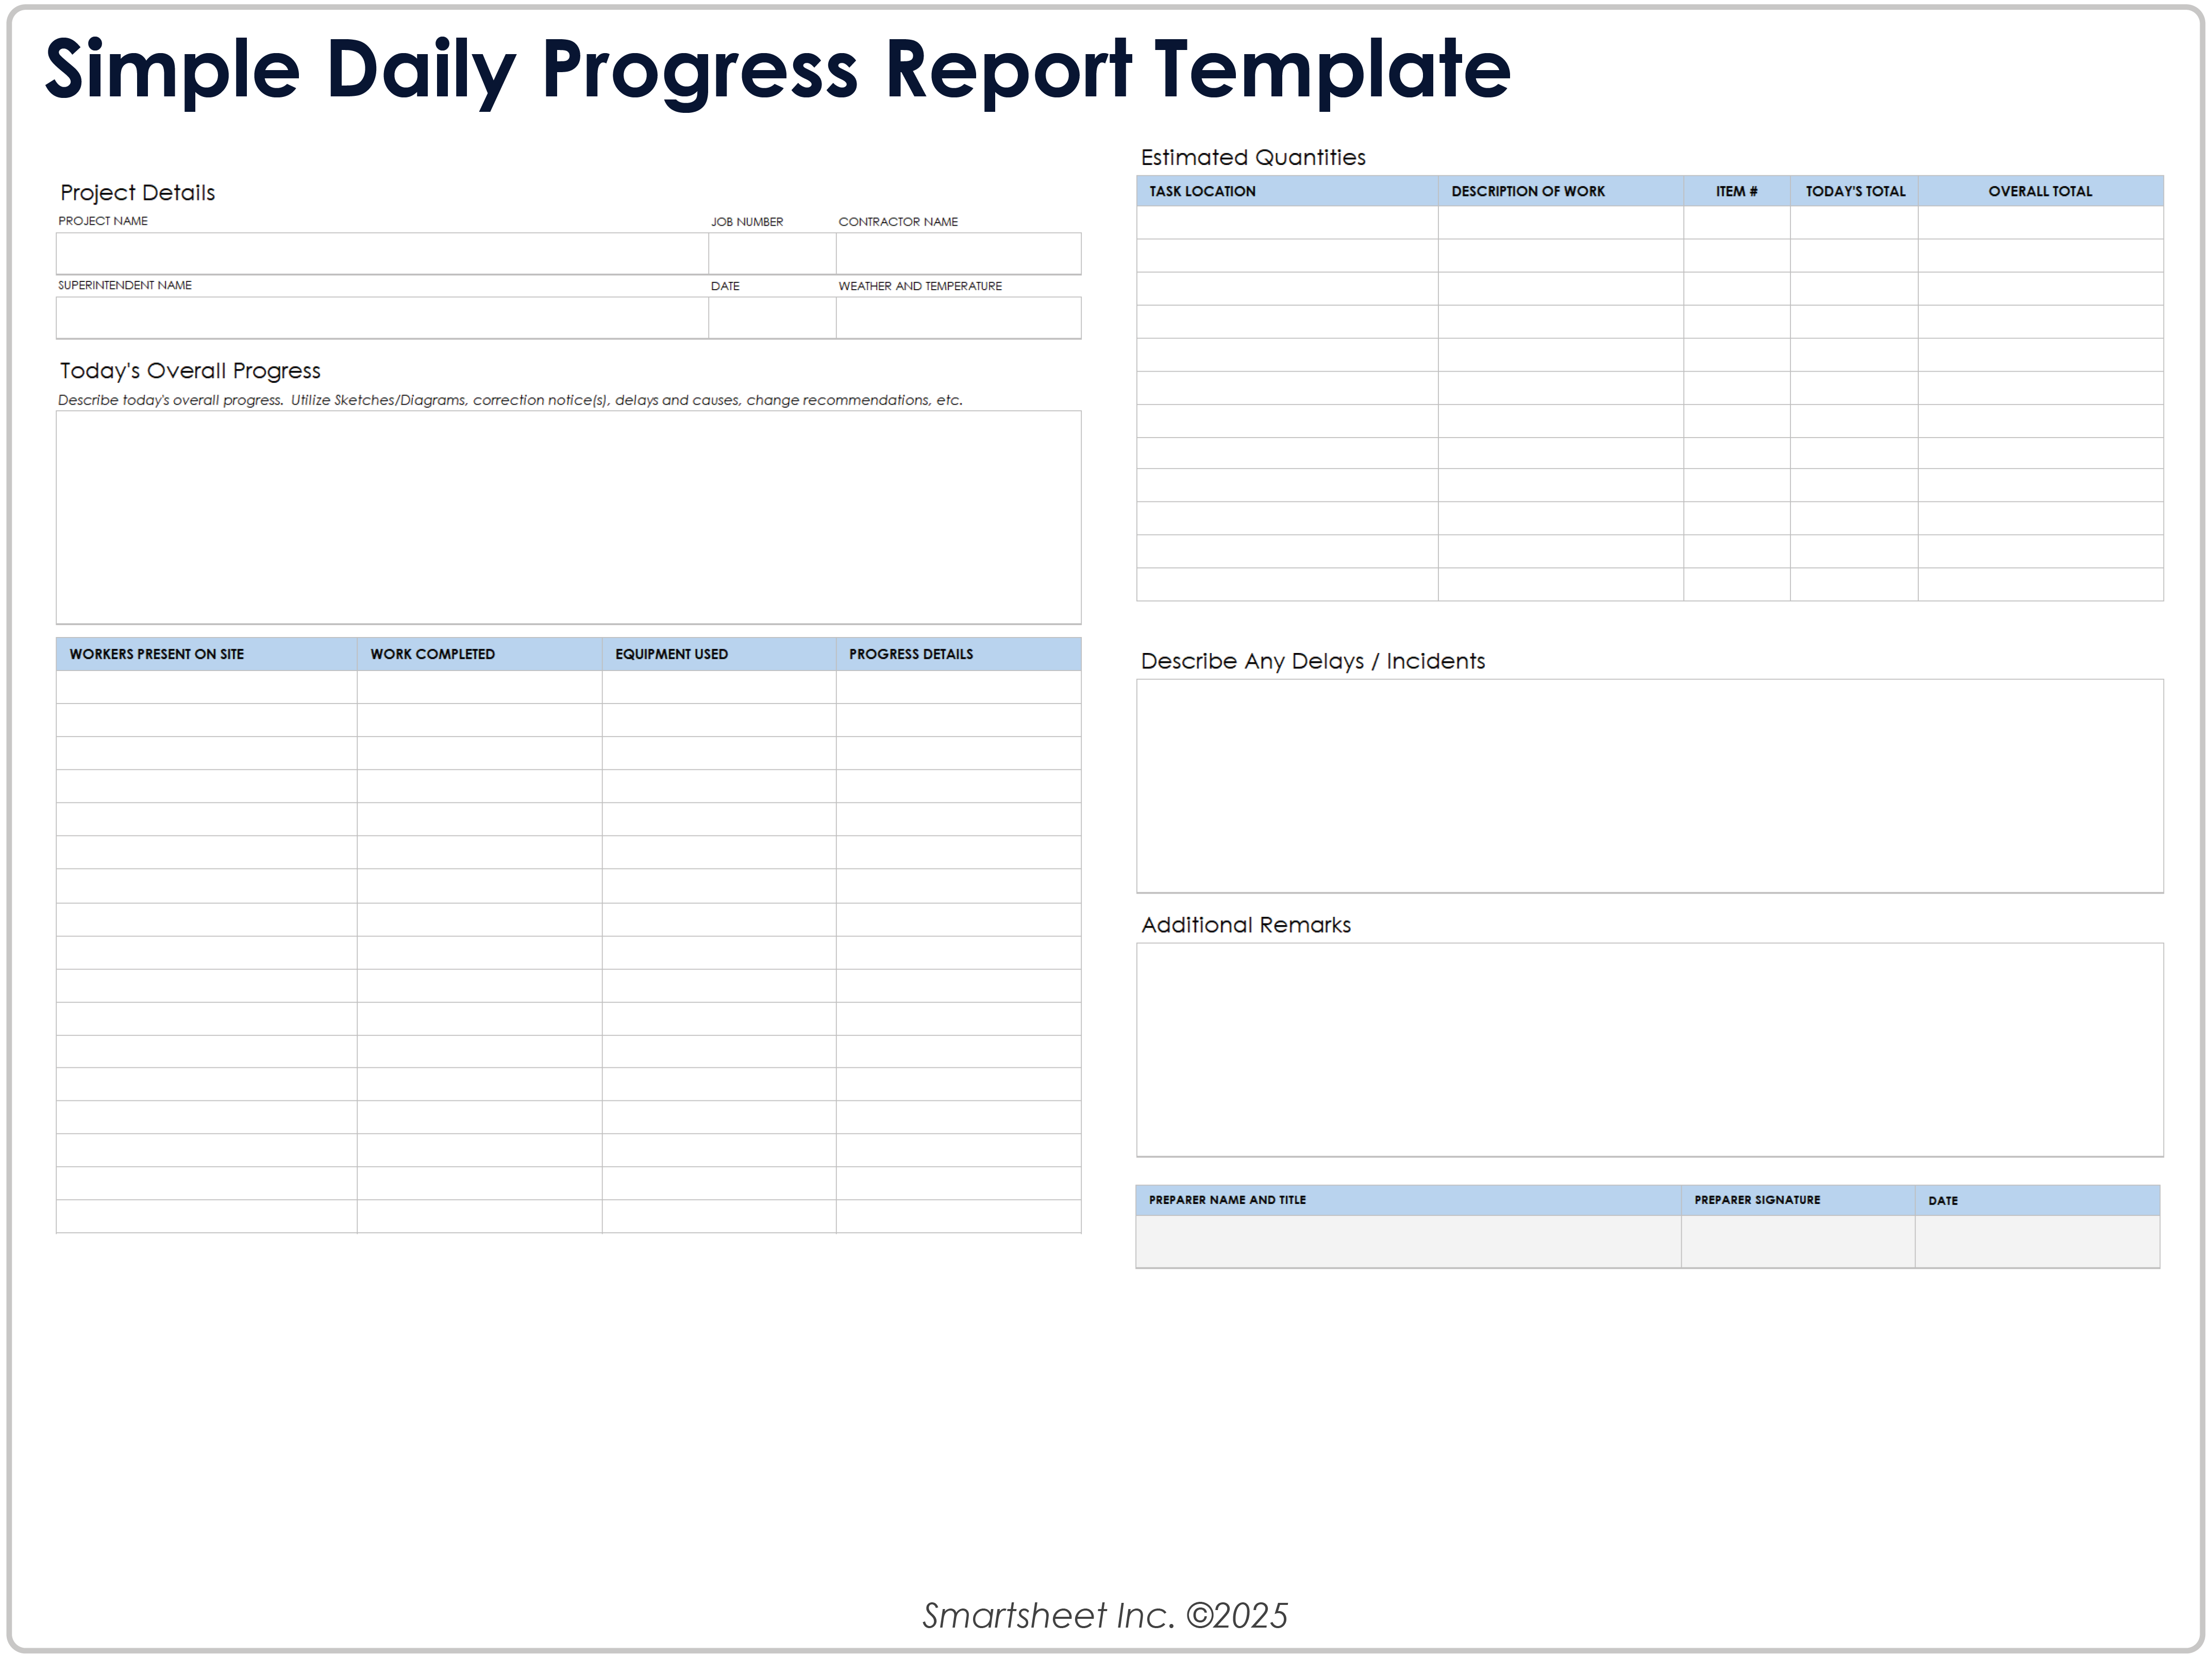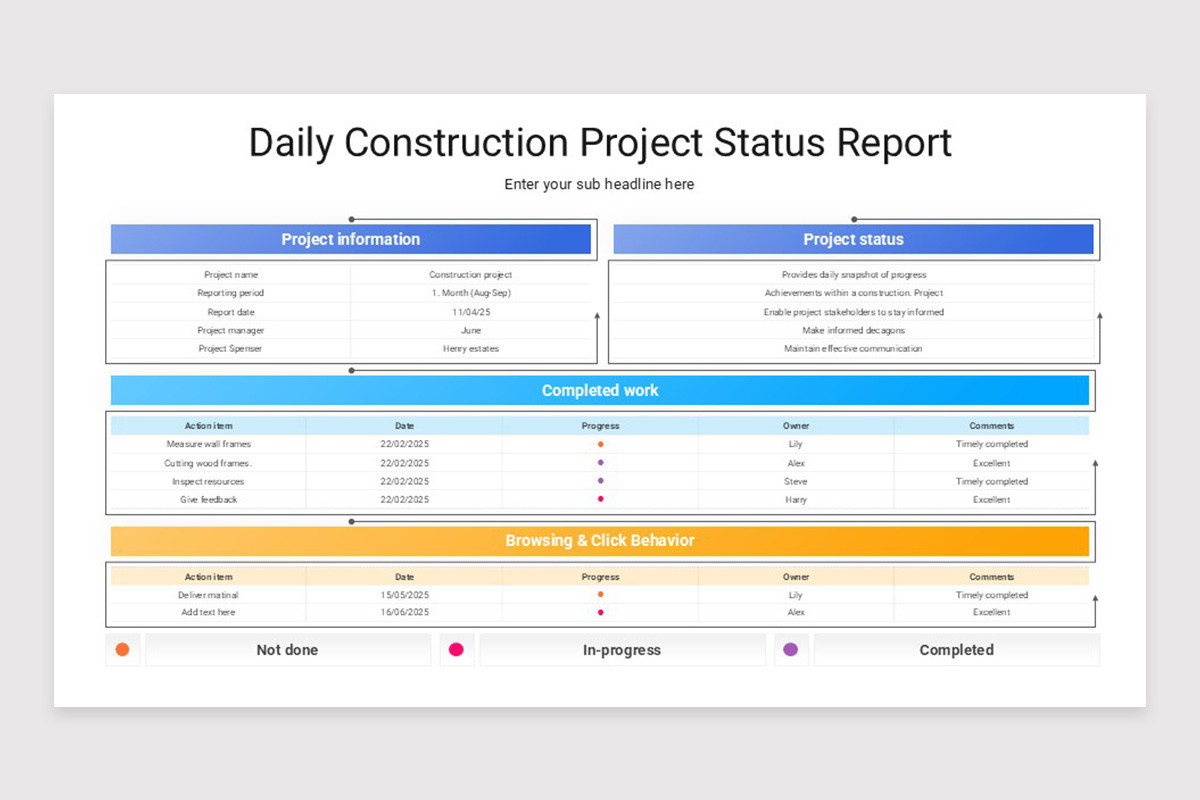
Daily Project Status Report Template is the cornerstone of transparent communication, enabling project managers and stakeholders to stay aligned, identify risks early, and keep momentum moving forward; this article delves into the essential elements, practical design tips, and actionable strategies to create a report that drives results day after day.
Why a Daily Project Status Report Matters

In fast‑paced environments, a single day can bring significant changes—new blockers, shifting priorities, or unexpected wins. Without a concise daily snapshot, teams risk miscommunication, duplicated effort, and delayed decision‑making. A well‑crafted report serves three core purposes:
- Visibility: Everyone from developers to executives sees the current state, eliminating blind spots.
- Accountability: Assigning owners to tasks and tracking progress fosters responsibility.
- Proactive Management: Early detection of issues allows swift mitigation before they cascade.
When these benefits are consistently realized, projects stay on schedule, budgets remain intact, and morale improves because team members know their contributions are recognized and measured.
Key Components of an Effective Template
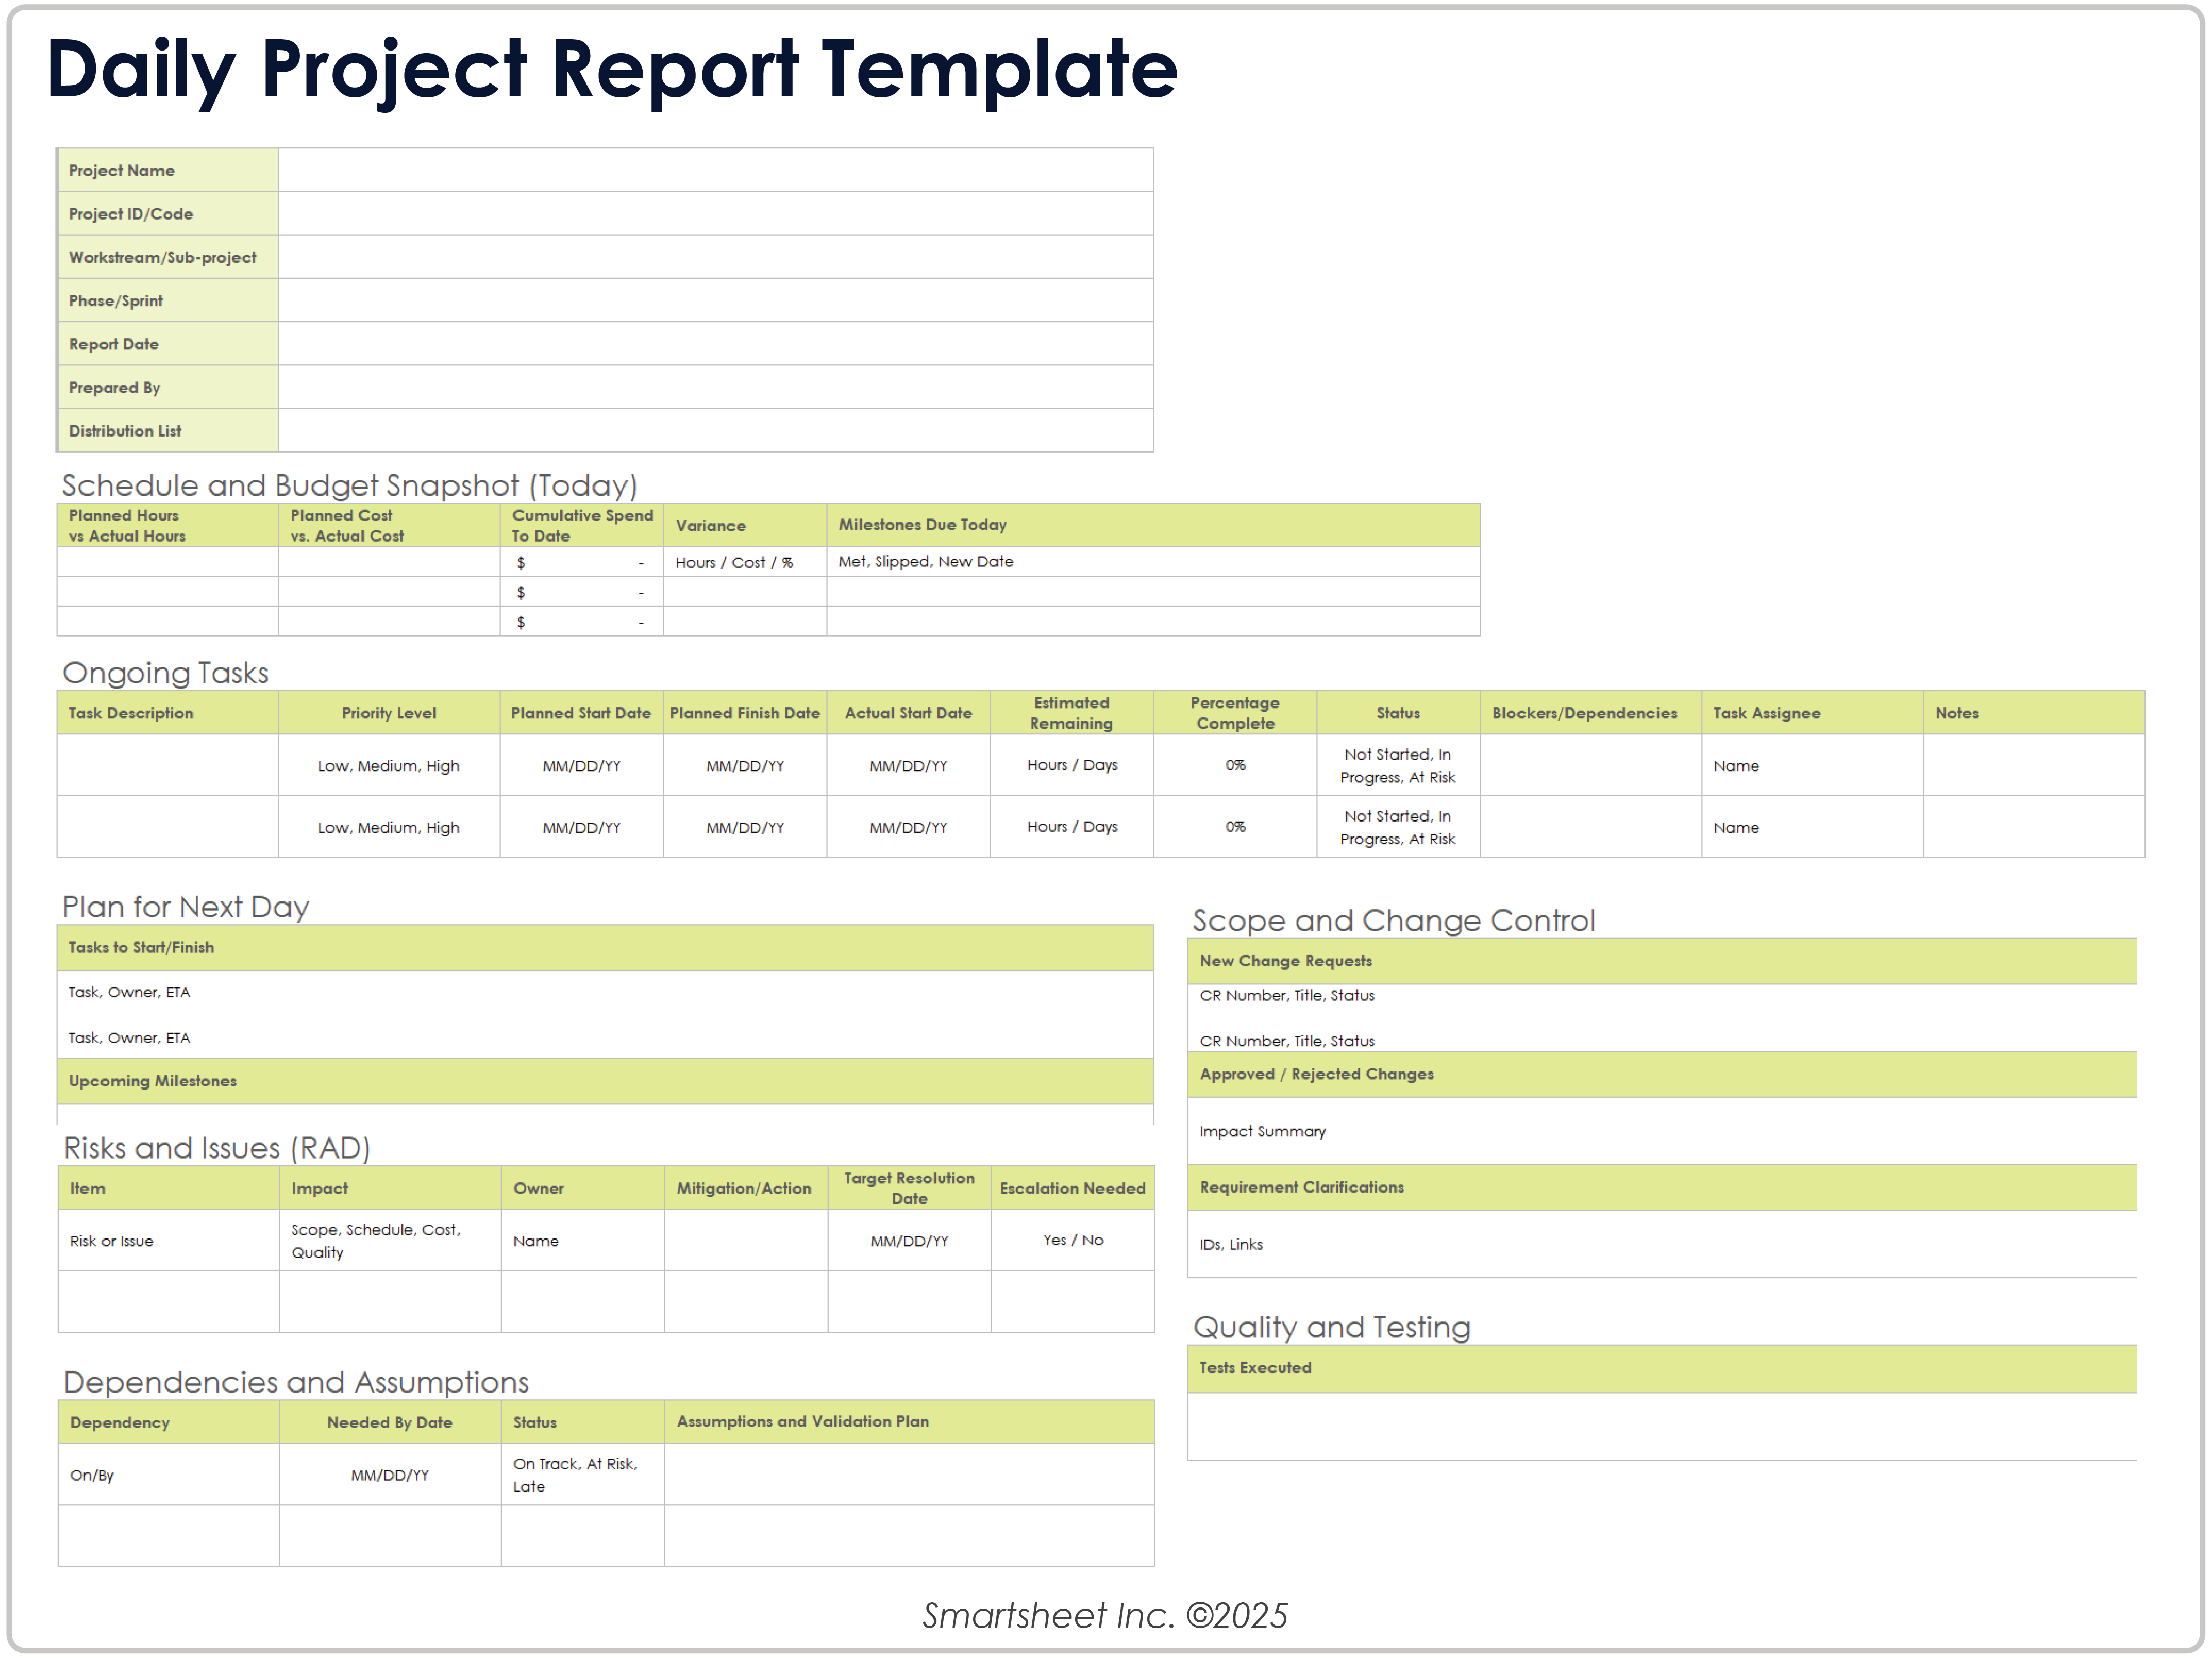
A robust Daily Project Status Report Template balances brevity with depth. The following sections are considered best practice for most software development or product initiatives:
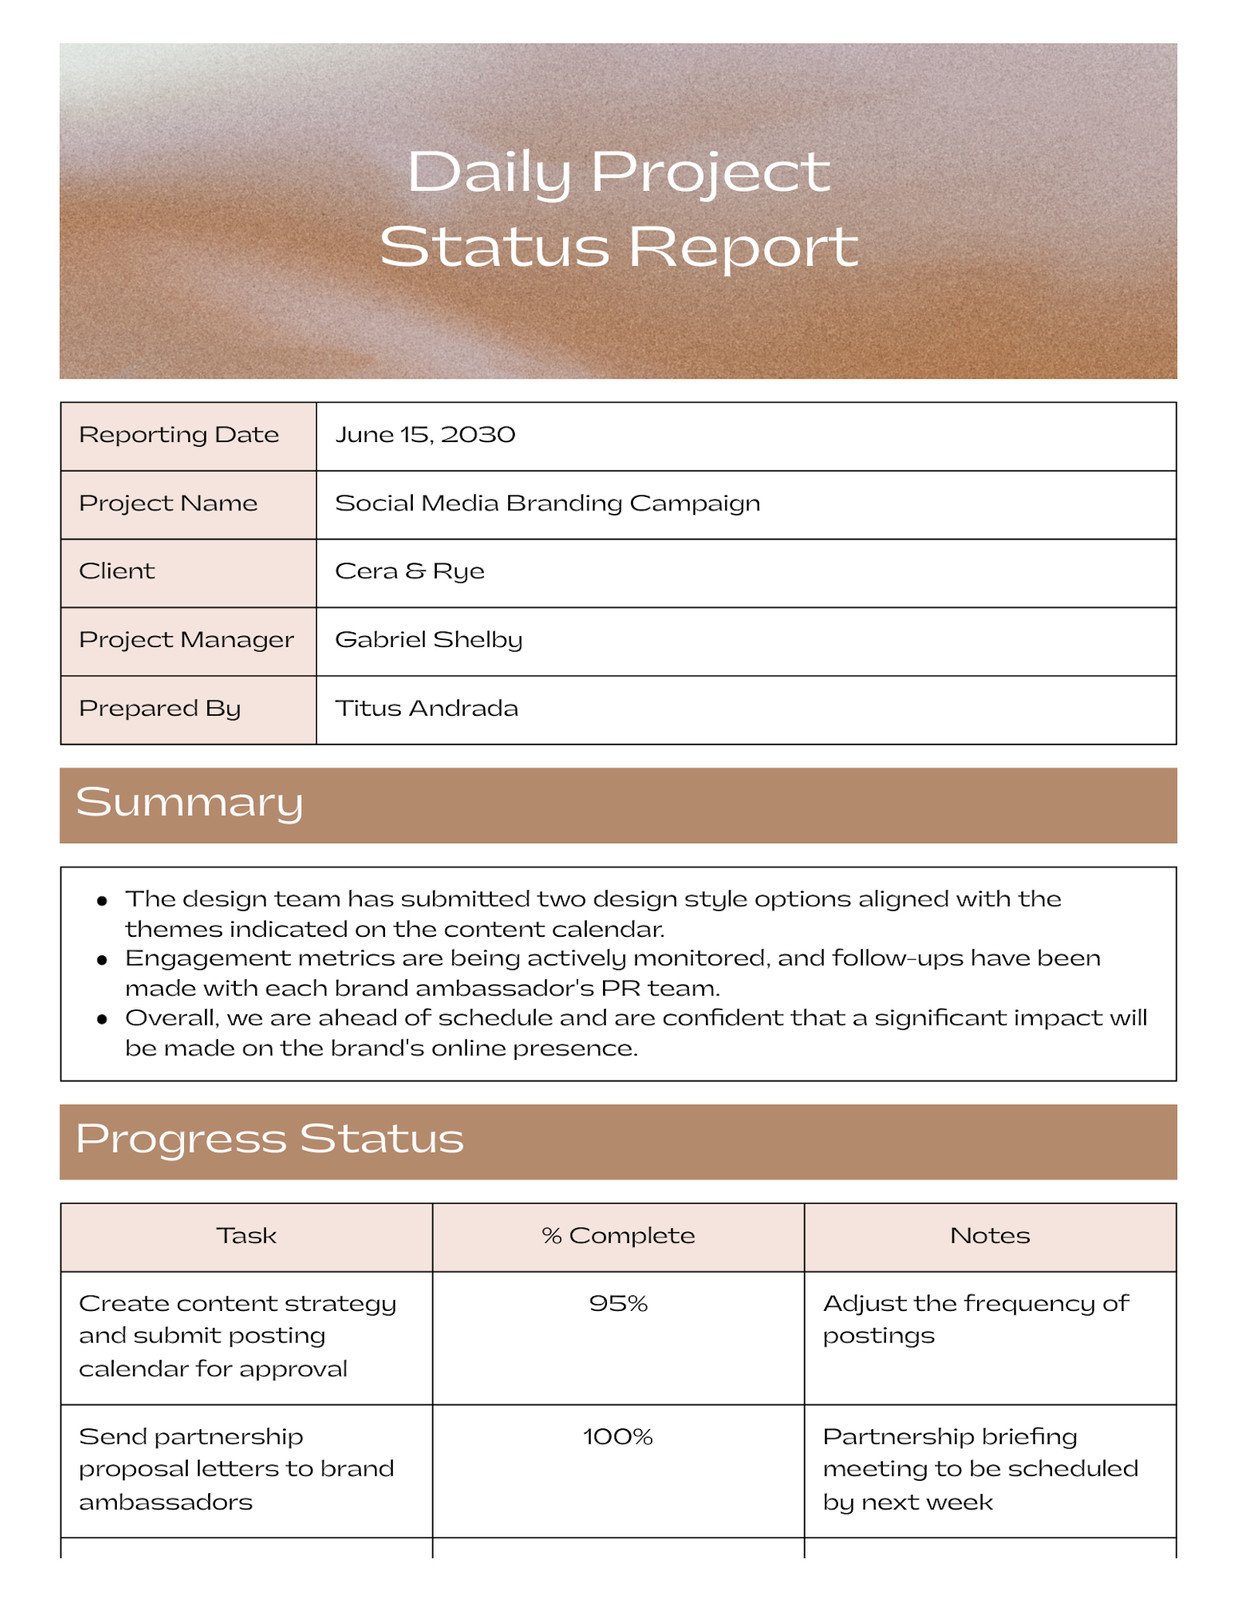
Project Overview
Provide a one‑sentence summary of the project’s purpose, the current sprint or phase, and the reporting date. This contextual line helps readers quickly orient themselves.
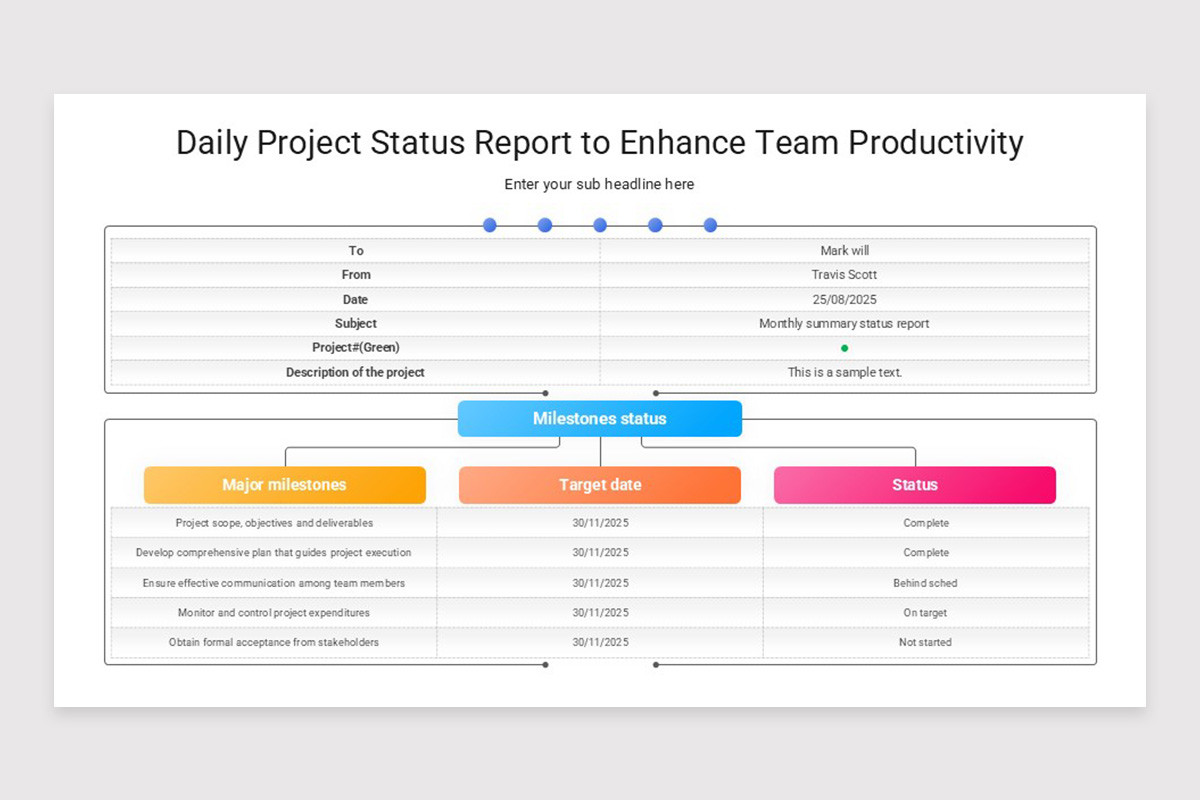
Milestones and Timeline
List major upcoming milestones, their target dates, and current status (e.g., on track, at risk). Use clear indicators such as ✅ for on schedule or ⚠️ for at risk.
Completed Tasks
Summarize what was finished yesterday. Focus on deliverables rather than activities—mention features shipped, bugs resolved, or documentation finalized.
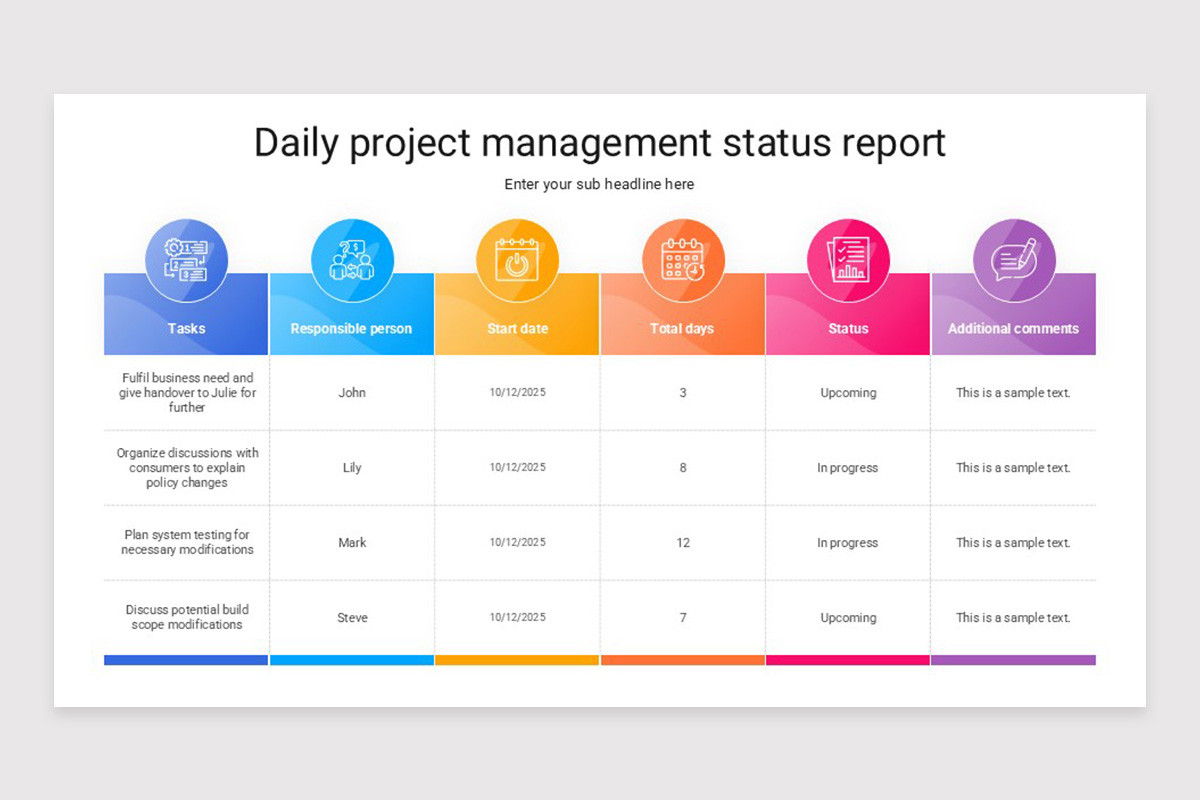
Planned Tasks for Today
Outline the top three to five priorities for the current day. Include the responsible owner for each item to reinforce accountability.
Risks and Blockers
Detail any impediments that could delay progress. Offer a brief mitigation plan or request for assistance to encourage rapid resolution.
Metrics and KPIs
Include quantitative data such as velocity, bug count, code coverage, or test pass rate. Even a single metric provides a data‑driven anchor for the narrative.
Team Feedback
Allow a short free‑form space for team members to share insights, celebrate wins, or suggest process improvements. This human element keeps the report from feeling purely mechanical.
Designing Your Template for Maximum Impact
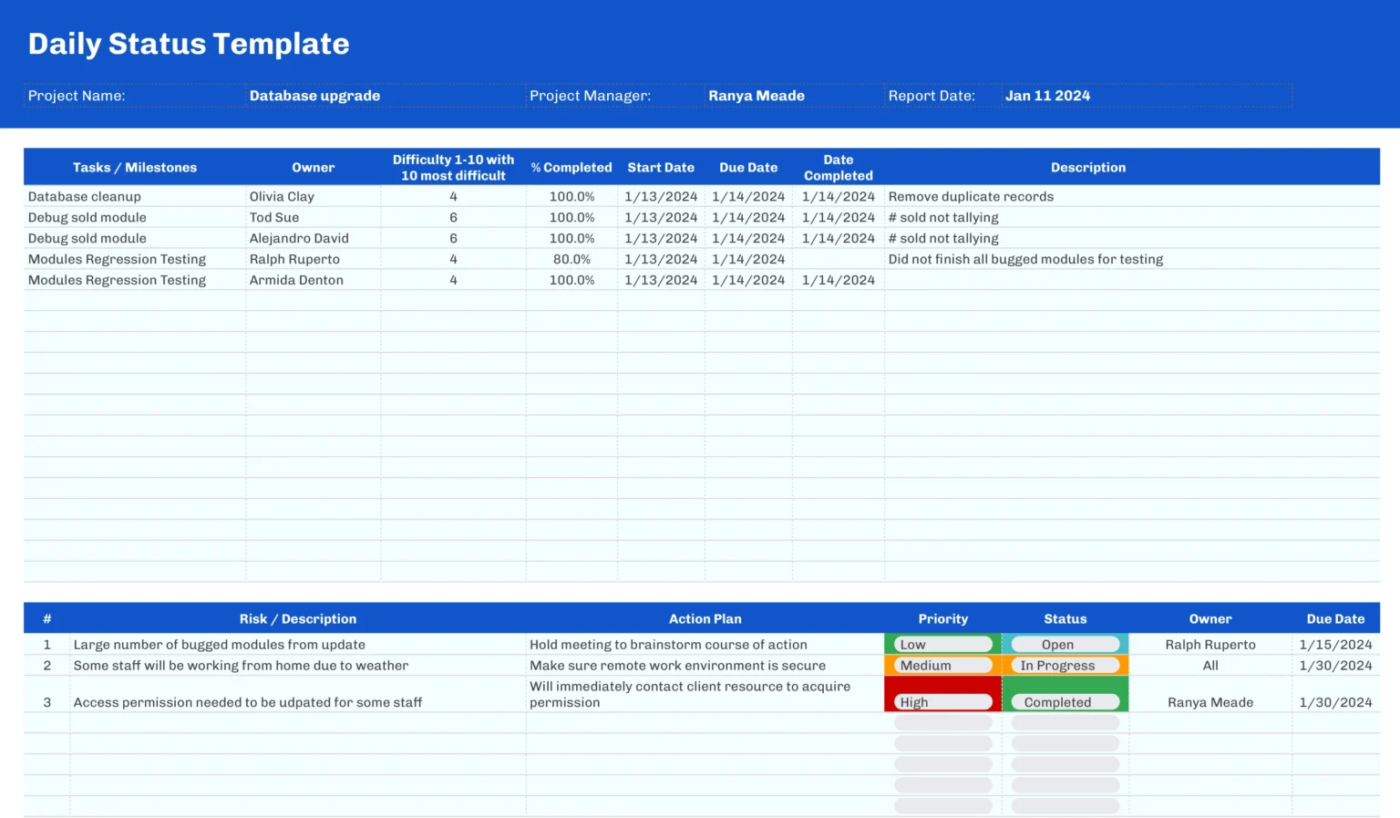
Design isn’t just about aesthetics; it directly influences how quickly information is consumed. Below are design principles that turn a bland spreadsheet into a high‑utility communication tool.
Layout and Hierarchy
Use a logical flow—from high‑level overview down to granular details. Group related sections together and separate them with visual dividers or whitespace. A typical layout might place the Project Overview at the top, followed by Milestones, then daily tasks, and finally Risks and Metrics at the bottom.
Color Coding
Apply a consistent color scheme to convey status at a glance. Green for on‑track, amber for watch, and red for critical issues are universally recognized. Ensure sufficient contrast for accessibility and avoid overly bright palettes that strain the eyes.
Typography
Choose a clean, sans‑serif font (e.g., Arial, Helvetica) for digital reports. Use bold text for headings and key figures, but reserve italics for supplementary notes. Consistent font sizes—larger for headings, smaller for body—enhance readability.
Icons and Symbols
Integrate simple icons (checkmarks, exclamation points, clocks) to replace lengthy explanations. Icons accelerate scanning and reduce cognitive load, especially in remote or asynchronous settings.
Template Formats
While Excel and Google Sheets are popular for their flexibility, design‑focused tools like Canva or PowerPoint can produce polished, printable PDFs. Choose the format that aligns with your team’s workflow and distribution channels.
How to Fill Out the Report Efficiently
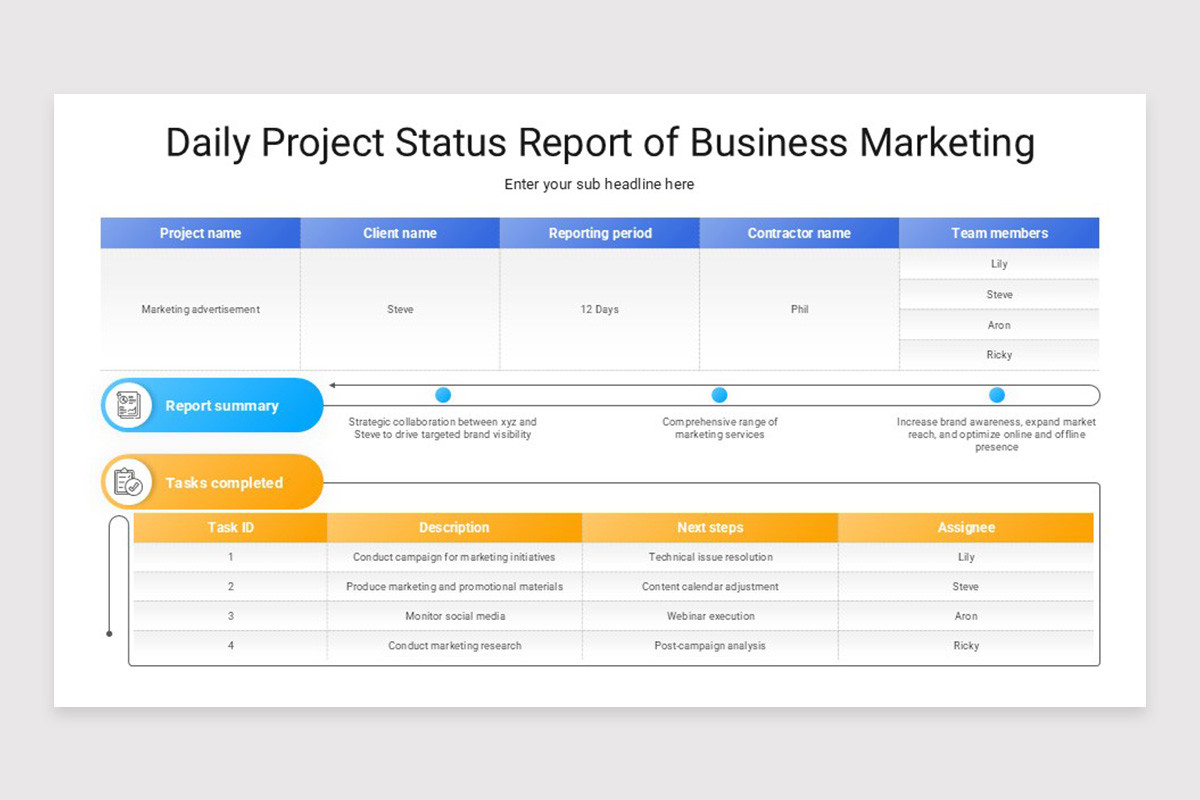
Even the best template becomes a burden if filling it out consumes excessive time. Follow these streamlined steps to keep the process under ten minutes each day.
Preparation
Before the workday ends, gather data from your task board (e.g., Jira, Trello) and any automated metrics dashboards. Export relevant figures or copy-paste status updates into a temporary note.
Template Automation
Leverage formulas or scripts that auto‑populate dates, calculate remaining days to milestones, or pull metrics from external sources. For instance, a simple Excel VLOOKUP can fetch the latest bug count from a shared tracker.
One‑Sentence Summaries
Write concise bullet points—no more than one sentence per item. This habit forces clarity and prevents the report from ballooning into a narrative essay.
Owner Attribution
Always tag the responsible individual next to each task (e.g., “Implement login API – Jane Doe”). This eliminates ambiguity and encourages prompt follow‑up.
Review and Send
Spend the final minute scanning for typos, confirming that all risk items have an owner, and then distribute via your chosen channel (email, Slack, or project portal). Consistency in timing builds trust across the organization.
Tools and Formats That Support Daily Reporting
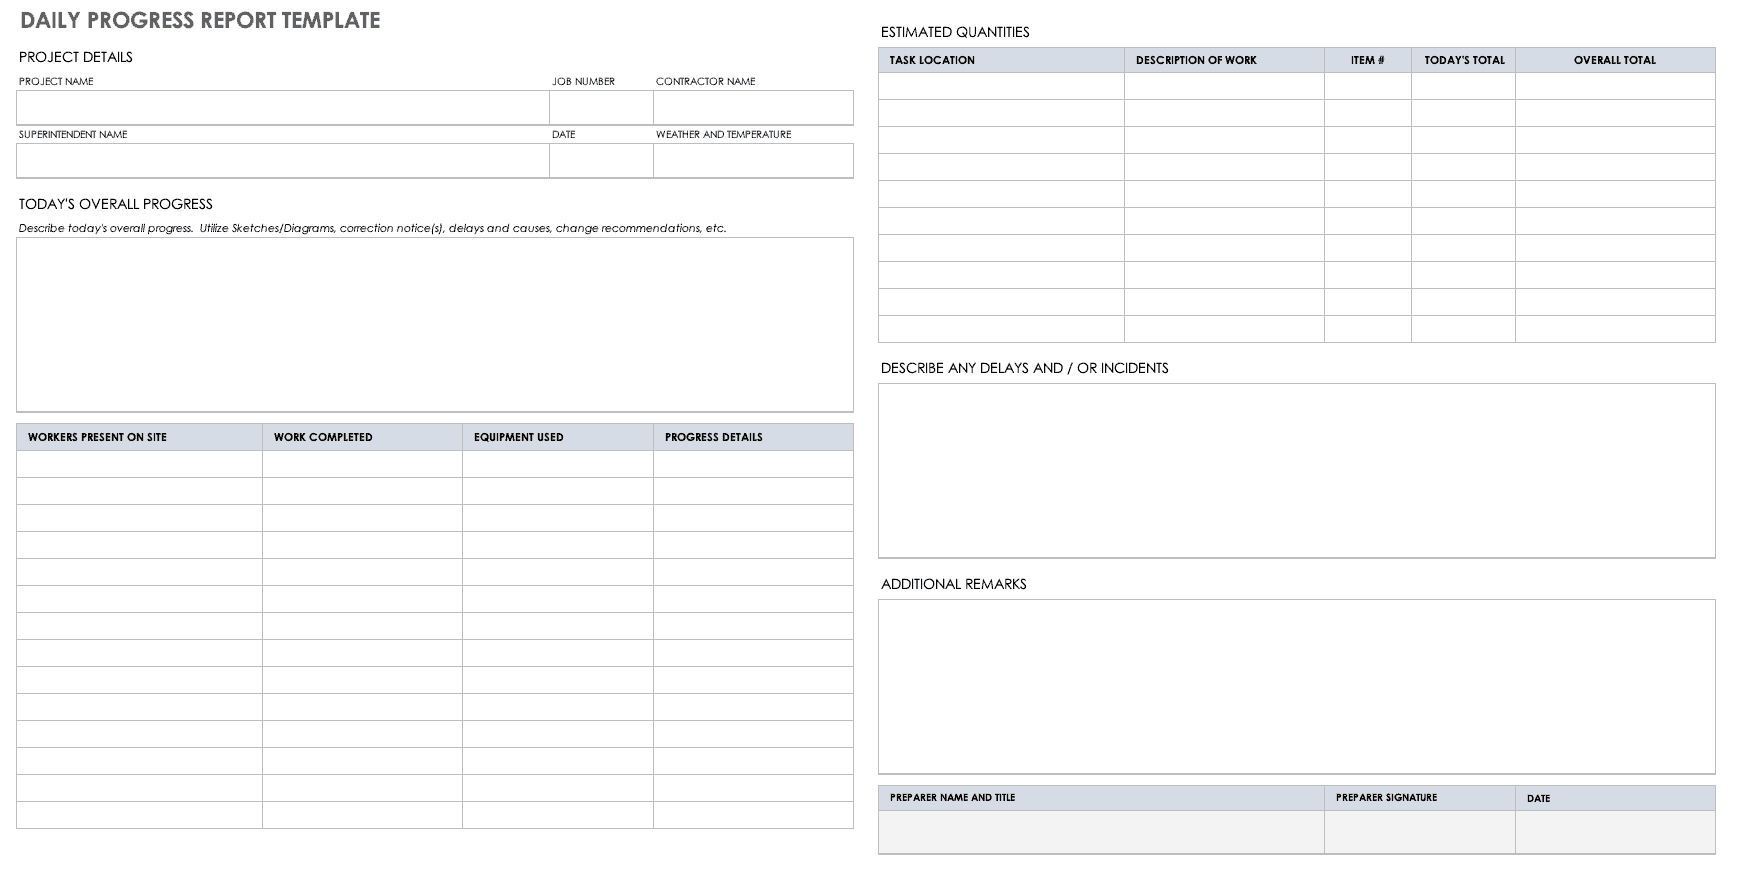
Choosing the right platform can dramatically reduce friction. Below is a comparison of common tools, highlighting strengths relevant to daily status reporting.
- Excel / Google Sheets: Offers formula power, easy sharing, and version control. Ideal for data‑heavy reports.
- Canva: Provides visually appealing templates with drag‑and‑drop design elements. Best for stakeholder presentations.
- Microsoft Teams / Slack Integration: Automate daily reminders and allow team members to submit updates directly in a channel, which can then be compiled into a master report.
- Dedicated Reporting Software (e.g., ClickUp, Monday.com): Built‑in status widgets and dashboards reduce manual entry.
When selecting a tool, consider the existing tech stack, the need for automation, and the visual expectations of your audience.
Best Practices for Teams Using Daily Reports

Adopting a template is only half the battle; cultural adoption ensures its long‑term success. Implement these practices to embed daily reporting into your team’s rhythm.
Set a Fixed Reporting Time
Choose a consistent time—typically end‑of‑day or first thing in the morning—for all members to submit their updates. Synchronizing this window reduces delays and aligns with sprint ceremonies.
Encourage Brevity but Not Vagueness
While the report should be short, each entry must convey actionable information. Avoid generic phrases like “working on tasks” and instead specify deliverables and blockers.
Make It a Two‑Way Conversation
Leaders should respond to risks and blockers promptly, either by assigning help or adjusting scope. This responsiveness reinforces the report’s purpose as a problem‑solving tool.
Review Trends Over Time
Periodically analyze the collected reports to spot recurring bottlenecks, capacity issues, or quality trends. Use these insights for process retrospectives and continuous improvement.
Celebrate Small Wins
Highlight achievements in the “Completed Tasks” or “Team Feedback” sections. Recognition boosts morale and encourages consistent reporting.
Common Mistakes to Avoid

Even seasoned teams can slip into habits that diminish the effectiveness of a daily report. Watch out for these pitfalls and correct them early.
Overloading with Detail
Including every minutiae—such as code line counts or exhaustive meeting notes—dilutes the report’s impact. Stick to high‑level outcomes and critical blockers.
Inconsistent Frequency
Skipping days creates gaps that erode trust. If a team member is on leave, assign a backup to ensure continuity.
Neglecting Metrics
Omitting quantitative data removes an objective lens. Even a single KPI, like sprint velocity, provides valuable context.
Using Jargon Without Explanation
Remember that stakeholders may not share the same technical vocabulary. Translate terms where necessary to maintain clarity.
Failing to Close the Loop
Reporting a blocker without a follow‑up plan leaves the issue unresolved. Always pair risk entries with a mitigation action or request for assistance.
Real‑World Example: A Software Development Sprint
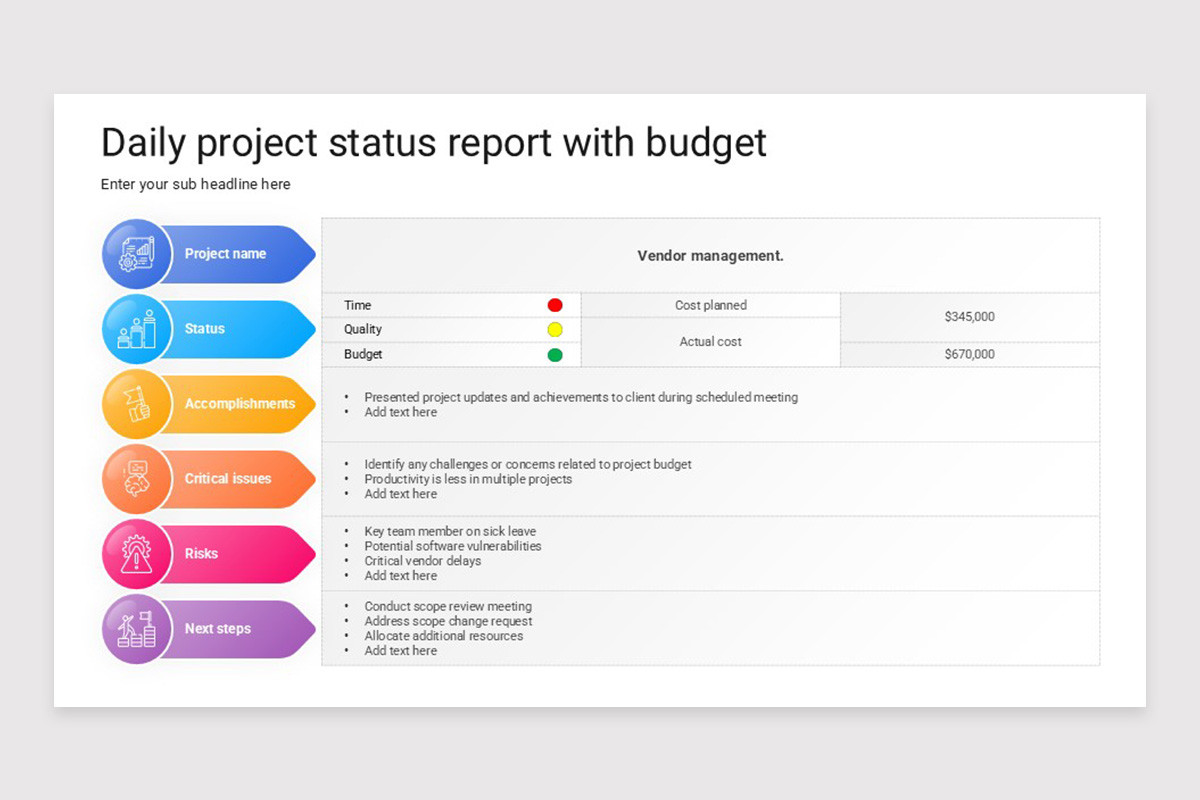
Consider a two‑week sprint for an e‑commerce platform. The team adopts a Daily Project Status Report Template hosted in Google Sheets. Below is a snapshot of a typical day:
- Project Overview: Sprint 12 – Checkout Flow Enhancements – 2026‑09‑04
- Milestones: Checkout Refactor (Due 2026‑09‑15) – ⚠️ At risk due to API latency.
- Completed Tasks: Implemented discount code validation – Alex; Updated unit tests for payment gateway – Rita.
- Planned Tasks for Today: Optimize API response time – Sam; Review UI mockups – Lena.
- Risks and Blockers: API rate limit exceeded – requires temporary increase from backend team; awaiting design assets from UX – follow‑up scheduled 10 am.
- Metrics: Velocity: 21 story points; Bug count: 3 open, 1 critical.
- Team Feedback: “Great progress on discount validation, but we need clearer API documentation.”
This concise entry informs the product owner of progress, alerts the technical lead to a critical API issue, and provides the UX lead a reminder—all within a few minutes of effort.
Tips for Continuous Improvement
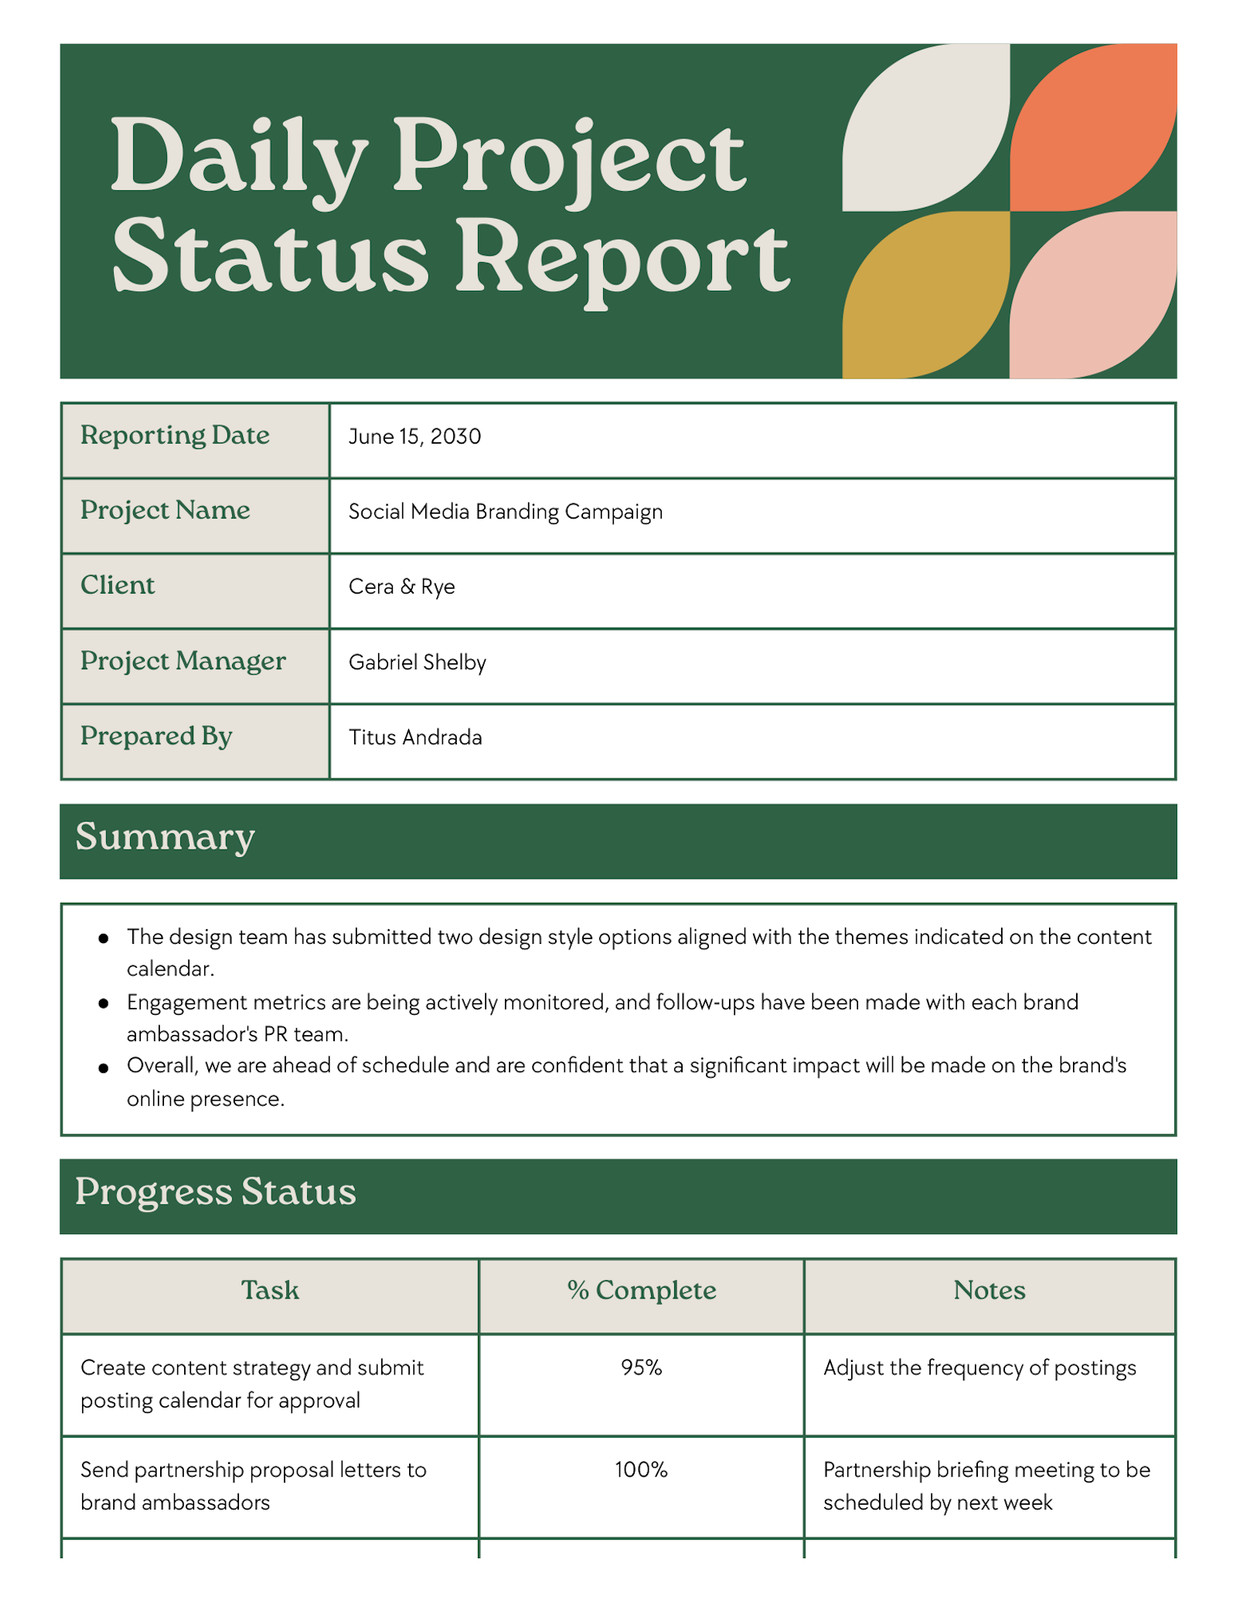
Even after a template is in place, there’s always room to refine the process. Apply these iterative strategies to keep the report relevant and valuable.
Quarterly Review of Template Fields
Gather feedback from the team and stakeholders every three months. Remove sections that are rarely used and add new fields that address emerging needs, such as “Customer Impact” for product releases.
Automate Data Pulls
Integrate APIs from your CI/CD pipeline to auto‑fill build status or deployment counts. This reduces manual entry and ensures data accuracy.
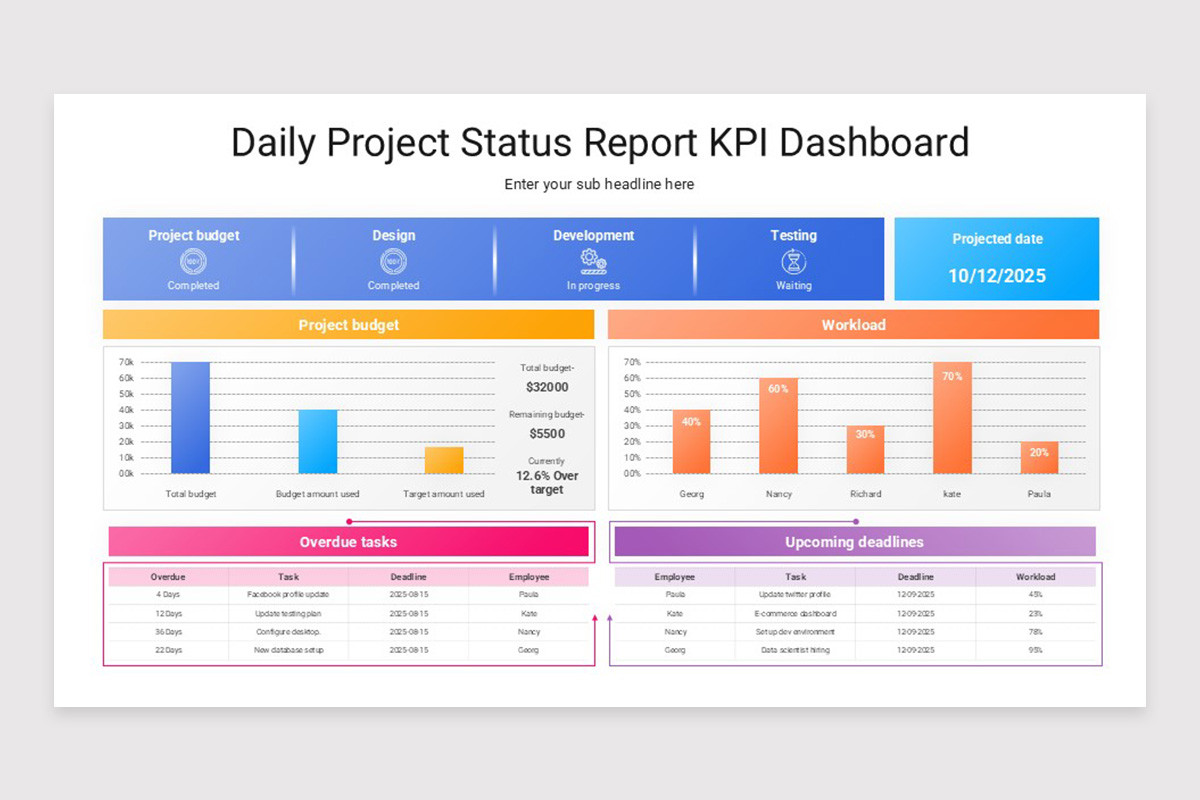
Leverage Visual Dashboards
Transform the raw report data into a live dashboard using tools like Power BI or Google Data Studio. Visual trends can be displayed in weekly review meetings.
Train New Team Members
Include a short onboarding module that explains the purpose, structure, and best practices of the daily report. Consistency from day one accelerates adoption.
Encourage Cross‑Team Transparency
Share the daily report with adjacent teams—QA, support, and marketing—to align expectations and anticipate downstream impacts.
Conclusion
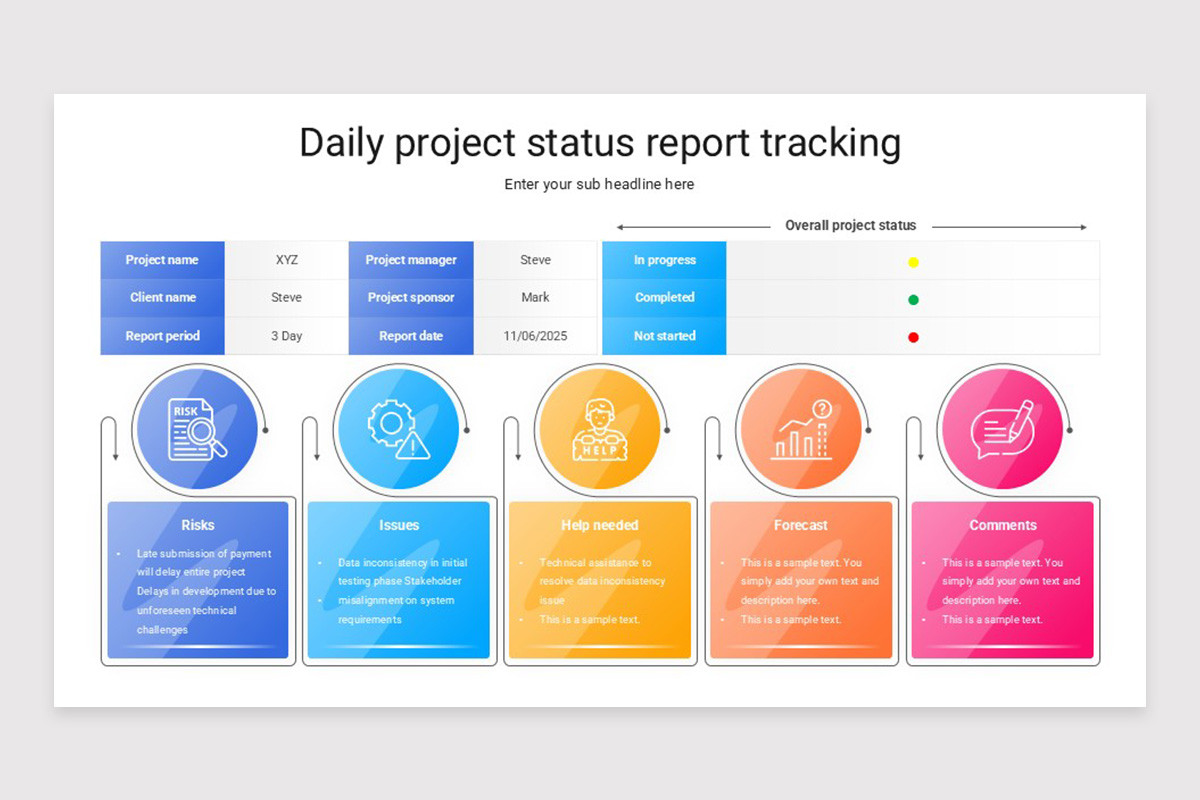
A well‑designed Daily Project Status Report Template transforms routine updates into a strategic asset that drives visibility, accountability, and proactive risk management. By focusing on essential components, applying thoughtful design, automating repetitive tasks, and fostering a culture of concise communication, teams can deliver projects on time, within budget, and with higher stakeholder satisfaction. Regularly reviewing and iterating on the template ensures it remains aligned with evolving goals, making daily reporting not just a chore, but a catalyst for continuous improvement and collective success.