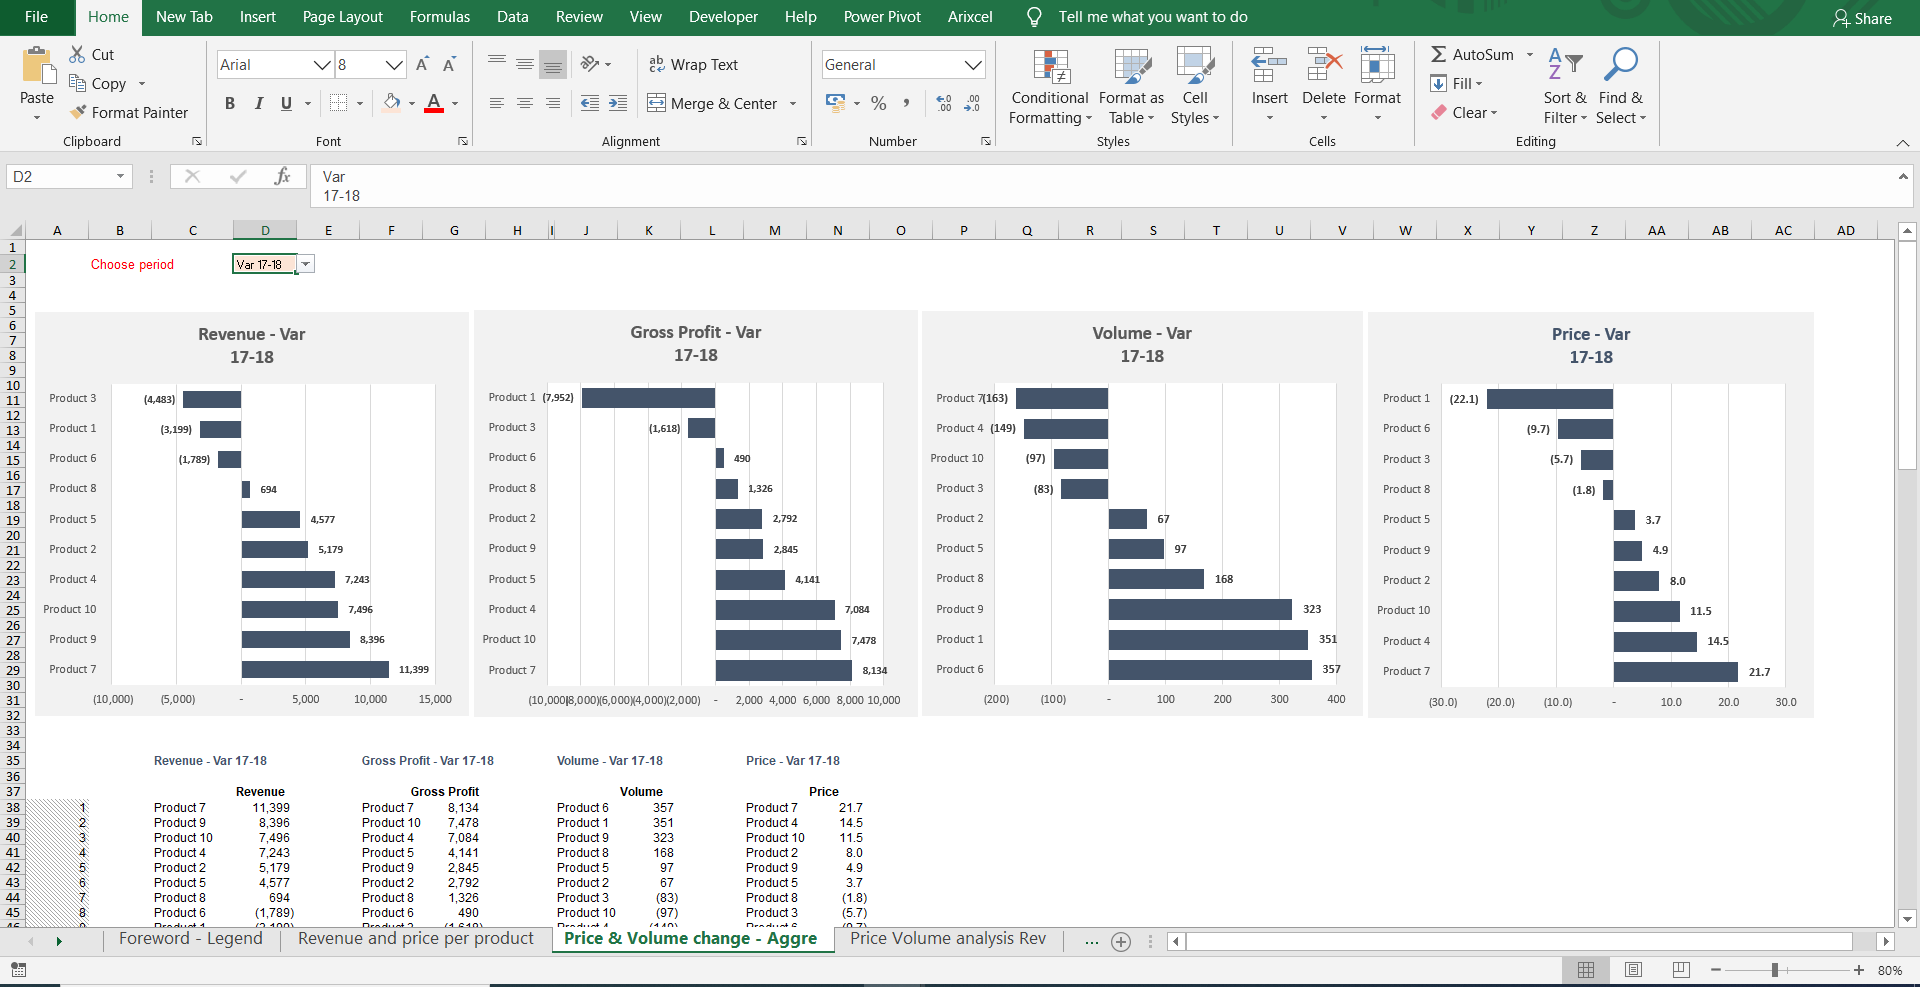
Gross Margin Analysis Excel Template is the cornerstone for businesses seeking to understand profitability, control costs, and drive strategic decisions. By capturing revenue, cost of goods sold, and calculating margin percentages, this template provides a clear picture of how well a company manages its production and pricing strategies. In this guide, we will walk through how to leverage a robust gross margin Excel tool, especially tailored for Asian enterprises that value precision, hierarchy, and long‑term growth.
Understanding Gross Margin in the Asian Business Context

Gross margin, the difference between revenue and cost of goods sold (COGS), reflects operational efficiency. Asian manufacturers—whether in Shenzhen, Seoul, or Jakarta—often operate on tight margins, making this metric vital for competitive advantage. A high gross margin indicates that a firm can absorb market fluctuations, invest in innovation, or reward stakeholders without compromising quality.
Key Definitions
- Revenue – The total amount earned from sales of products or services.
- Cost of Goods Sold (COGS) – Direct costs of production such as raw materials, labor, and factory overhead.
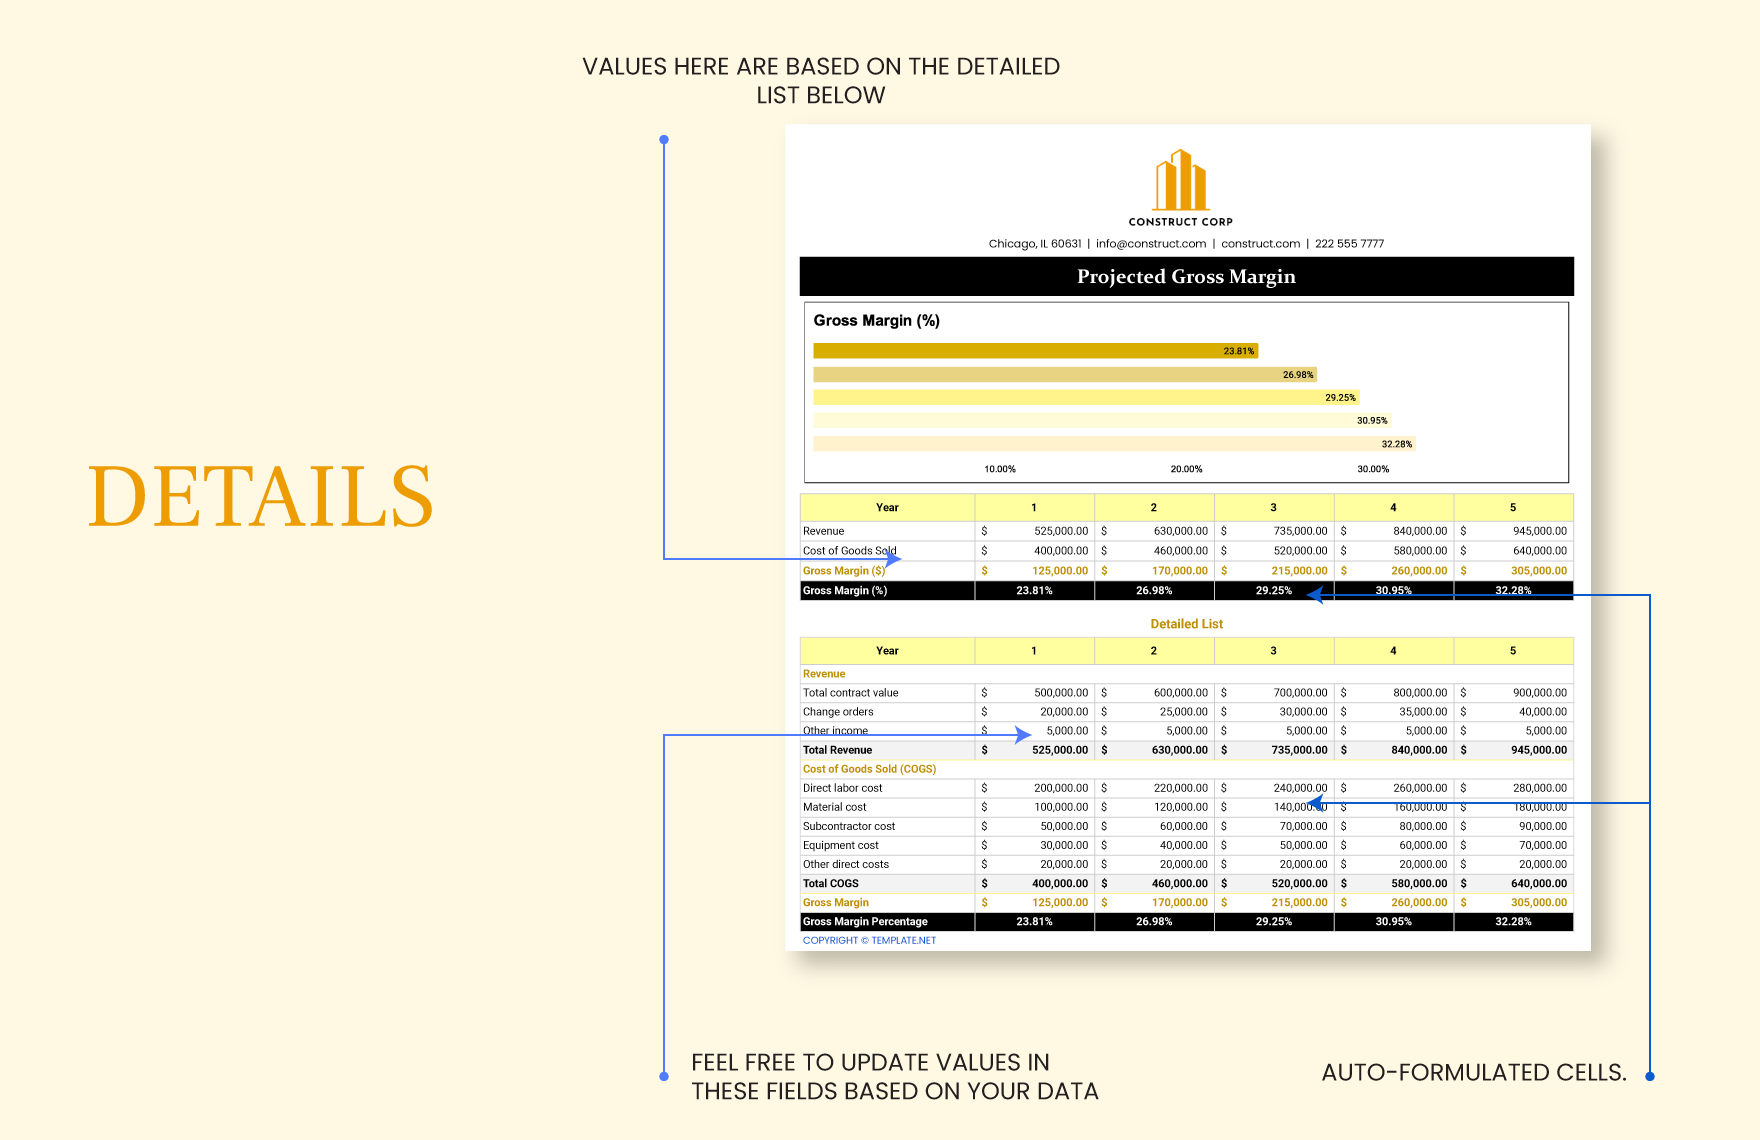
- Gross Margin – (Revenue – COGS) / Revenue, expressed as a percentage.
- Gross Profit – The monetary value left after subtracting COGS from revenue.
Why an Excel Template Matters for Asian Enterprises

In regions where manufacturing is a major economic pillar, the ability to rapidly analyze cost structures is essential. An Excel template offers several advantages: it is accessible, customizable, and can integrate with existing ERP or accounting systems. Moreover, Asian companies often use Excel as a bridge between detailed production data and high‑level decision making.
Benefits of a Structured Template
- Data Consistency – Pre‑defined formulas reduce calculation errors, which is critical for audit‑ready reporting.
- Scalability – Whether you run a small craft shop or a multinational conglomerate, the template scales with your data volume.
- Scenario Analysis – Quick what‑if simulations help managers test price changes or sourcing alternatives.
- Visual Dashboards – Charts and conditional formatting turn numbers into actionable insights.
Core Components of a Robust Gross Margin Template
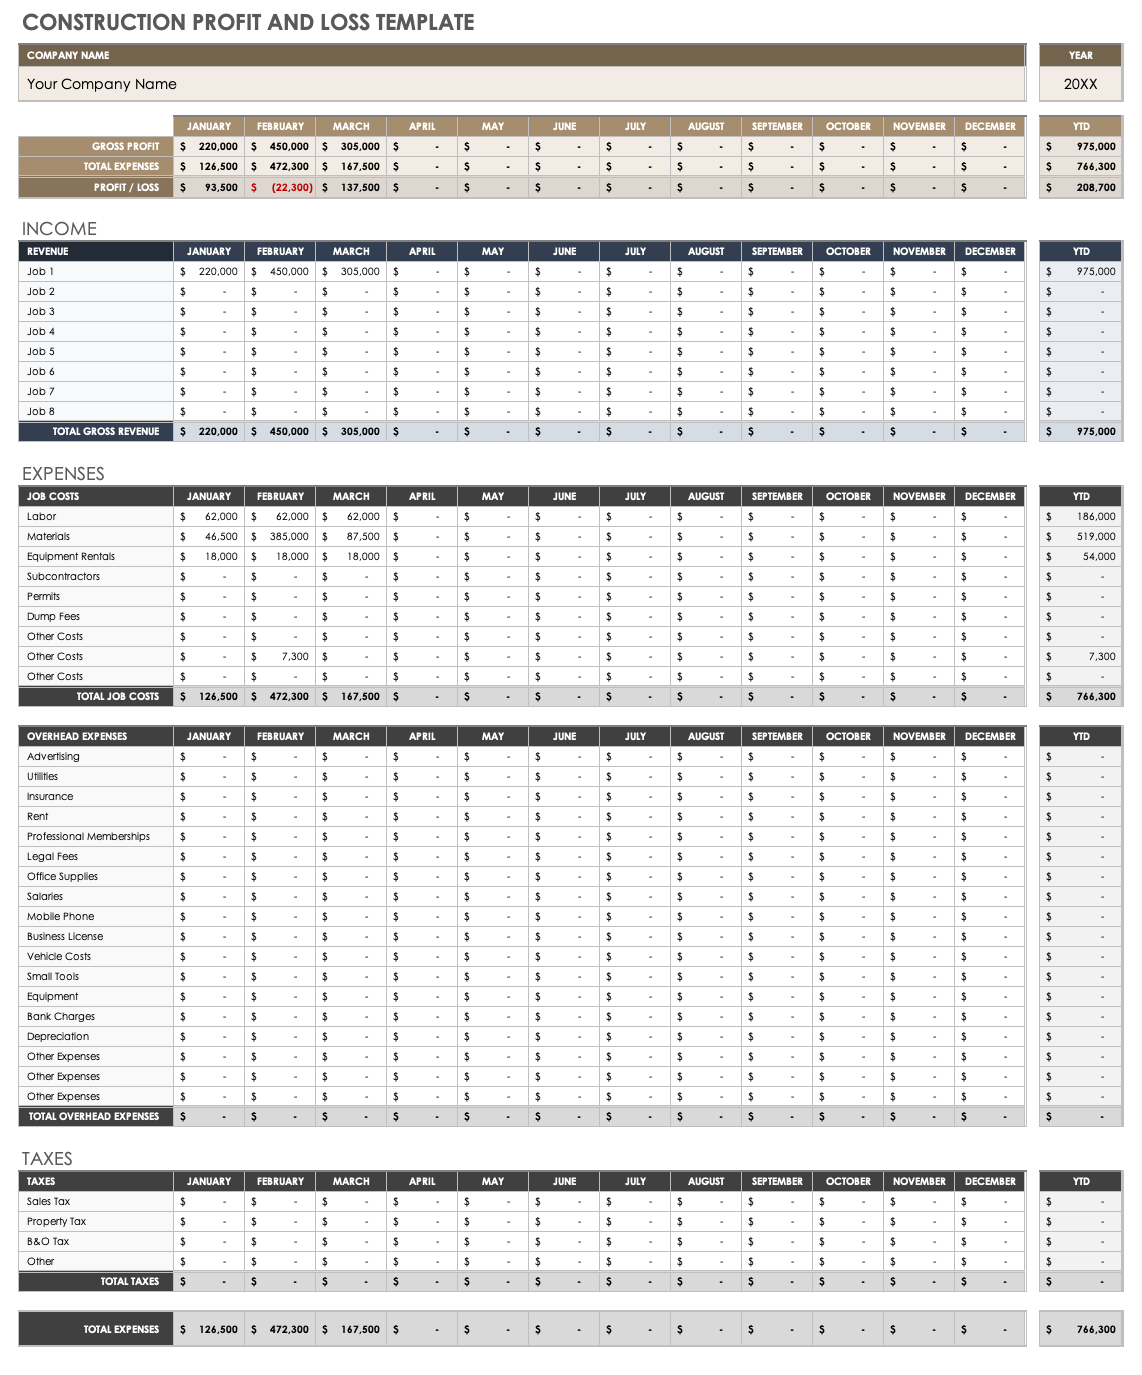
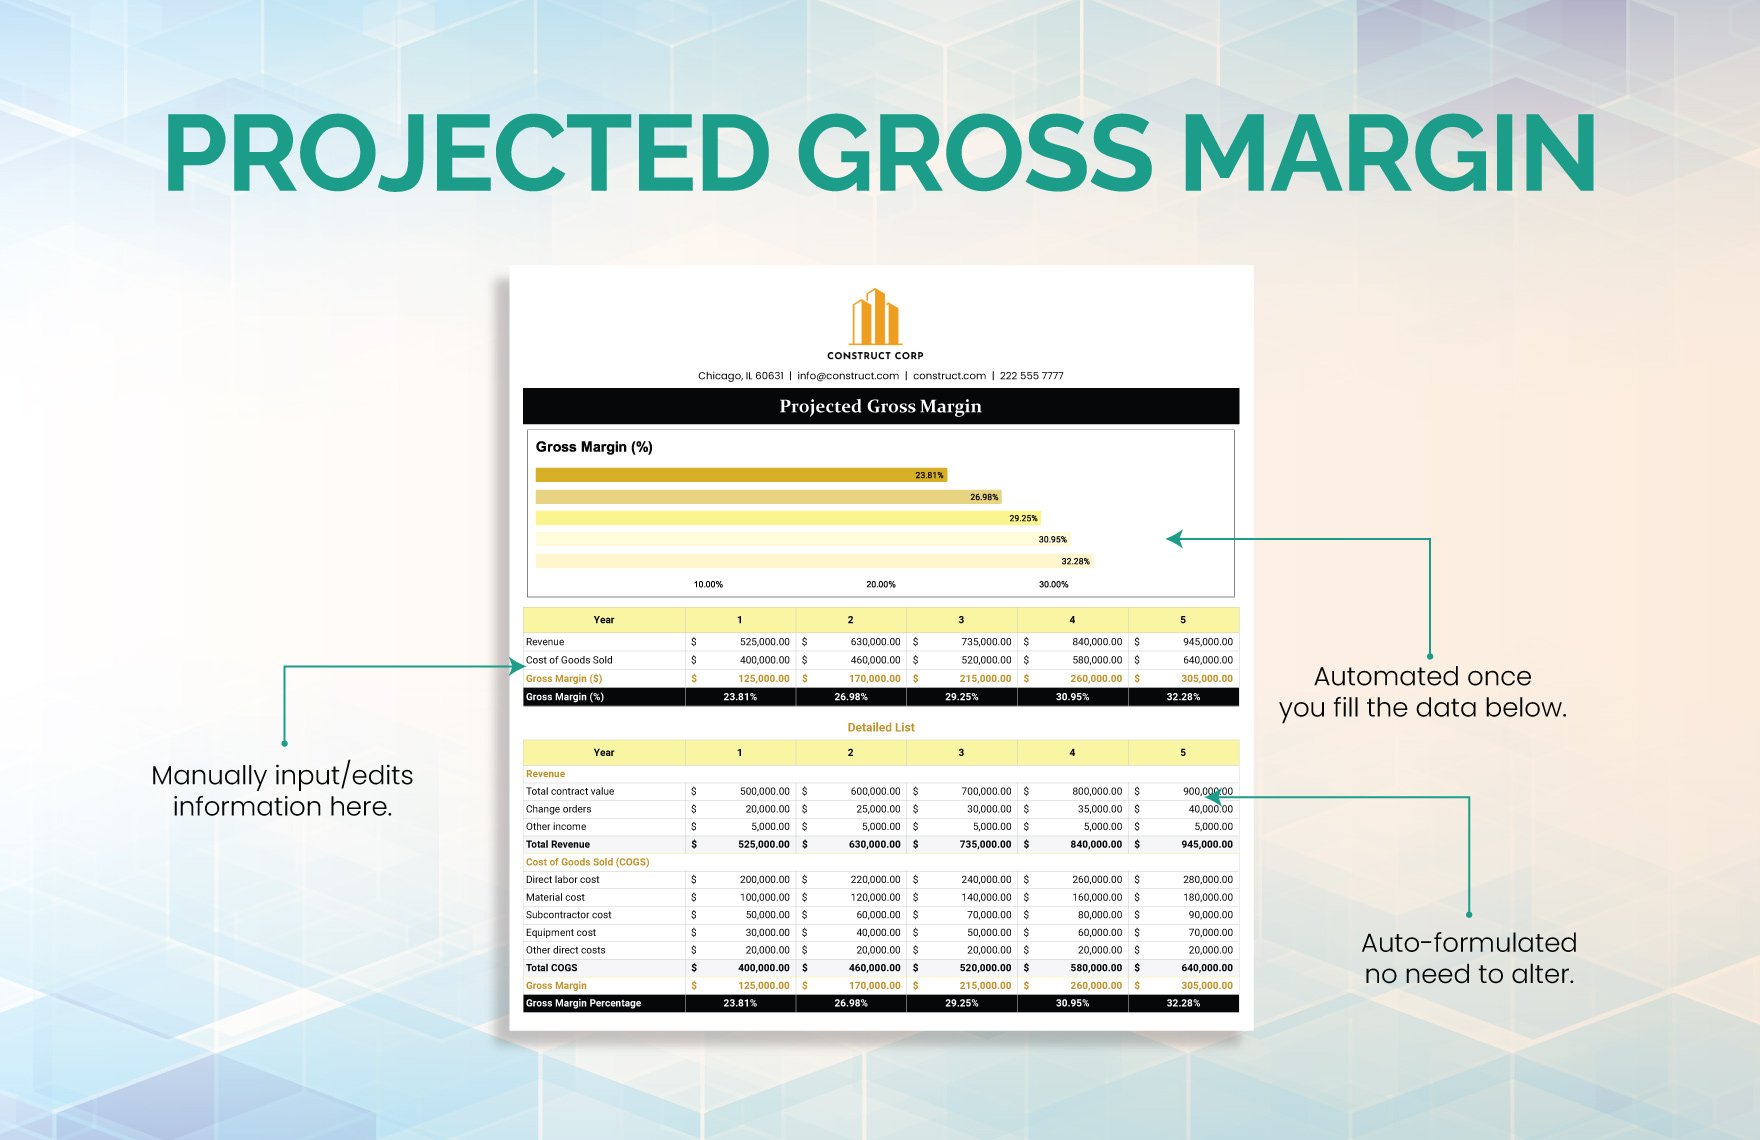
A well‑designed template consists of several interconnected sheets. Below is a detailed breakdown of each component and how they collaborate to produce a holistic view of profitability.
1. Data Entry Sheet
Start with a clean, tabular layout. Columns typically include:
- Product or Service Code
- Description
- Unit Price
- Quantity Sold
- COGS per Unit
- Other Direct Costs (e.g., packaging, logistics)
- Sales Channel
Use data validation drop‑downs for product codes and sales channels to maintain consistency. This sheet should be the foundation; all calculations pull from here.
2. Calculated Fields
After the raw data, add automatic calculations:
- Revenue per Item – Unit Price × Quantity Sold.
- Total COGS – COGS per Unit × Quantity Sold.
- Gross Profit per Item – Revenue – Total COGS.
- Gross Margin % – Gross Profit ÷ Revenue.
Employ Excel’s SUMIFS and VLOOKUP functions to aggregate across product lines and regions.
3. Summary Dashboard
For quick reference, create a dashboard with key metrics:
- Overall Gross Margin %.
- Top‑selling product lines by margin.
- Regional margin comparison.
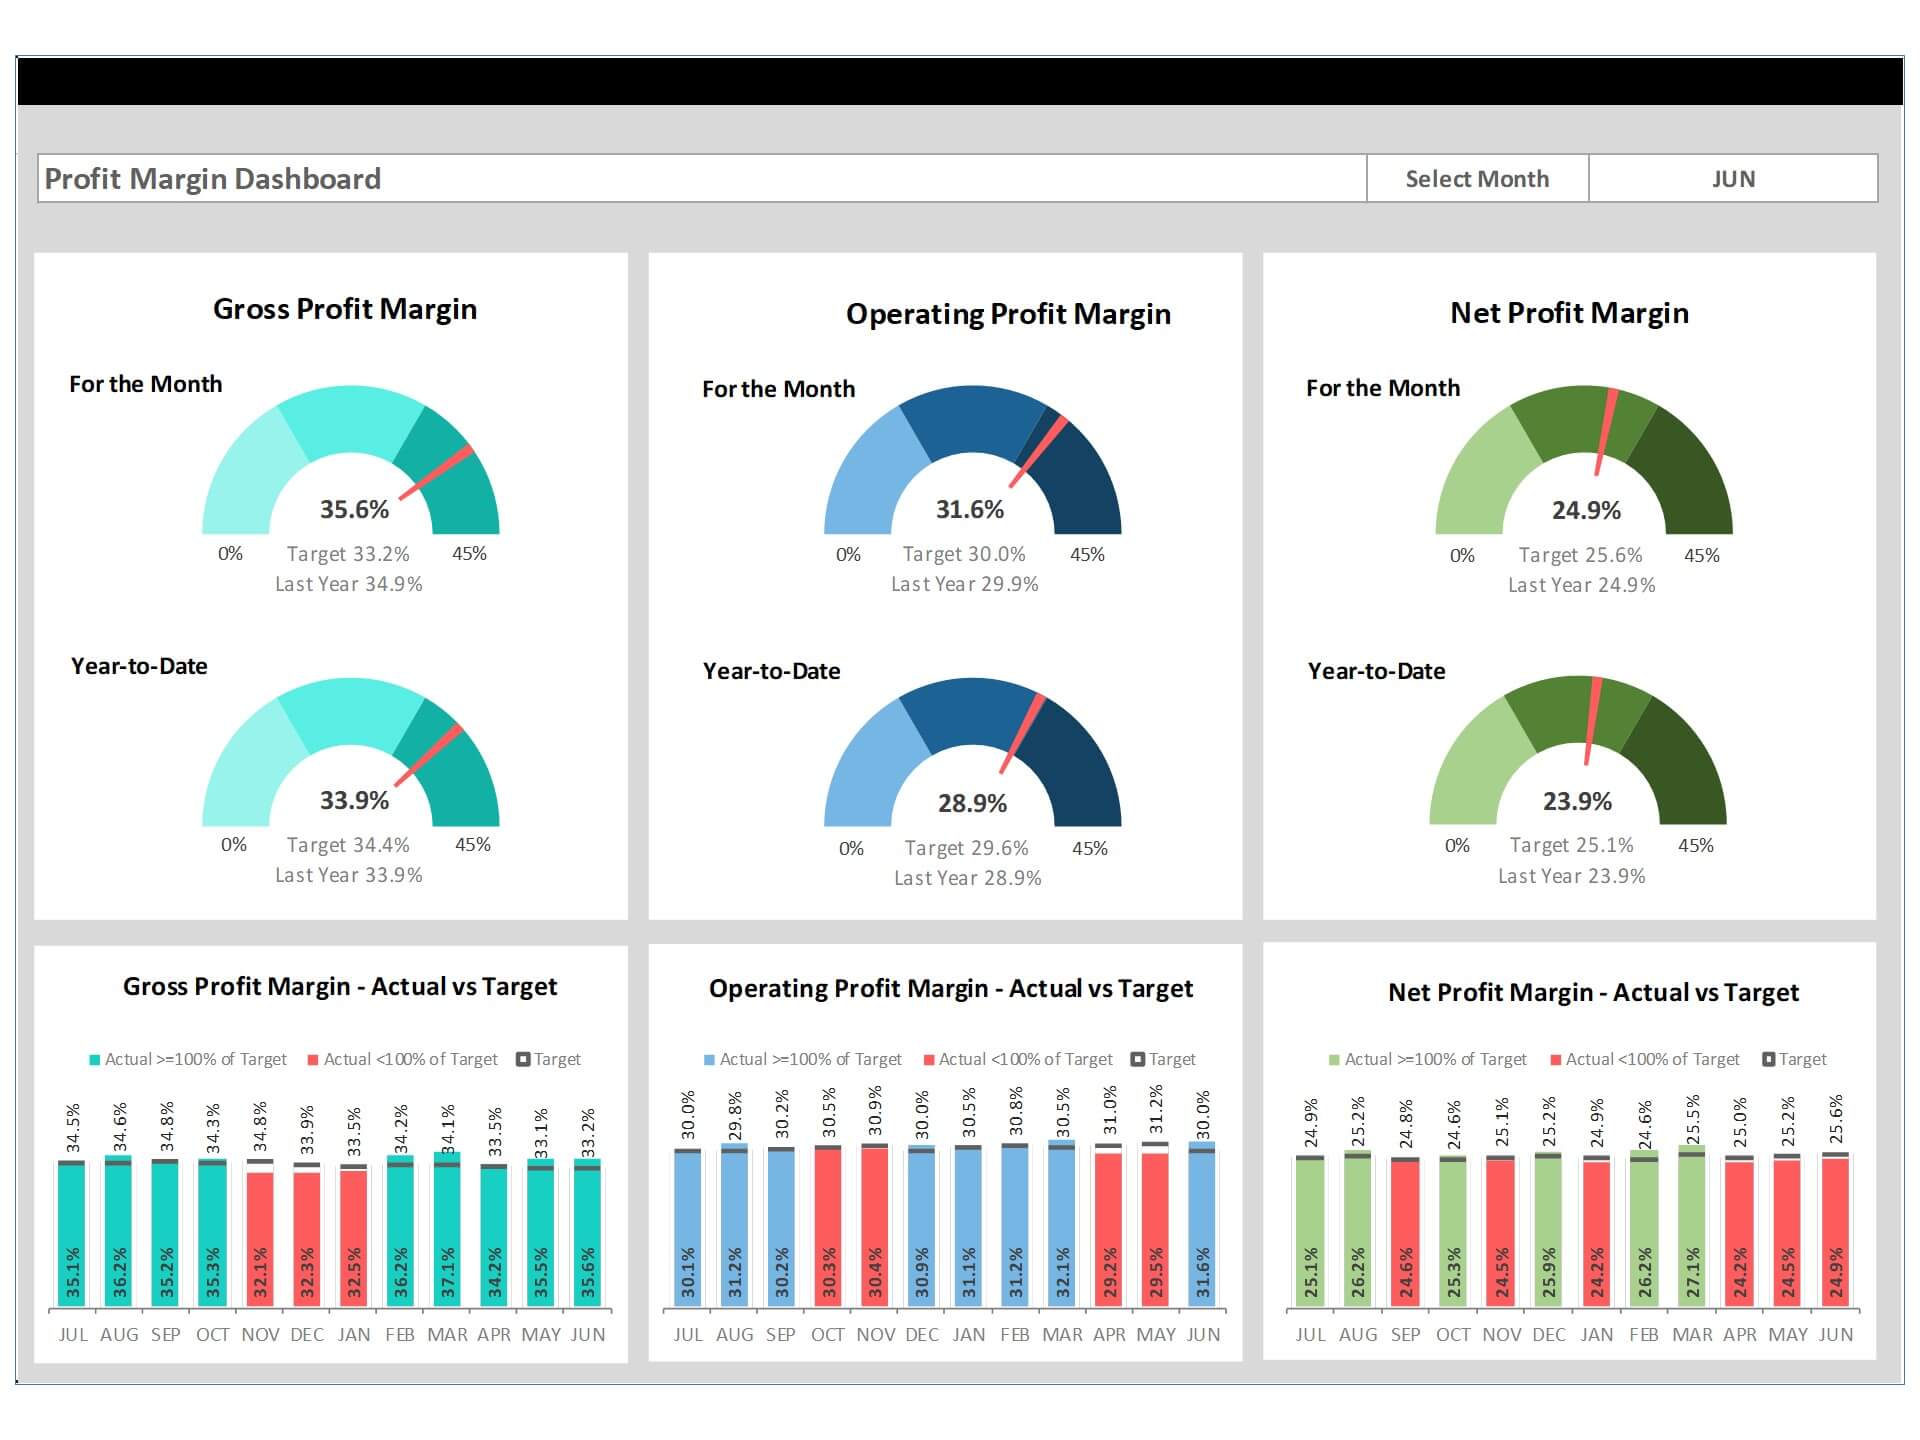
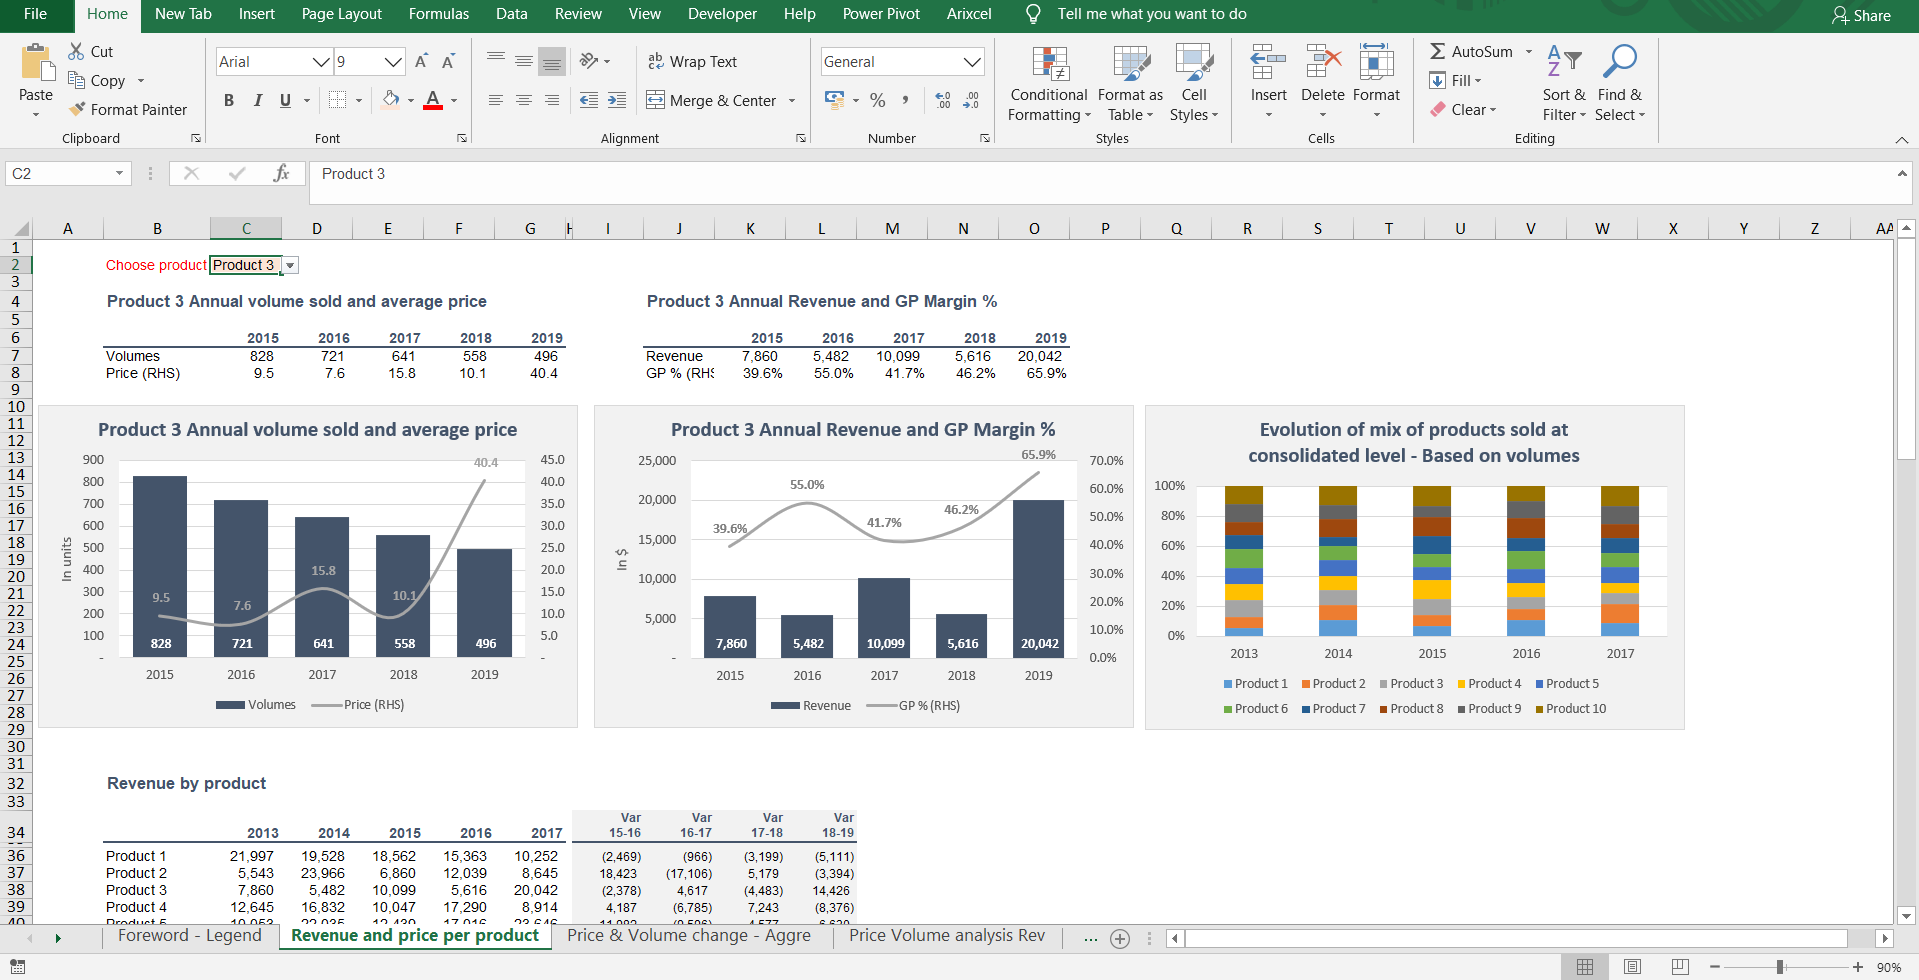
- Historical trend chart over the last 12 months.
Conditional formatting highlights items below a target margin threshold, prompting managers to investigate cost drivers.
4. Scenario Planning Tool
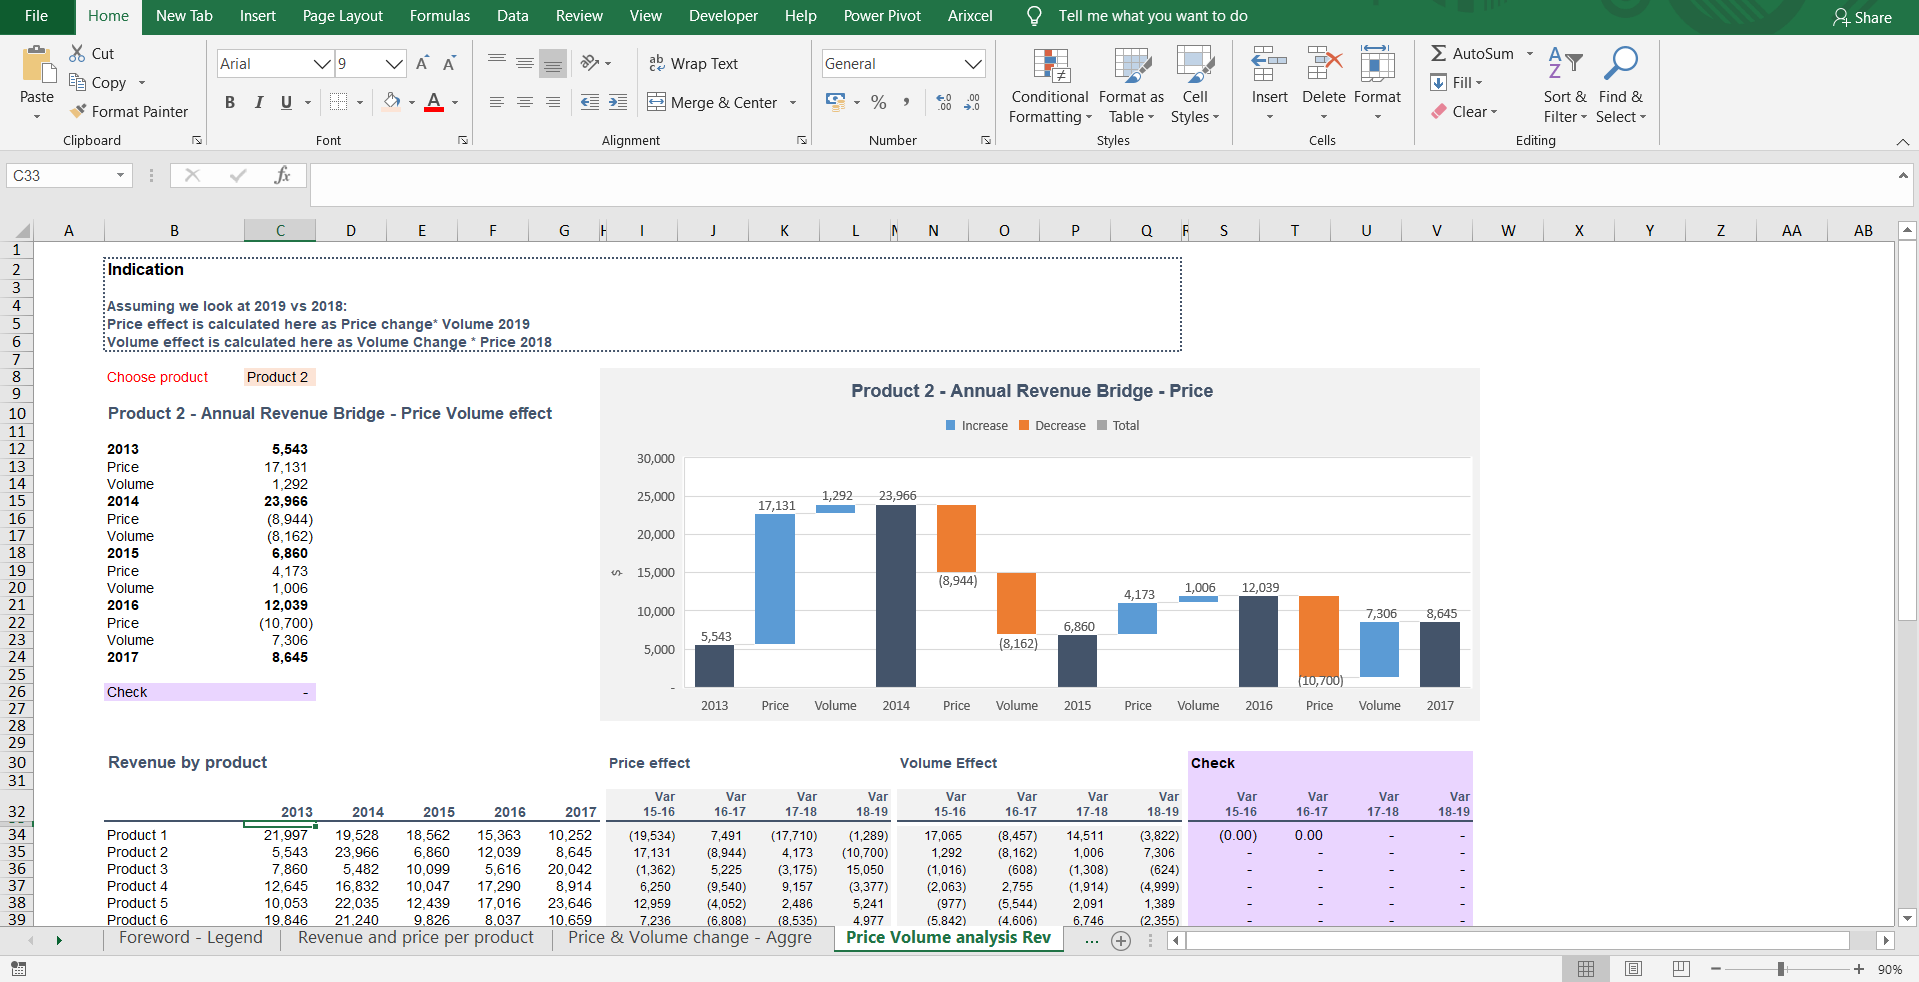
Use Excel’s data tables or the Solver add‑in to model scenarios. For example, test how a 5% increase in raw material costs impacts overall margins, or simulate a price hike on a flagship product to see revenue elasticity.
Step‑by‑Step Guide to Building Your Template

Step 1 – Define Your Business Scope
Identify the products or services that will feed into the template. For a fashion manufacturer in Guangzhou, you might list apparel categories, whereas a software firm in Bangalore would catalog subscription tiers.
Step 2 – Set Up the Data Entry Sheet
Use a dedicated worksheet named “Raw Data.” Include the columns described earlier and lock the header row with freeze panes. Apply data validation lists for product codes to prevent typos.
Step 3 – Create Calculated Columns
Insert new columns after the raw data to calculate revenue, COGS, profit, and margin. For example, in cell E2 (Revenue), input:
=C2*D2 (where C is Unit Price and D is Quantity Sold).
Drag the formula down to cover all rows. Repeat similar formulas for Total COGS and Gross Profit.
Step 4 – Build the Summary Dashboard
On a separate worksheet, use SUM and SUMIF functions to aggregate totals. For instance, to compute overall Gross Margin %:
=SUM(ProfitColumn)/SUM(RevenueColumn).
Insert a line chart to visualize monthly margins. Use slicers to filter by product or region.
Step 5 – Integrate Scenario Analysis
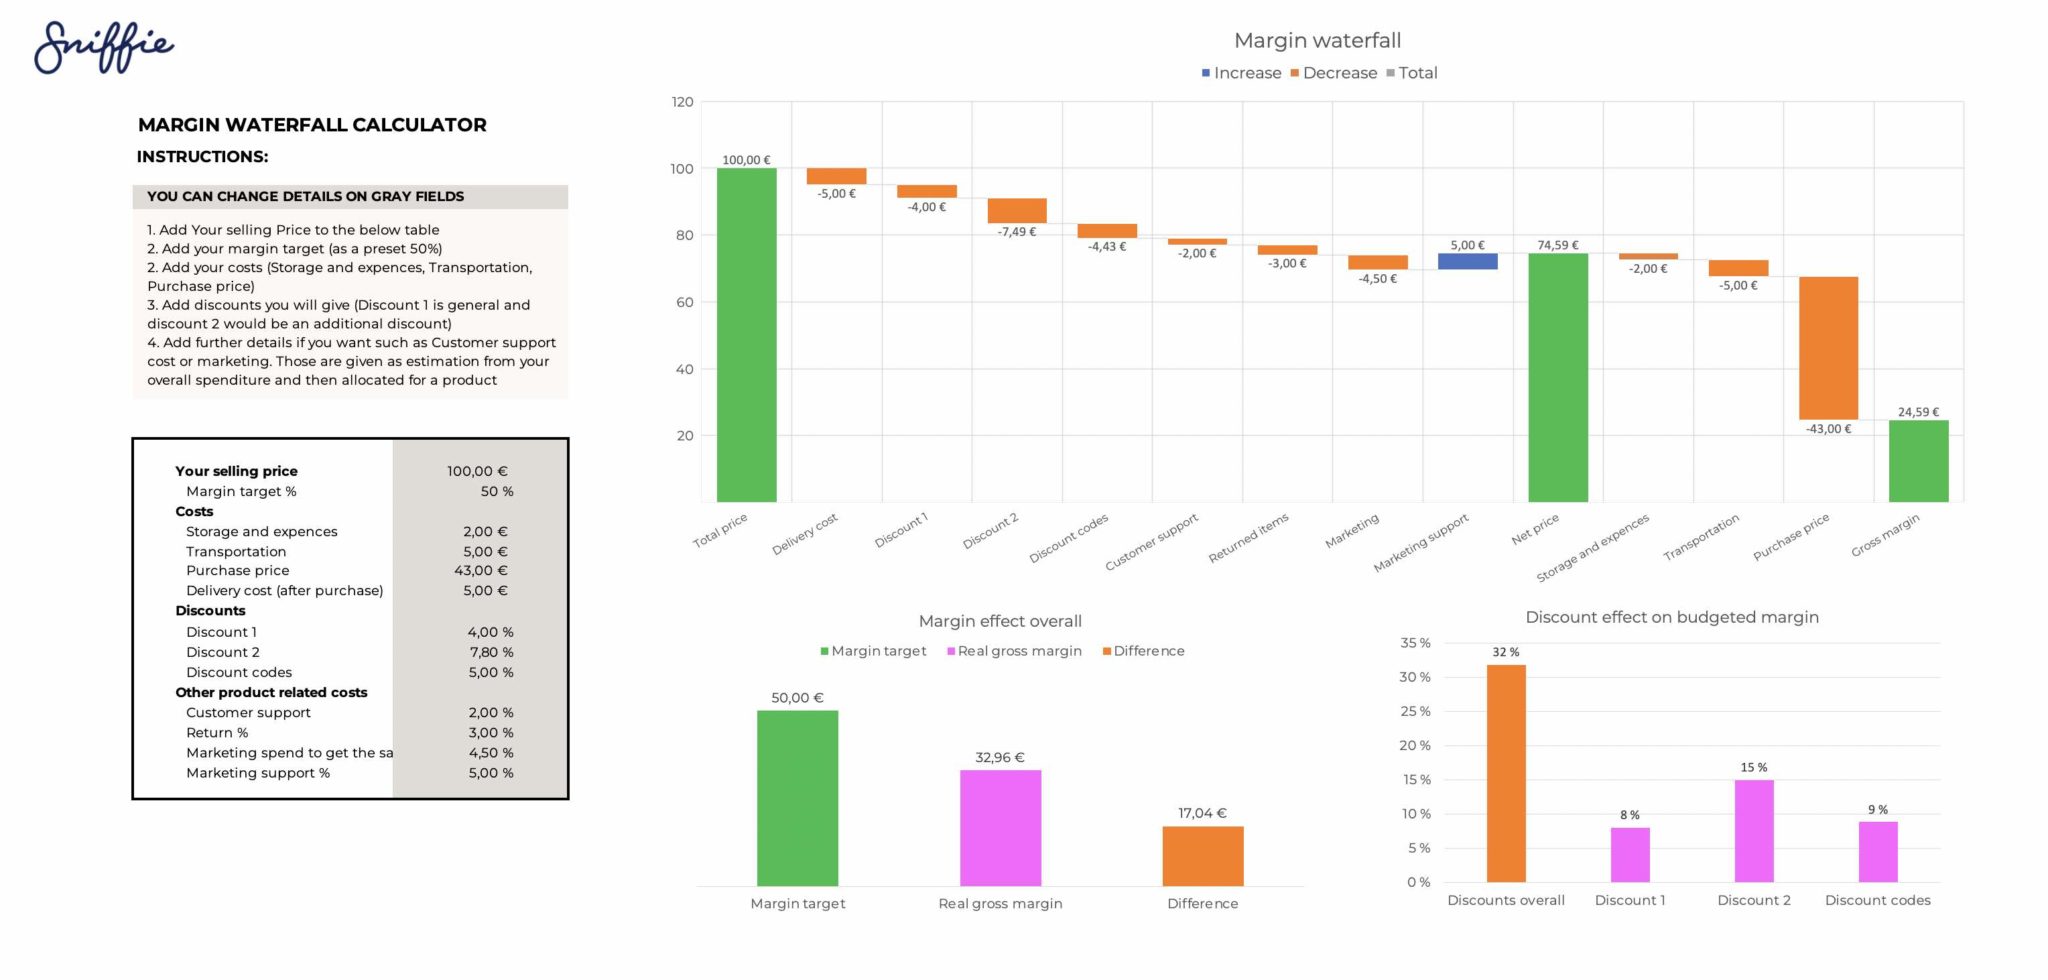
Create a table with variables such as “Price Change (%)” and “Cost Increase (%)”. Use the OFFSET function to dynamically adjust calculations based on these variables. Then, enable Solver to find optimal price points that maximize margin while keeping volume stable.
Step 6 – Protect and Document
Lock cells that contain formulas to prevent accidental edits. Add a documentation sheet that explains each column, assumptions, and data sources. This is especially useful for Asian businesses where transparency to auditors is paramount.
Real‑World Applications: From Taiwan to Thailand
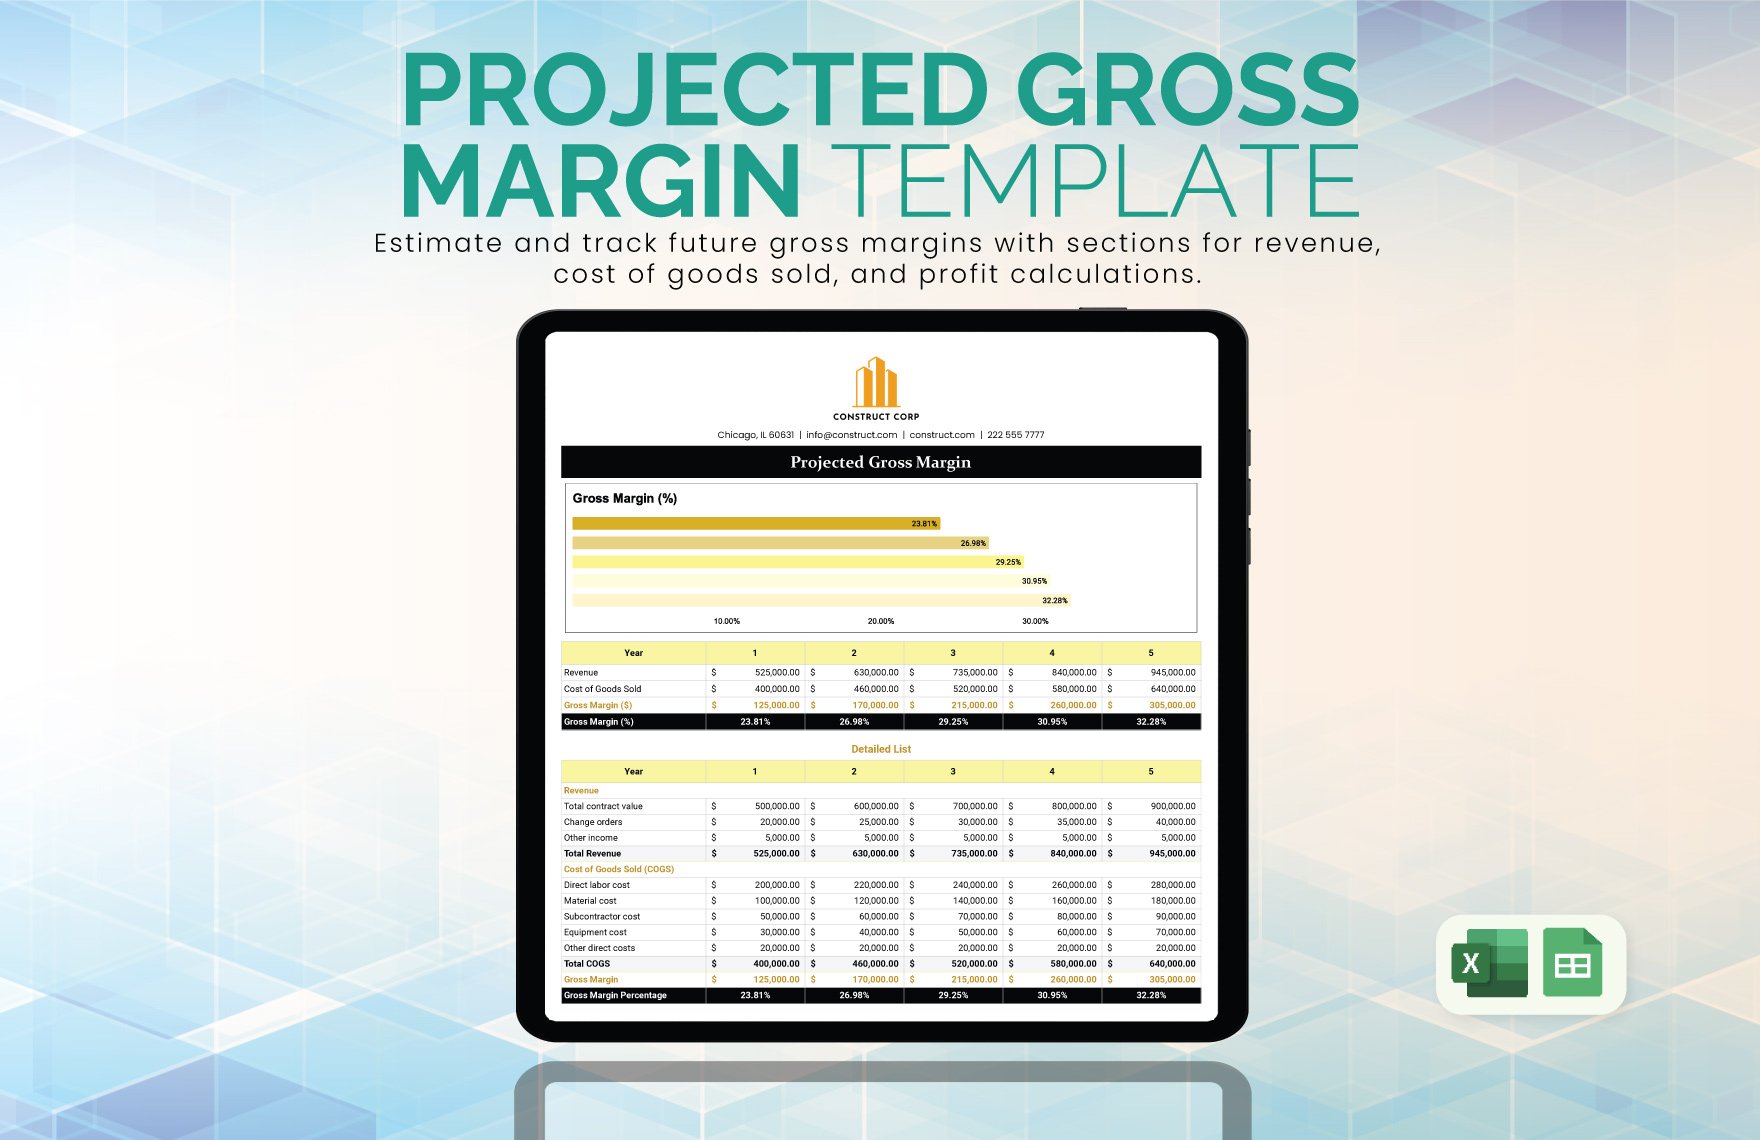
Let’s explore two scenarios where a gross margin Excel template played a pivotal role.
Case Study 1 – A Taiwanese Electronics Manufacturer
Company X produces consumer electronics for global brands. By implementing a gross margin template, they discovered that a new chip supplier’s pricing, while slightly higher, reduced assembly time by 15%. The template highlighted that the marginal increase in COGS was offset by improved labor efficiency, resulting in a net 2% margin uplift. The decision was made to shift 30% of production to this supplier, increasing overall profitability.
Case Study 2 – A Thai Food Exporter
Company Y exports canned fruits. Their margin was stagnating due to rising transportation costs. Using scenario analysis, they tested alternative packaging sizes to reduce shipping weight. The template projected a 1.5% margin improvement, and after piloting the new packaging, they achieved a 3% increase in net profit while maintaining customer satisfaction.
Common Pitfalls and How to Avoid Them
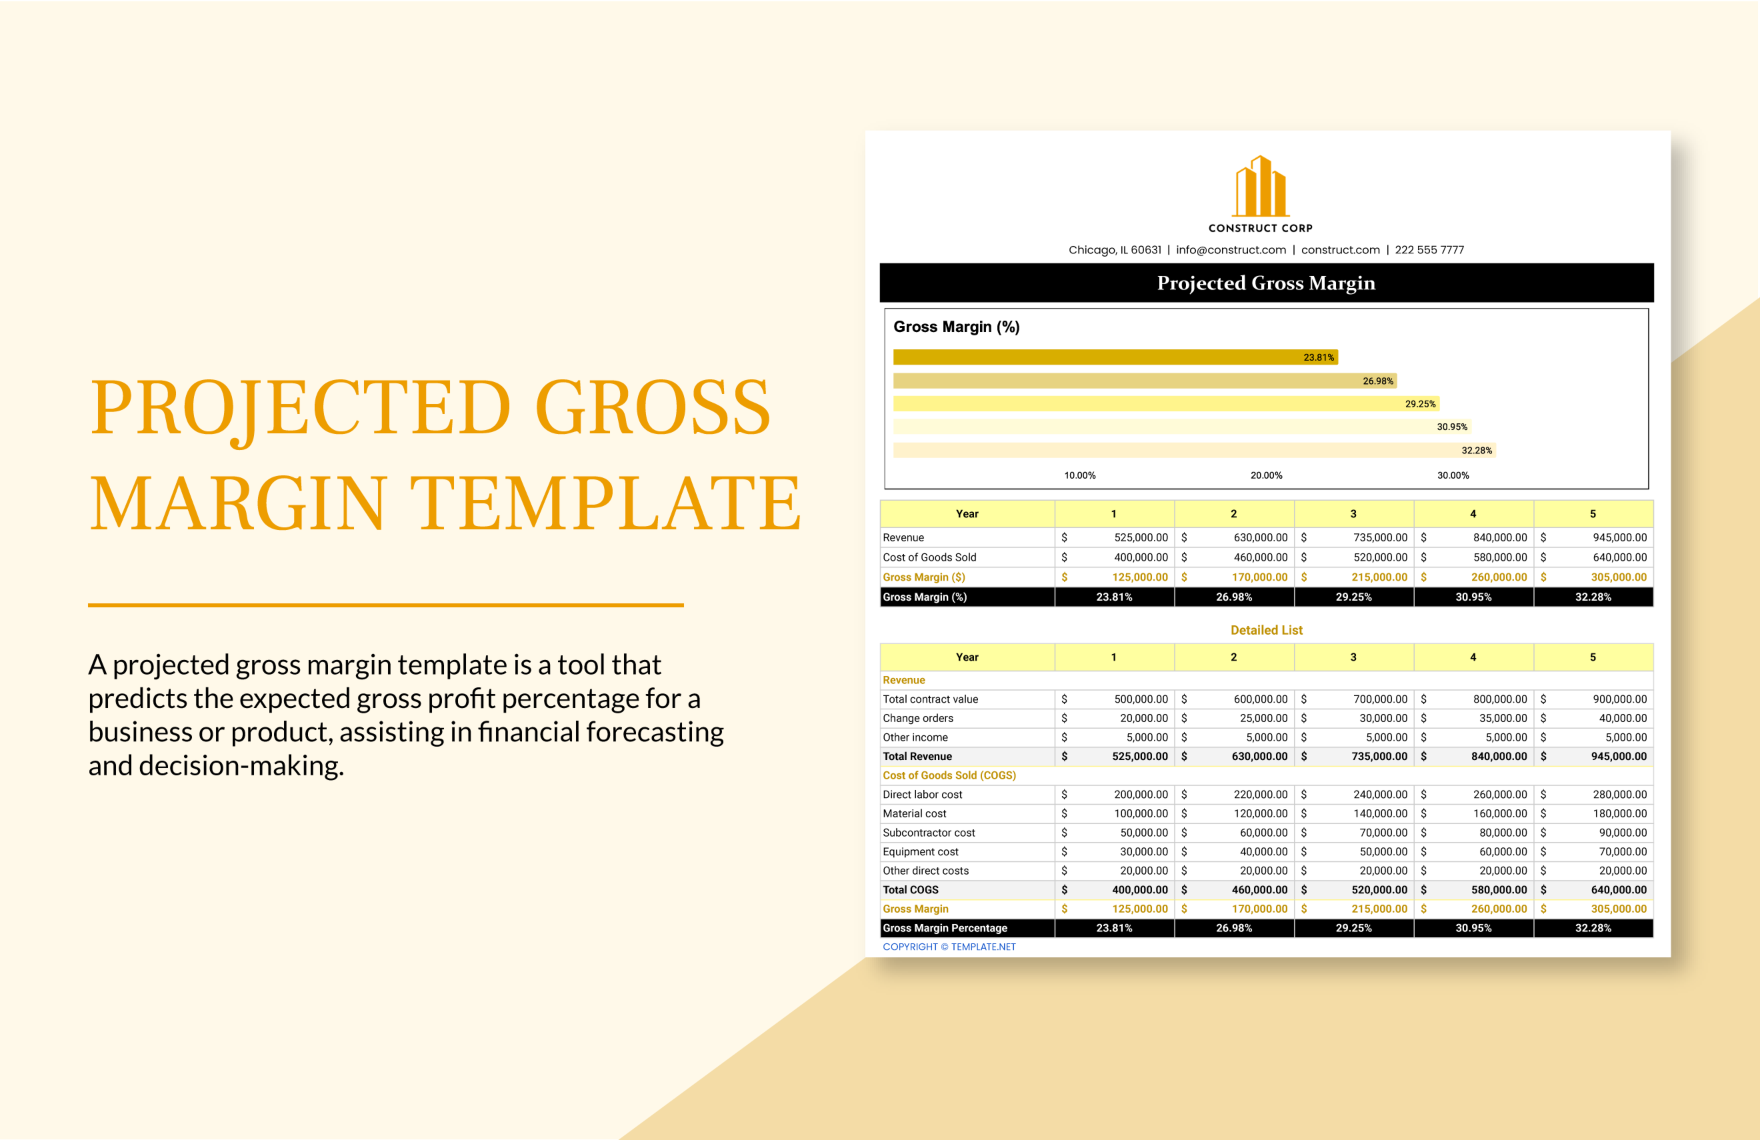
Data Inconsistency
Manually inputting prices or quantities often leads to errors. Mitigate by using dropdown lists and standardizing units across the organization.
Neglecting Indirect Costs
Focusing only on direct COGS can overstate gross margin. Integrate prorated overheads, such as electricity and rent, into the template for a more realistic figure.
Over‑Complexity
While it may be tempting to embed every possible calculation, a cluttered sheet hampers usability. Prioritize key metrics and keep advanced calculations in separate tabs.
Tips for Continuous Improvement
Regular Review Cycles
Set a monthly or quarterly review schedule. Use the dashboard to compare actual margins against targets and identify trends.
Benchmarking Against Industry Standards
Gather public data from competitors or industry associations. Compare your gross margin percentage to sector averages to gauge performance.
Incorporate Machine Learning
For large enterprises, integrate Excel with Python scripts via xlwings or Power Query to perform predictive analytics on margin drivers.
Integrating the Template into Your Business Workflow
Data Import Automation
Link the template to your ERP system using Power Query. This pulls daily sales and cost data automatically, reducing manual entry and improving accuracy.
Training Your Team
Conduct workshops that explain each sheet’s purpose, data entry standards, and how to interpret the dashboard. Encourage a culture where every employee understands margin implications.
Governance and Audit Readiness
Maintain a version control log. Document changes in formulas or data sources to satisfy auditors, especially in Asian markets where compliance standards are stringent.
Future-Proofing Your Gross Margin Analysis

As businesses evolve, so do cost structures. Future‑proofing involves:
- Adding modules for sustainability metrics, such as carbon cost per unit.
- Incorporating currency conversion tables to handle multi‑currency sales.
- Setting up alerts for margin dips triggered by external factors like tariff changes.
Conclusion: The Strategic Edge of a Well‑Designed Gross Margin Template
A Gross Margin Analysis Excel Template is more than a spreadsheet—it is a strategic instrument that translates raw numbers into business decisions. By structuring data entry, automated calculations, dashboards, and scenario planning into one coherent tool, Asian enterprises can maintain control over profit margins, respond swiftly to market dynamics, and foster a culture of data‑driven growth. Whether you run a boutique craft shop in Kyoto or a sprawling manufacturing hub in Manila, adopting a disciplined approach to gross margin analysis will sharpen competitiveness, enhance transparency, and ultimately drive sustainable profitability.


Related posts of "Gross Margin Analysis Excel Template"
