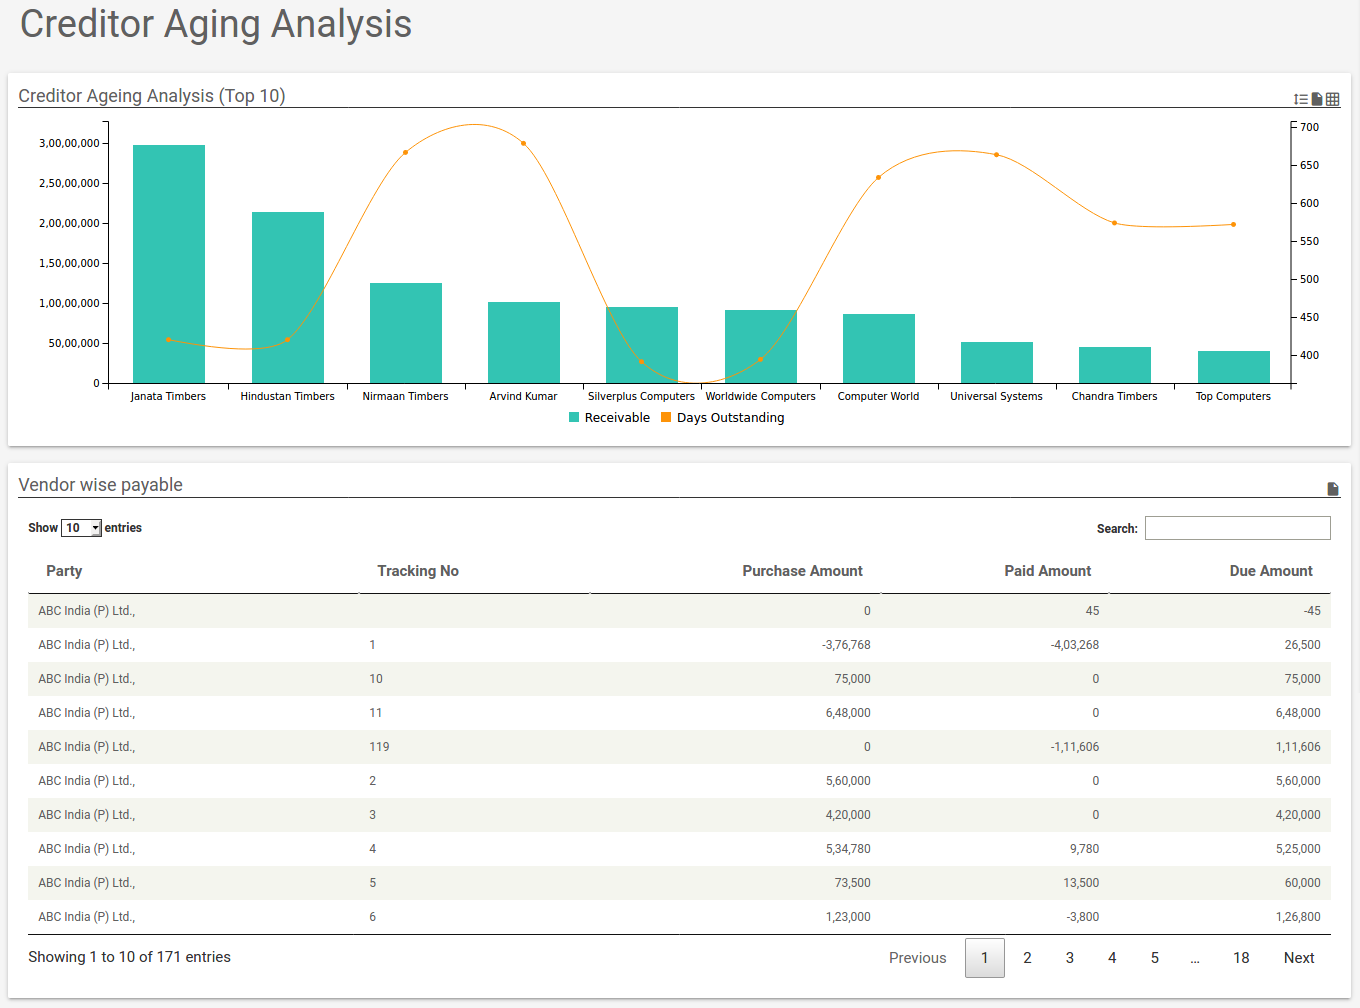
Creditors Age Analysis Excel Template is a powerful tool that can transform how a business manages its payable obligations, turning a chaotic ledger into a clear, actionable roadmap. By capturing supplier balances, payment terms, and aging buckets in a single, dynamic workbook, finance teams can quickly identify bottlenecks, negotiate better terms, and maintain healthy relationships with vendors—all while safeguarding cash flow.
Why a Creditors Age Analysis Matters for Your Bottom Line

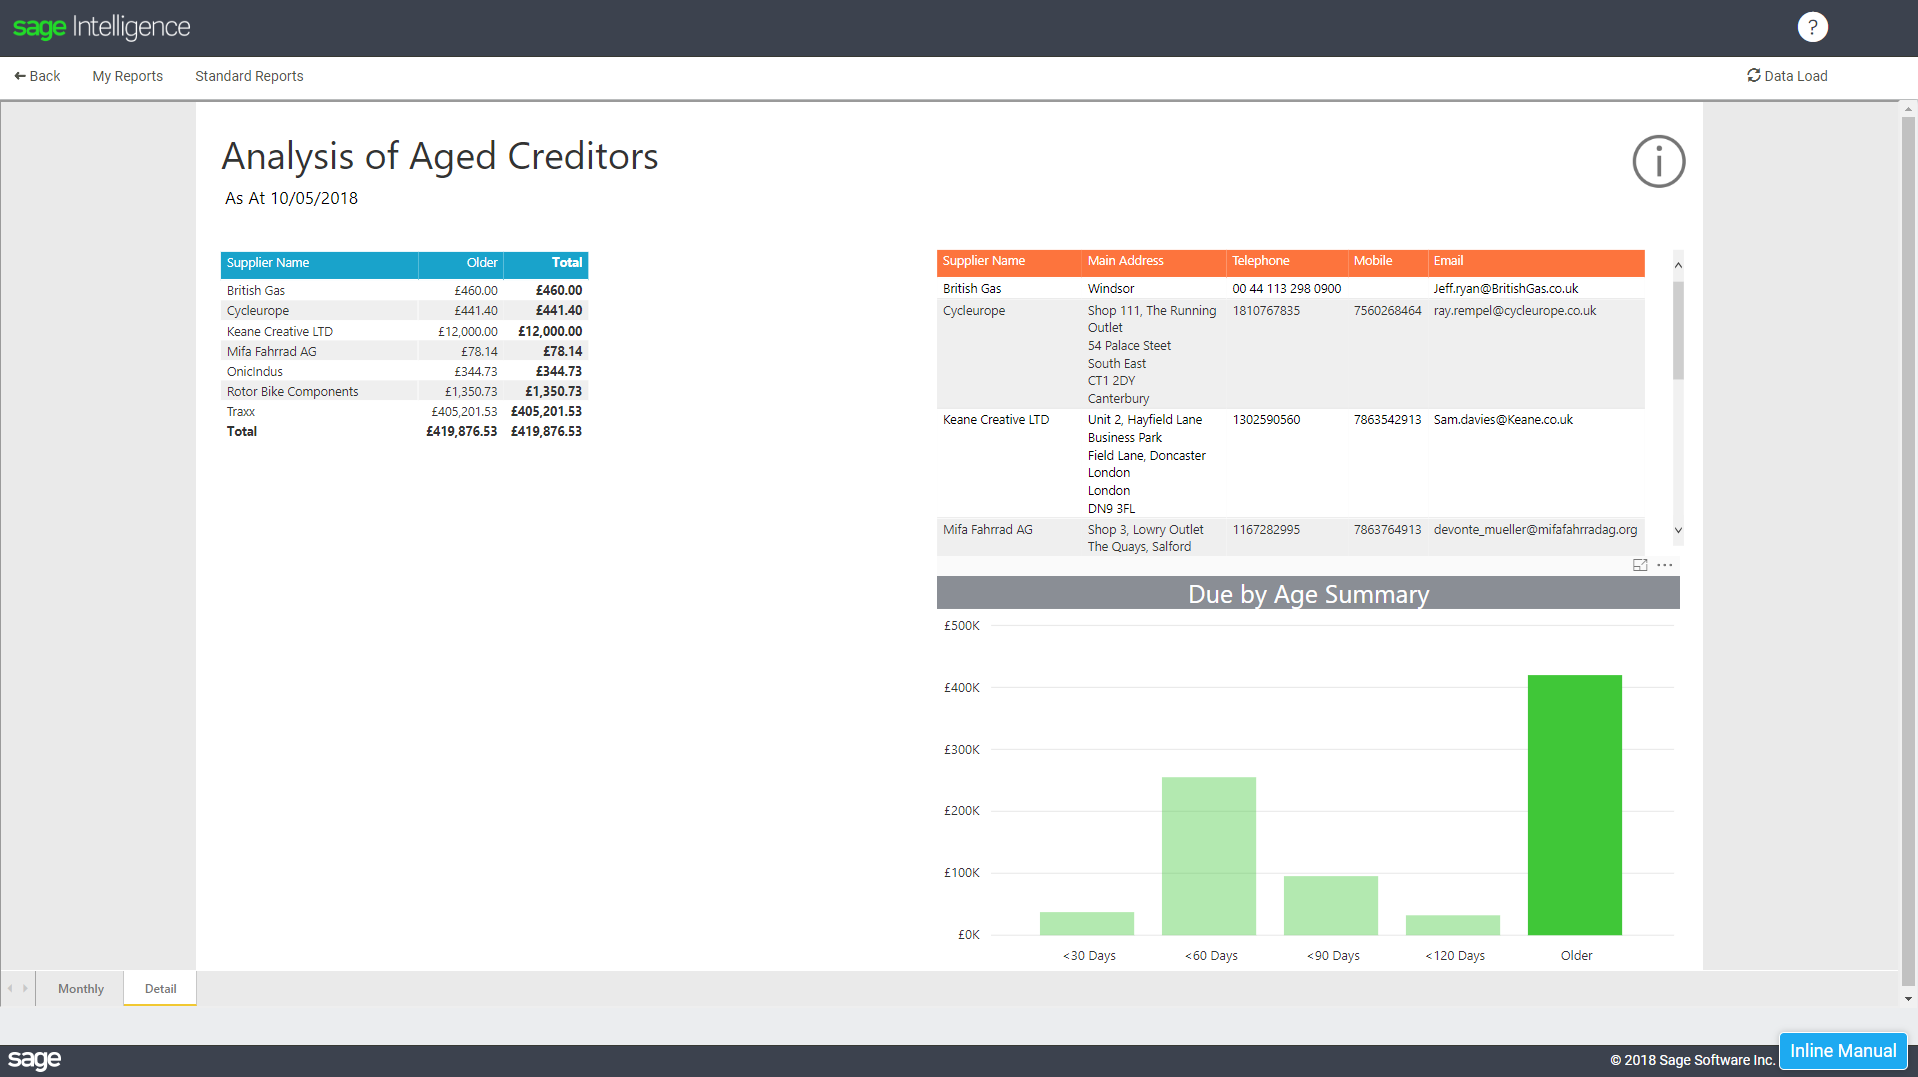
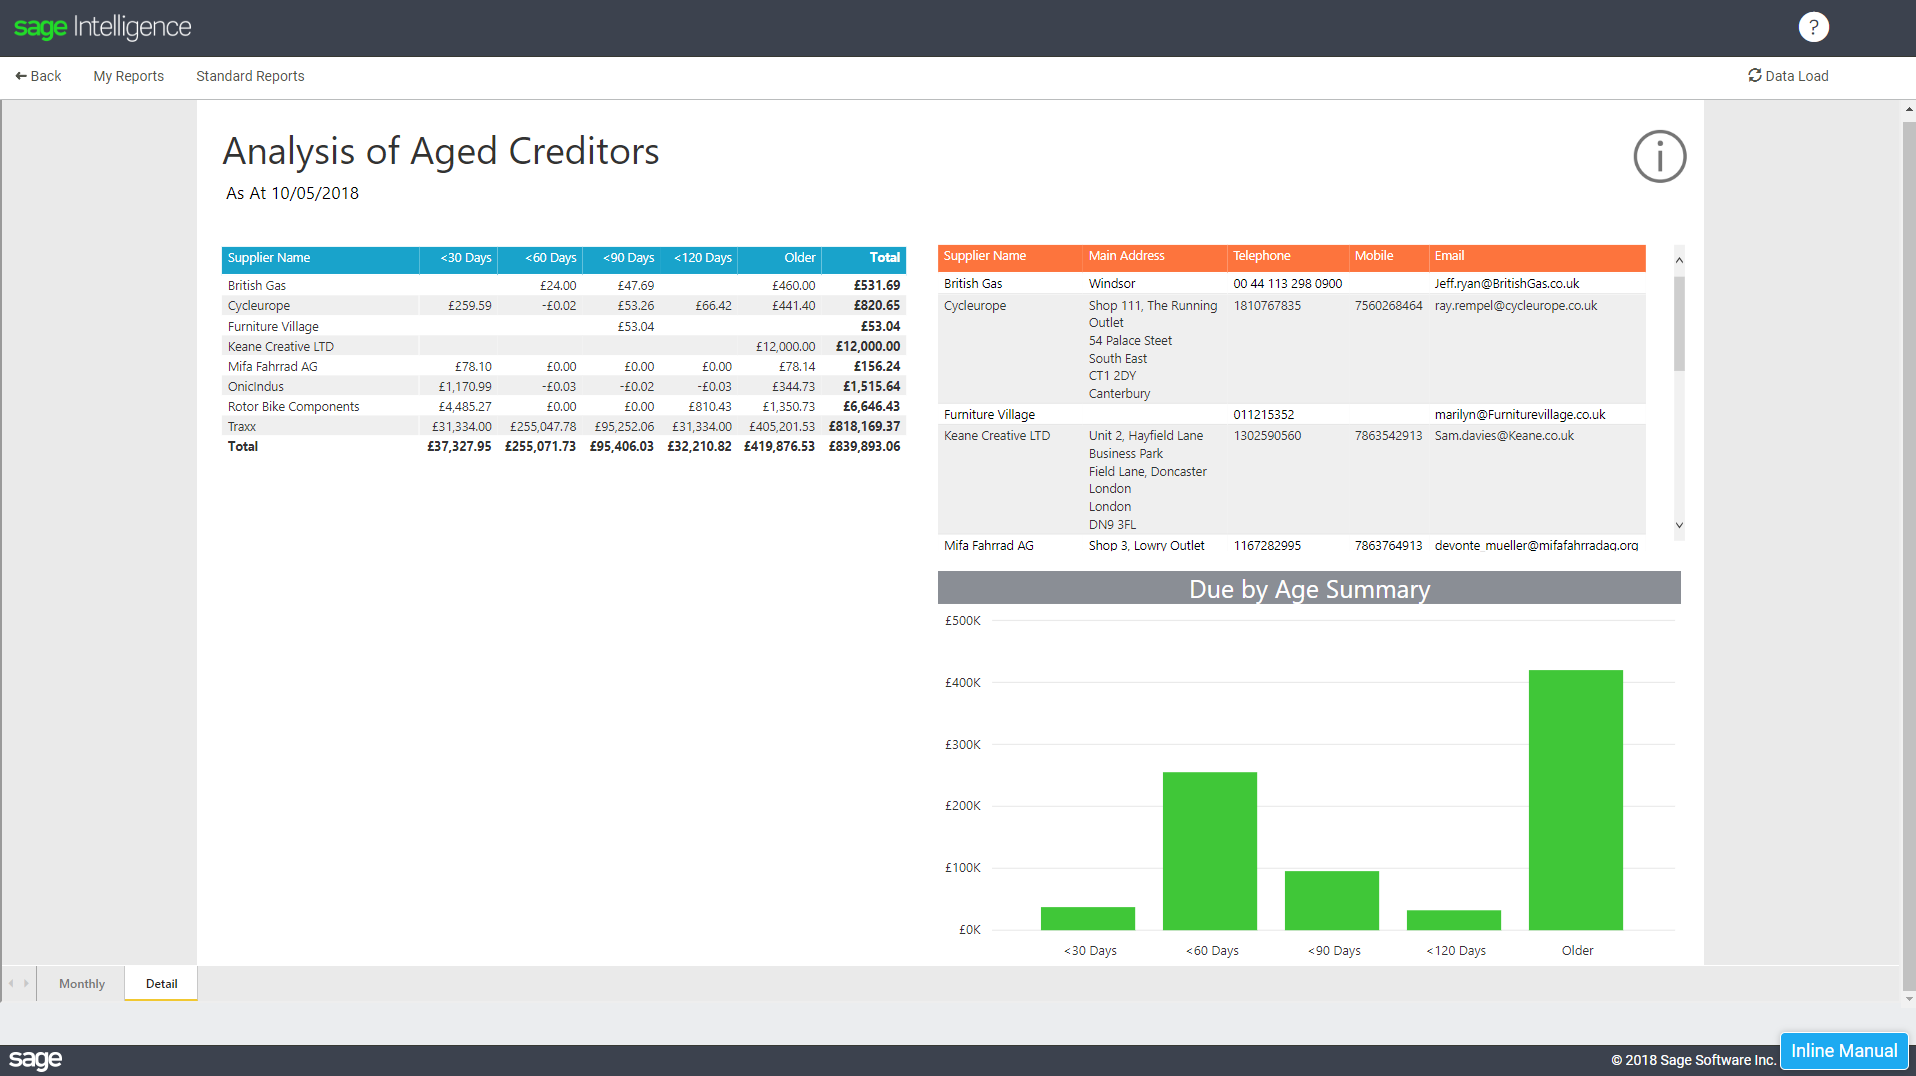
When suppliers wait too long for payment, a company can lose critical discounts, face strained negotiations, or risk losing future supply. Conversely, paying too early ties up working capital that could fund growth opportunities. The Creditors Age Analysis Excel Template bridges this gap by offering a visual representation of outstanding balances, segmented by age categories. Managers can instantly see which suppliers need attention and which are within agreed terms, ensuring that payments are optimized without compromising supplier relationships.
Three Core Benefits
- Cash Flow Visibility: Knowing how much is due in 30, 60, or 90 days helps forecast cash requirements and avoid liquidity crunches.
- Negotiation Power: A clear aging report demonstrates payment discipline, strengthening leverage when negotiating extended credit or volume discounts.
- Risk Management: Highlighting overdue accounts alerts teams to potential supplier issues or internal process failures.
Key Components Every Template Should Include

While templates can vary, a robust Creditors Age Analysis Excel Template should encompass the following elements:
Supplier Identification
- Supplier Name or ID
- Contact Person and Department
- Primary Contact Email & Phone
Invoice Details
- Invoice Number
- Invoice Date
- Due Date
- Invoice Amount
- Currency (if multinational)
Aging Buckets
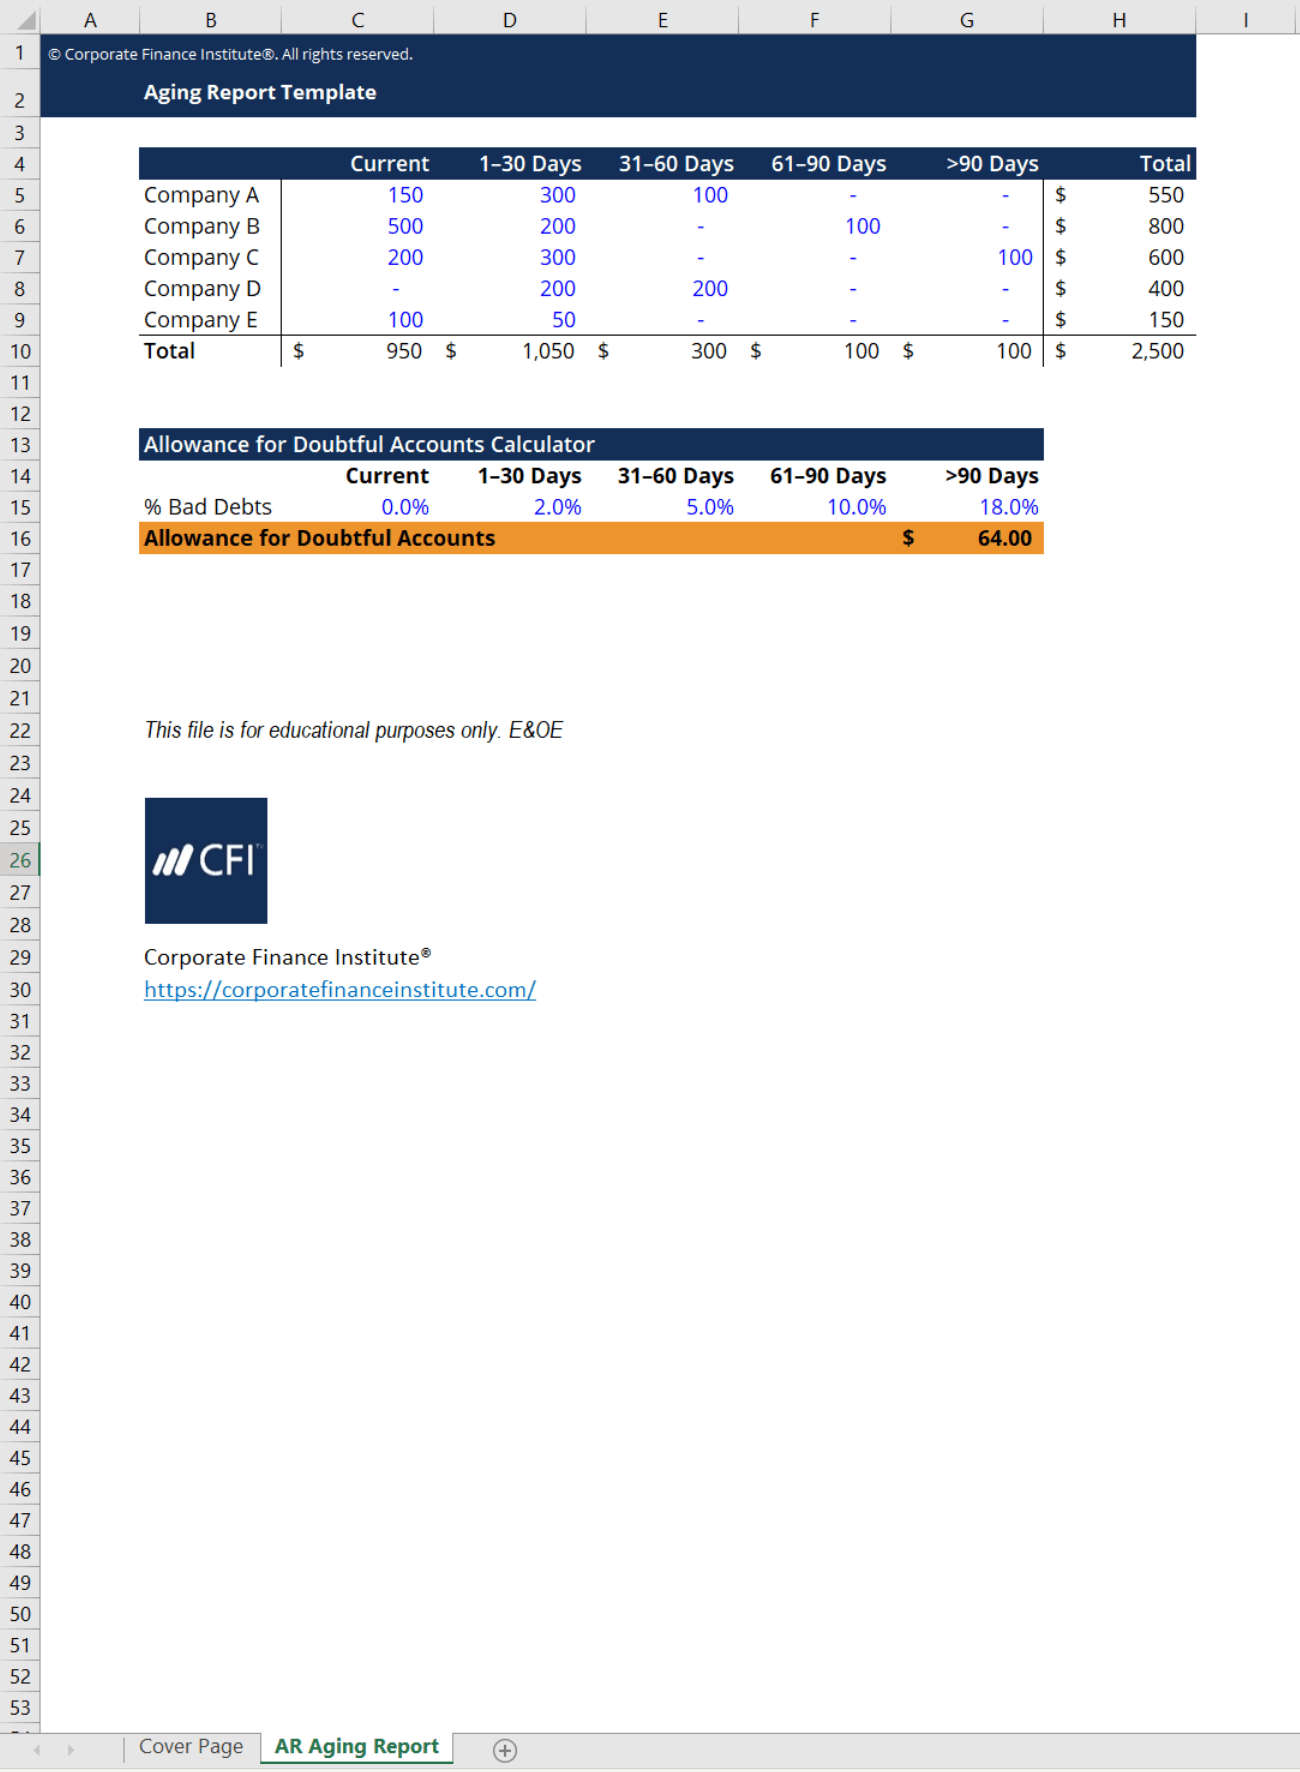
Common buckets include 0-30, 31-60, 61-90, and >90 days. Adjust thresholds to match your company’s payment terms.
Discount and Payment Terms
- Early payment discount (e.g., 2% 10/30)
- Net terms (e.g., Net 30)
- Penalty rates for late payments
Calculated Fields
Using built-in Excel formulas, automatically populate:
- Days Outstanding: =TODAY()-InvoiceDate
- Bucket Allocation: IF statements to place invoices into appropriate aging columns.
- Total Aging: SUM of each bucket per supplier.
Visual Summaries
Include conditional formatting to highlight overdue amounts, charts for trend analysis, and a dashboard that aggregates key metrics such as Total Payables, Average Days Payable Outstanding (DPO), and % of invoices eligible for discount.
Step-by-Step Guide to Building Your Own Template

Below is a detailed, actionable workflow that will take you from blank sheet to a fully functional Creditors Age Analysis Excel Template.
Step 1: Define Your Data Structure
Open a new workbook and label the first sheet “Data.” Create a header row with the fields outlined above. Use “Data Validation” to create drop-down lists for Supplier Name and Invoice Number to maintain consistency.
Step 2: Import or Enter Invoice Data
Either manually input invoices or import a CSV file from your accounting system. Ensure that dates are in a uniform format and that all monetary values are entered as numbers, not text.
Step 3: Create Aging Calculations
In a new column “Days Outstanding,” use the formula =TODAY()-[Invoice Date]. Copy this across all rows. In the next set of columns—30, 60, 90, >90—apply IF statements: =IF([Days Outstanding]<=30, [Invoice Amount], 0), and adjust accordingly for each bucket.
Step 4: Summarize by Supplier
Use a pivot table: Rows as Supplier Name, Values as Sum of each aging bucket. Position this pivot on a separate sheet called “Summary.” This allows dynamic updates as new invoices are added.
Step 5: Add Conditional Formatting
Highlight overdue buckets (e.g., >90 days) in red, eligible discount buckets in green. This visual cue instantly alerts staff to priority areas.
Step 6: Build a Dashboard
Create charts that display total payables by bucket, and a KPI table showing Total Payables, DPO, and % of invoices within discount period. Use slicers linked to the pivot table for interactive filtering.
Step 7: Automate Updates
Set the workbook to refresh data upon opening by enabling “Refresh All” in the Data tab. Store the template in a shared location (e.g., SharePoint or a cloud folder) to ensure all team members access the latest version.
Customizing the Template for Different Industries

While the core structure remains consistent, certain sectors require adjustments. Below are tailored suggestions for three common scenarios.
Retail and Wholesale
Retail chains often have multiple suppliers for varied product lines. Add a “Product Category” column to track aging by category, enabling inventory managers to coordinate restocking with payment schedules.
Manufacturing
Manufacturers may rely on just-in-time deliveries. Incorporate a “Lead Time” field, and use it to cross-check whether delayed invoices could impact production timelines.
Services and Consulting
Services may involve long-term contracts. Include a “Contract End Date” and calculate whether overdue payments are jeopardizing contract renewal.
Tips for Maintaining Data Accuracy
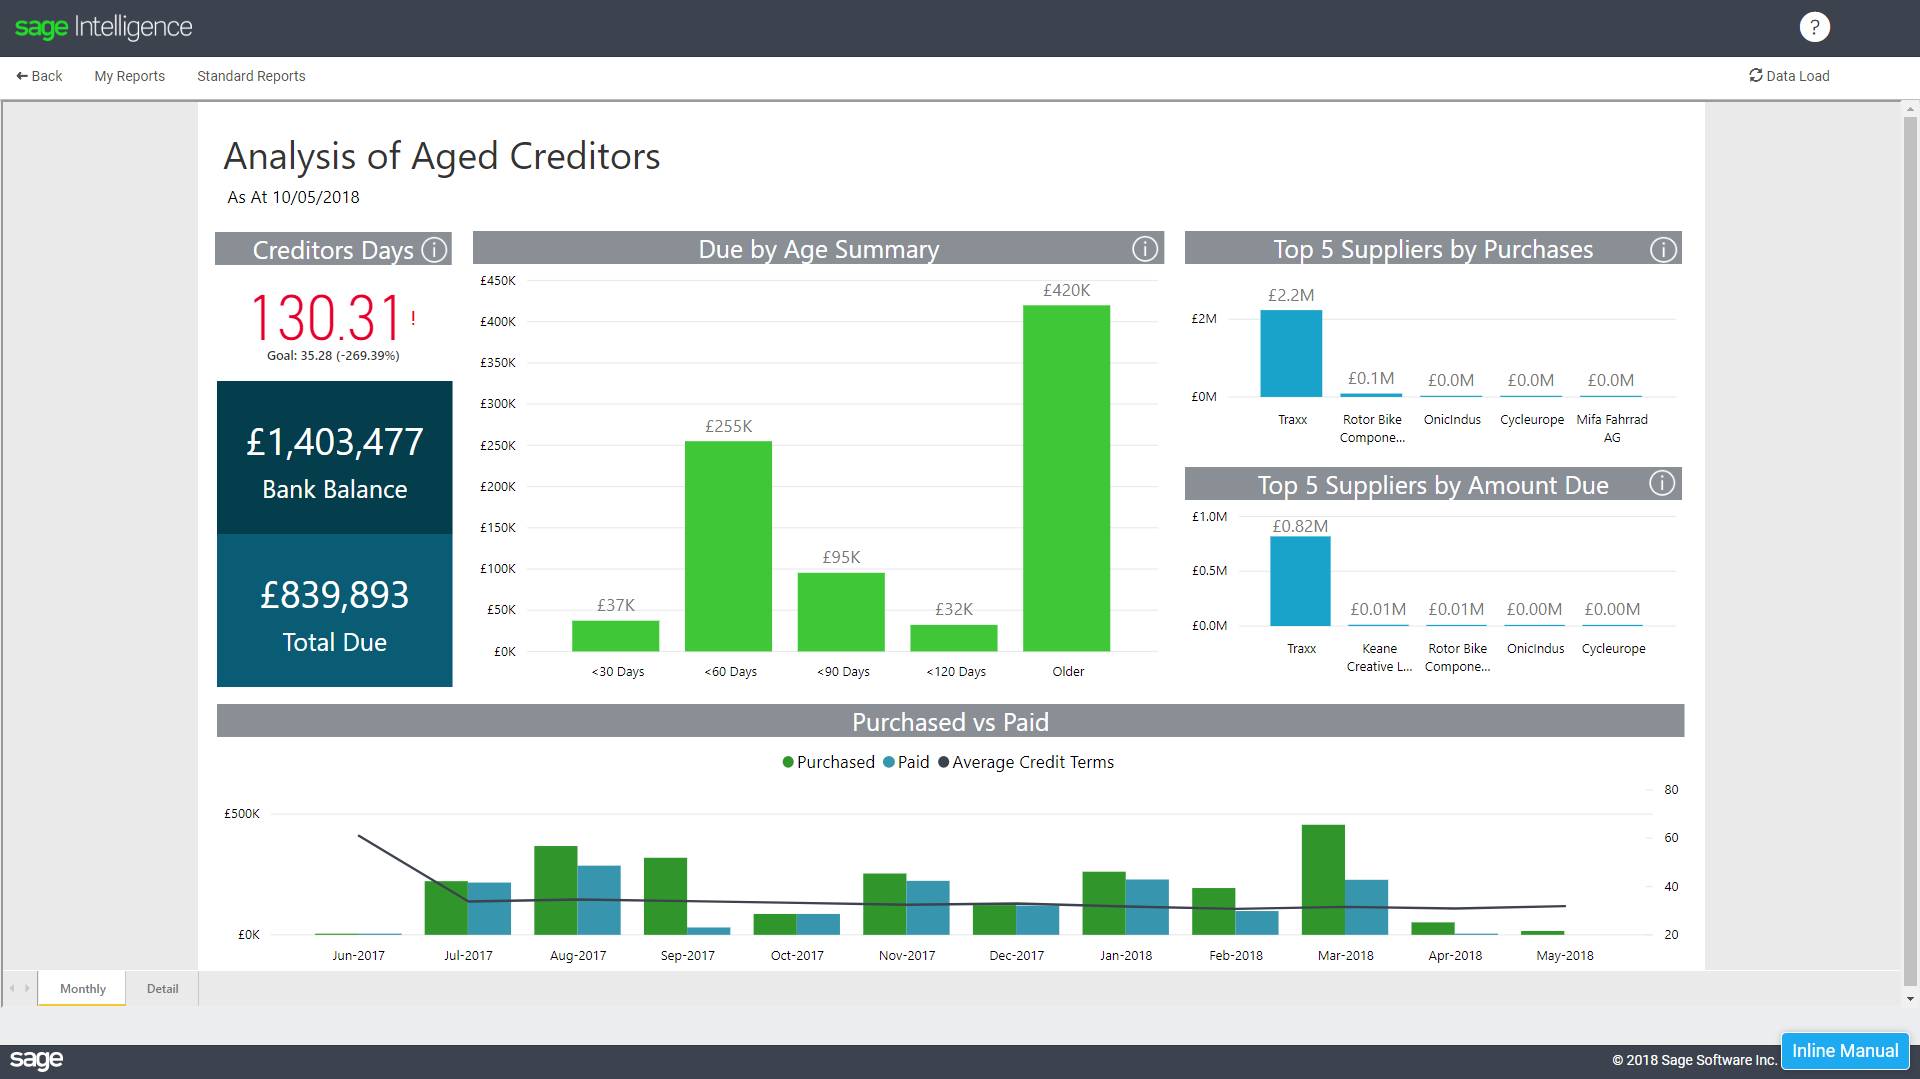
An Excel template is only as good as its data. Here are best practices to keep your Creditors Age Analysis reliable.
Automate Data Pulls
Integrate with your ERP or accounting software via ODBC or API to pull invoice records directly into Excel. This reduces manual entry errors.
Implement Change Log
Use a hidden “Audit” sheet that records every change with timestamp, user, and modified cell. This ensures traceability for compliance reviews.
Standardize Input Formats
Set data validation for dates and currency fields. Consistency in date format (dd/mm/yyyy) prevents misclassification in aging calculations.
Regular Reconciliation
Cross-verify the Excel totals against the general ledger monthly. Discrepancies should trigger a review of transaction entry or mapping errors.
Common Pitfalls and How to Avoid Them
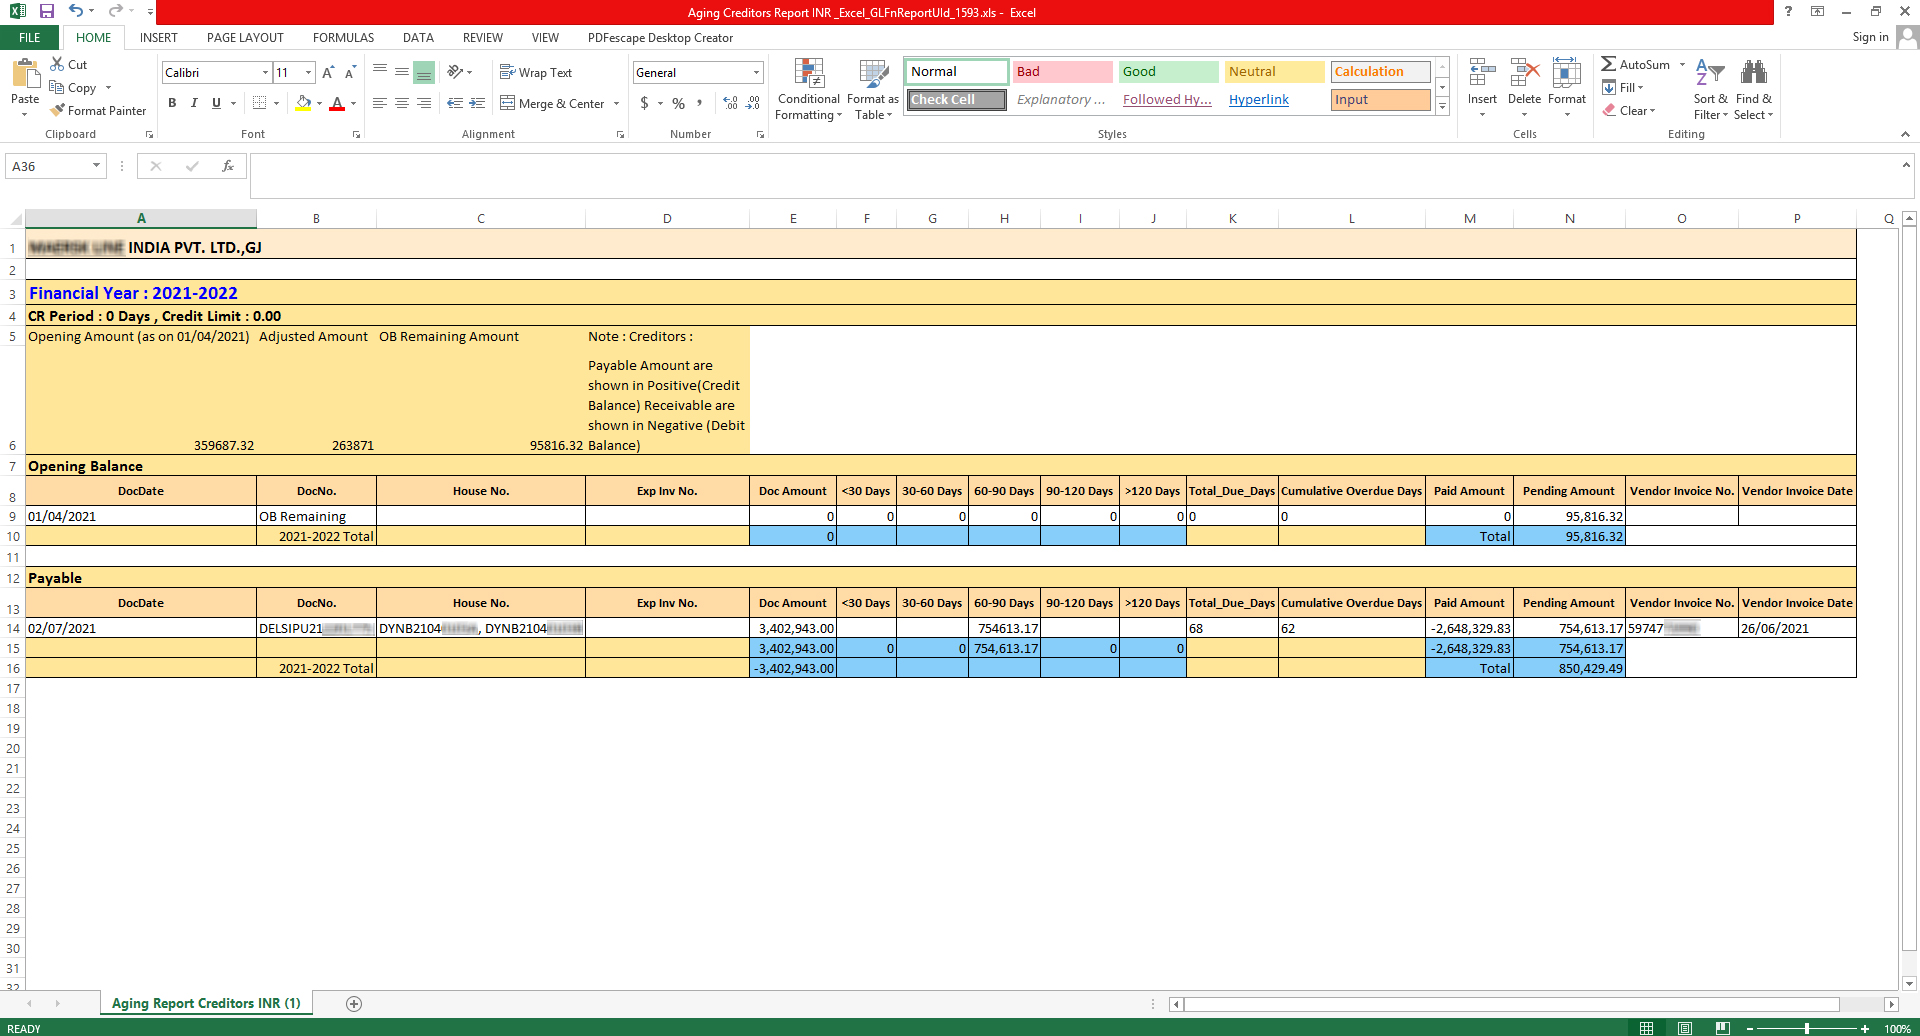
- Overlooking Invoice Adjustments: Credit memos or returned goods must be subtracted from the original invoice amount. Include an “Adjustment” column and incorporate it into the aging formula.
- Ignoring Multi-Currency Issues: If operating internationally, convert all amounts to a base currency using a consistent exchange rate column.
- Not Updating Payment Terms: Supplier agreements evolve. Keep a separate “Terms History” sheet and reference the most recent terms in calculations.
- Relying on Static Formulas: Use named ranges or table references to ensure formulas adapt to new rows automatically.
Leveraging the Template for Cash Flow Forecasting

Beyond monitoring current obligations, the Creditors Age Analysis Excel Template can forecast future cash needs. By projecting invoice inflows into each aging bucket for the next 90 days, finance teams can align payment schedules with projected cash inflows, reducing the reliance on short‑term borrowing.
Creating a Cash Flow Projection
- Copy the current “Summary” pivot into a new sheet “Forecast.”
- Add a “Projected Days Outstanding” column for each future period.
- Use the
FORECAST.ETSfunction to estimate future balances based on historical trends. - Overlay planned payment actions (e.g., early payment to secure discounts) to see their impact on the cash runway.
Integrating with Accounting Software

Many businesses already use ERP solutions like SAP, QuickBooks, or Xero. While these platforms provide built‑in reports, an Excel template offers deeper customization.
Exporting Data
Set up a scheduled export of the supplier ledger to a CSV file. Import this into Excel on a daily basis. Use Power Query to automate the import and clean the data.
Using VBA for Automation
Write a simple macro that triggers upon opening the workbook: it refreshes all queries, recalculates, and alerts users if any supplier has moved into the >90 bucket.
Syncing with Cloud Platforms
Store the workbook on a cloud service and use real‑time collaboration tools to allow multiple users to edit simultaneously while preserving version control.
Real-World Case Study: Turning Payables into Strategic Advantage

XYZ Manufacturing, a mid-sized producer of automotive components, struggled with cash flow due to delayed payments to suppliers. Their finance team adopted a Creditors Age Analysis Excel Template built on the steps above. Within three months, they achieved the following:
- Reduced average Days Payable Outstanding from 55 to 42 days.
- Secured a 1.5% early payment discount on 35% of invoices, saving $120,000 annually.
- Identified two suppliers consistently exceeding 90 days and renegotiated terms to 60 days, restoring their confidence and ensuring a steady supply chain.
- Integrated the template with QuickBooks, automating data pulls and cutting manual reconciliation time by 70%.
This case highlights how a well‑structured Creditors Age Analysis Excel Template can deliver tangible financial benefits while fostering stronger vendor relationships.
Conclusion
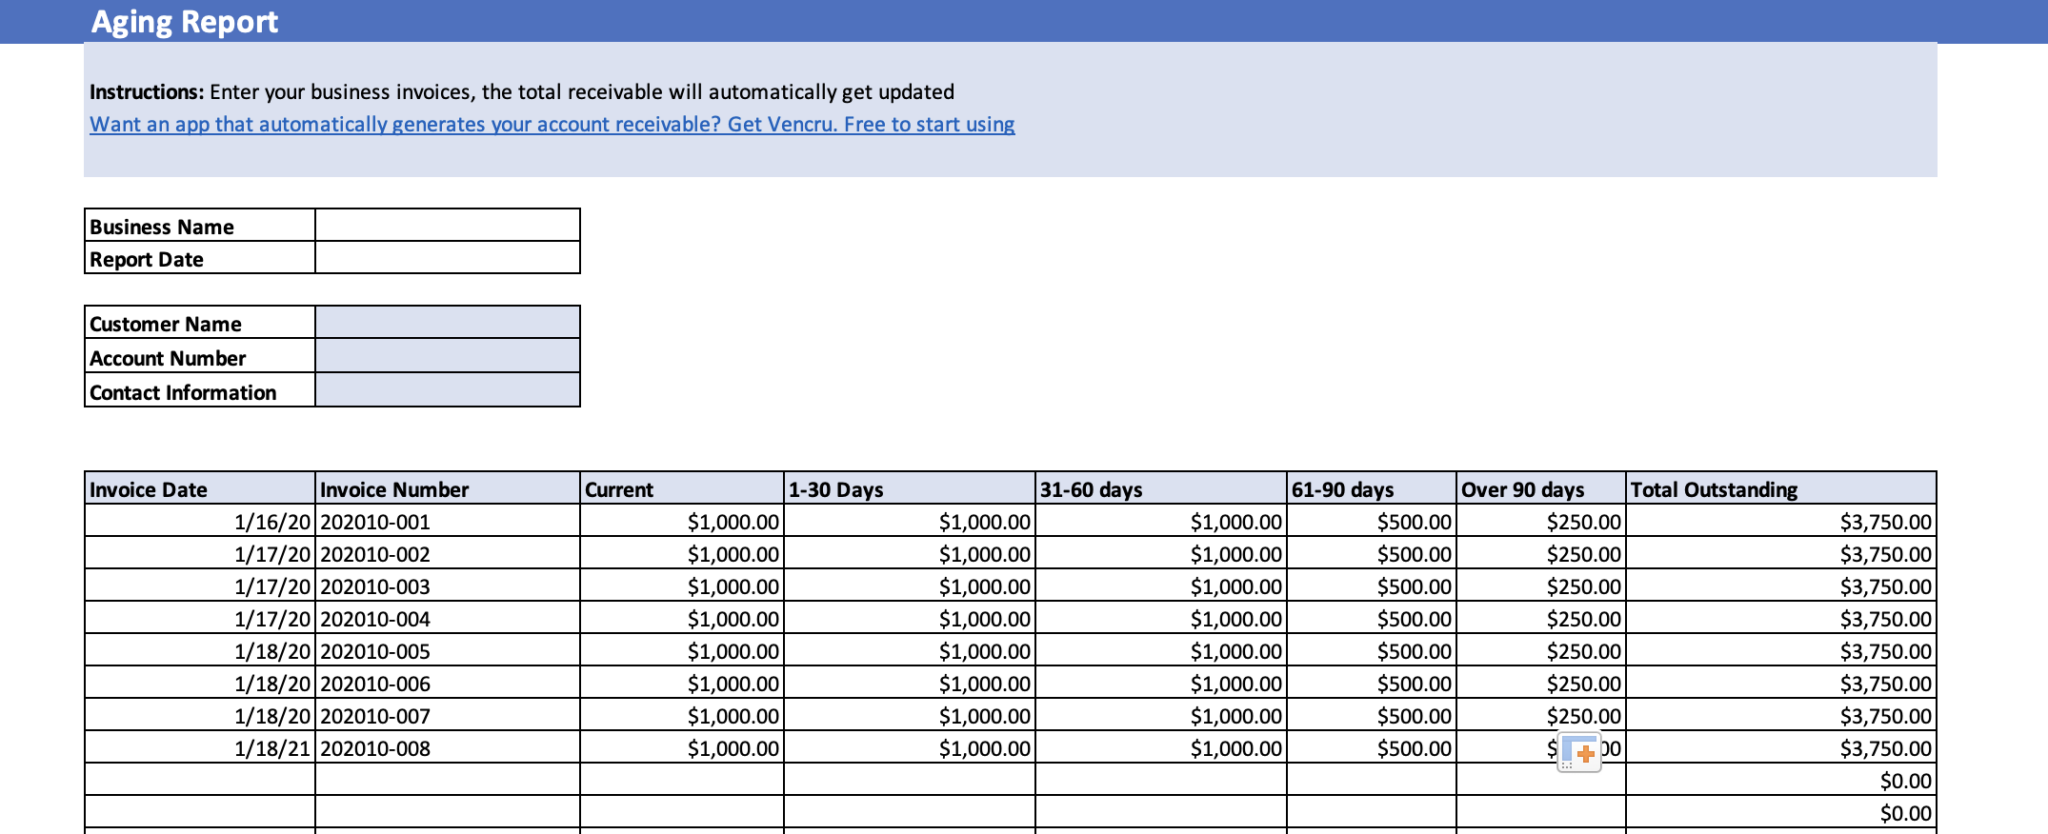
A robust Creditors Age Analysis Excel Template empowers businesses to transform payables from a burden into a strategic resource. By capturing supplier balances, applying precise aging logic, and visualizing key metrics, finance teams gain real‑time insight into cash flow, negotiate better terms, and avoid costly late payments. Whether you’re a small startup or a multinational corporation, following the step‑by‑step guide above ensures that your template is accurate, actionable, and aligned with your organization’s unique needs. With consistent updates and thoughtful customization, this tool becomes an indispensable part of any enterprise’s financial health arsenal.

Related posts of "Creditors Age Analysis Excel Template"
