
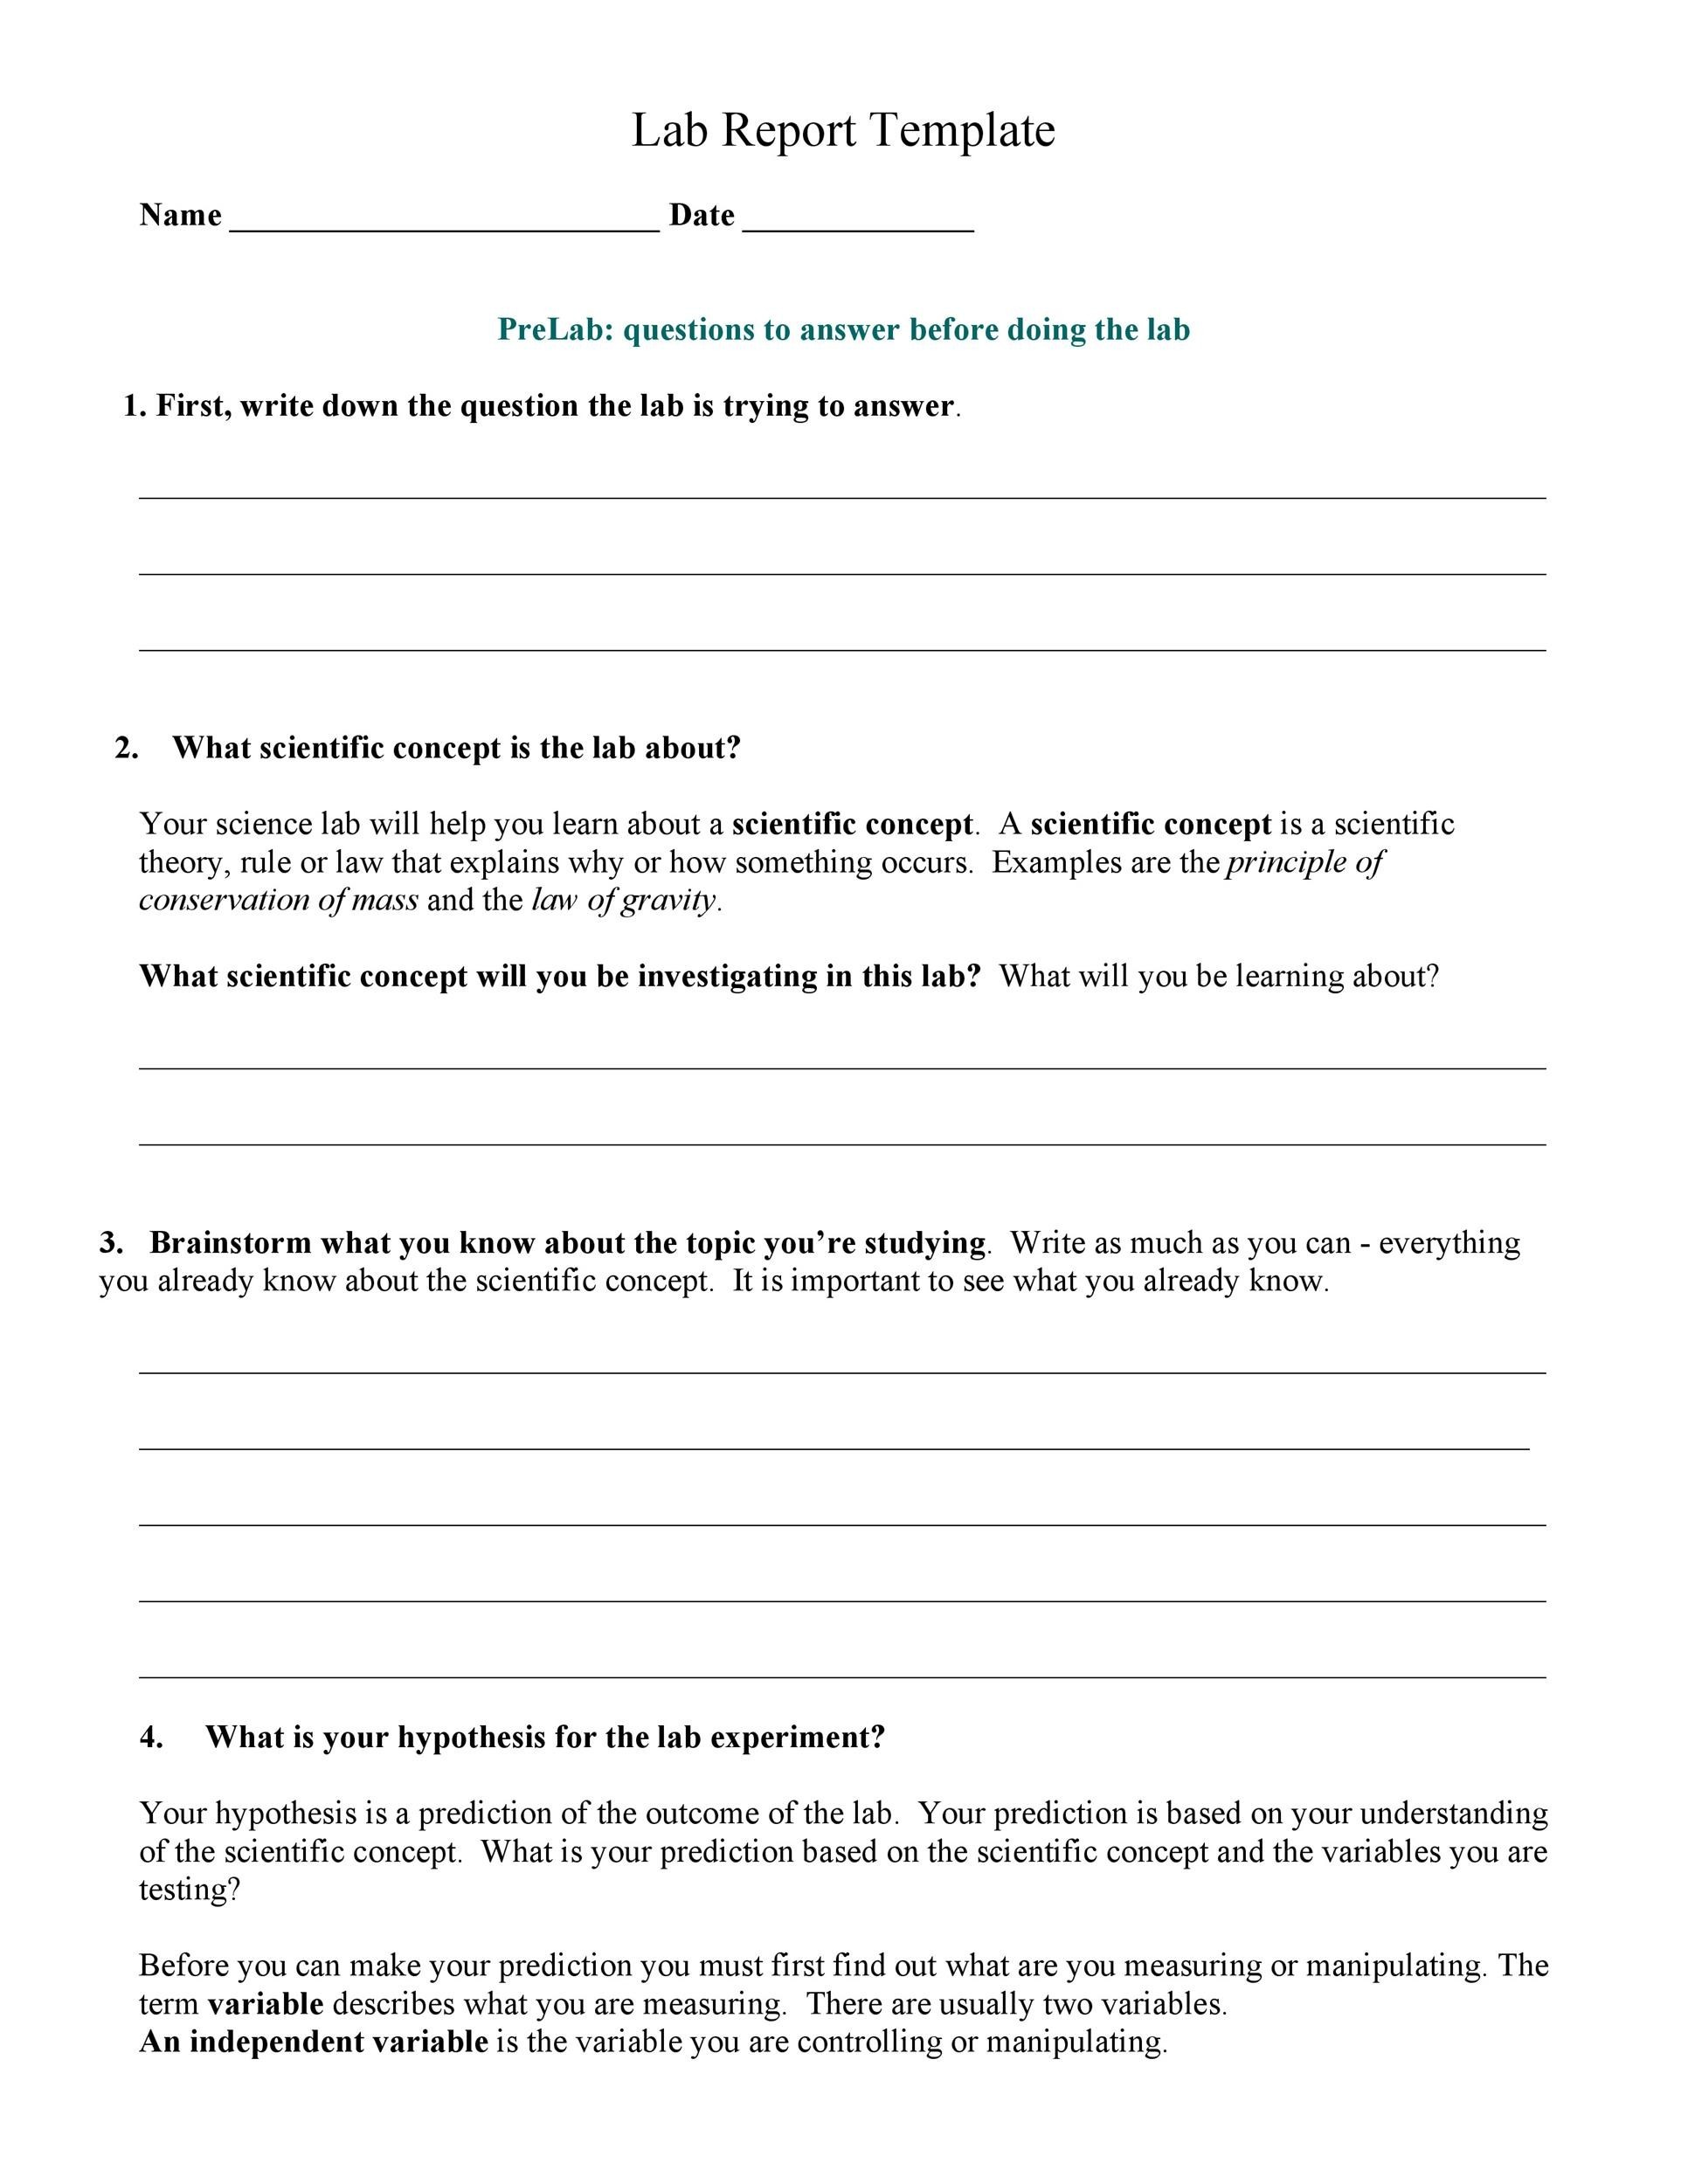
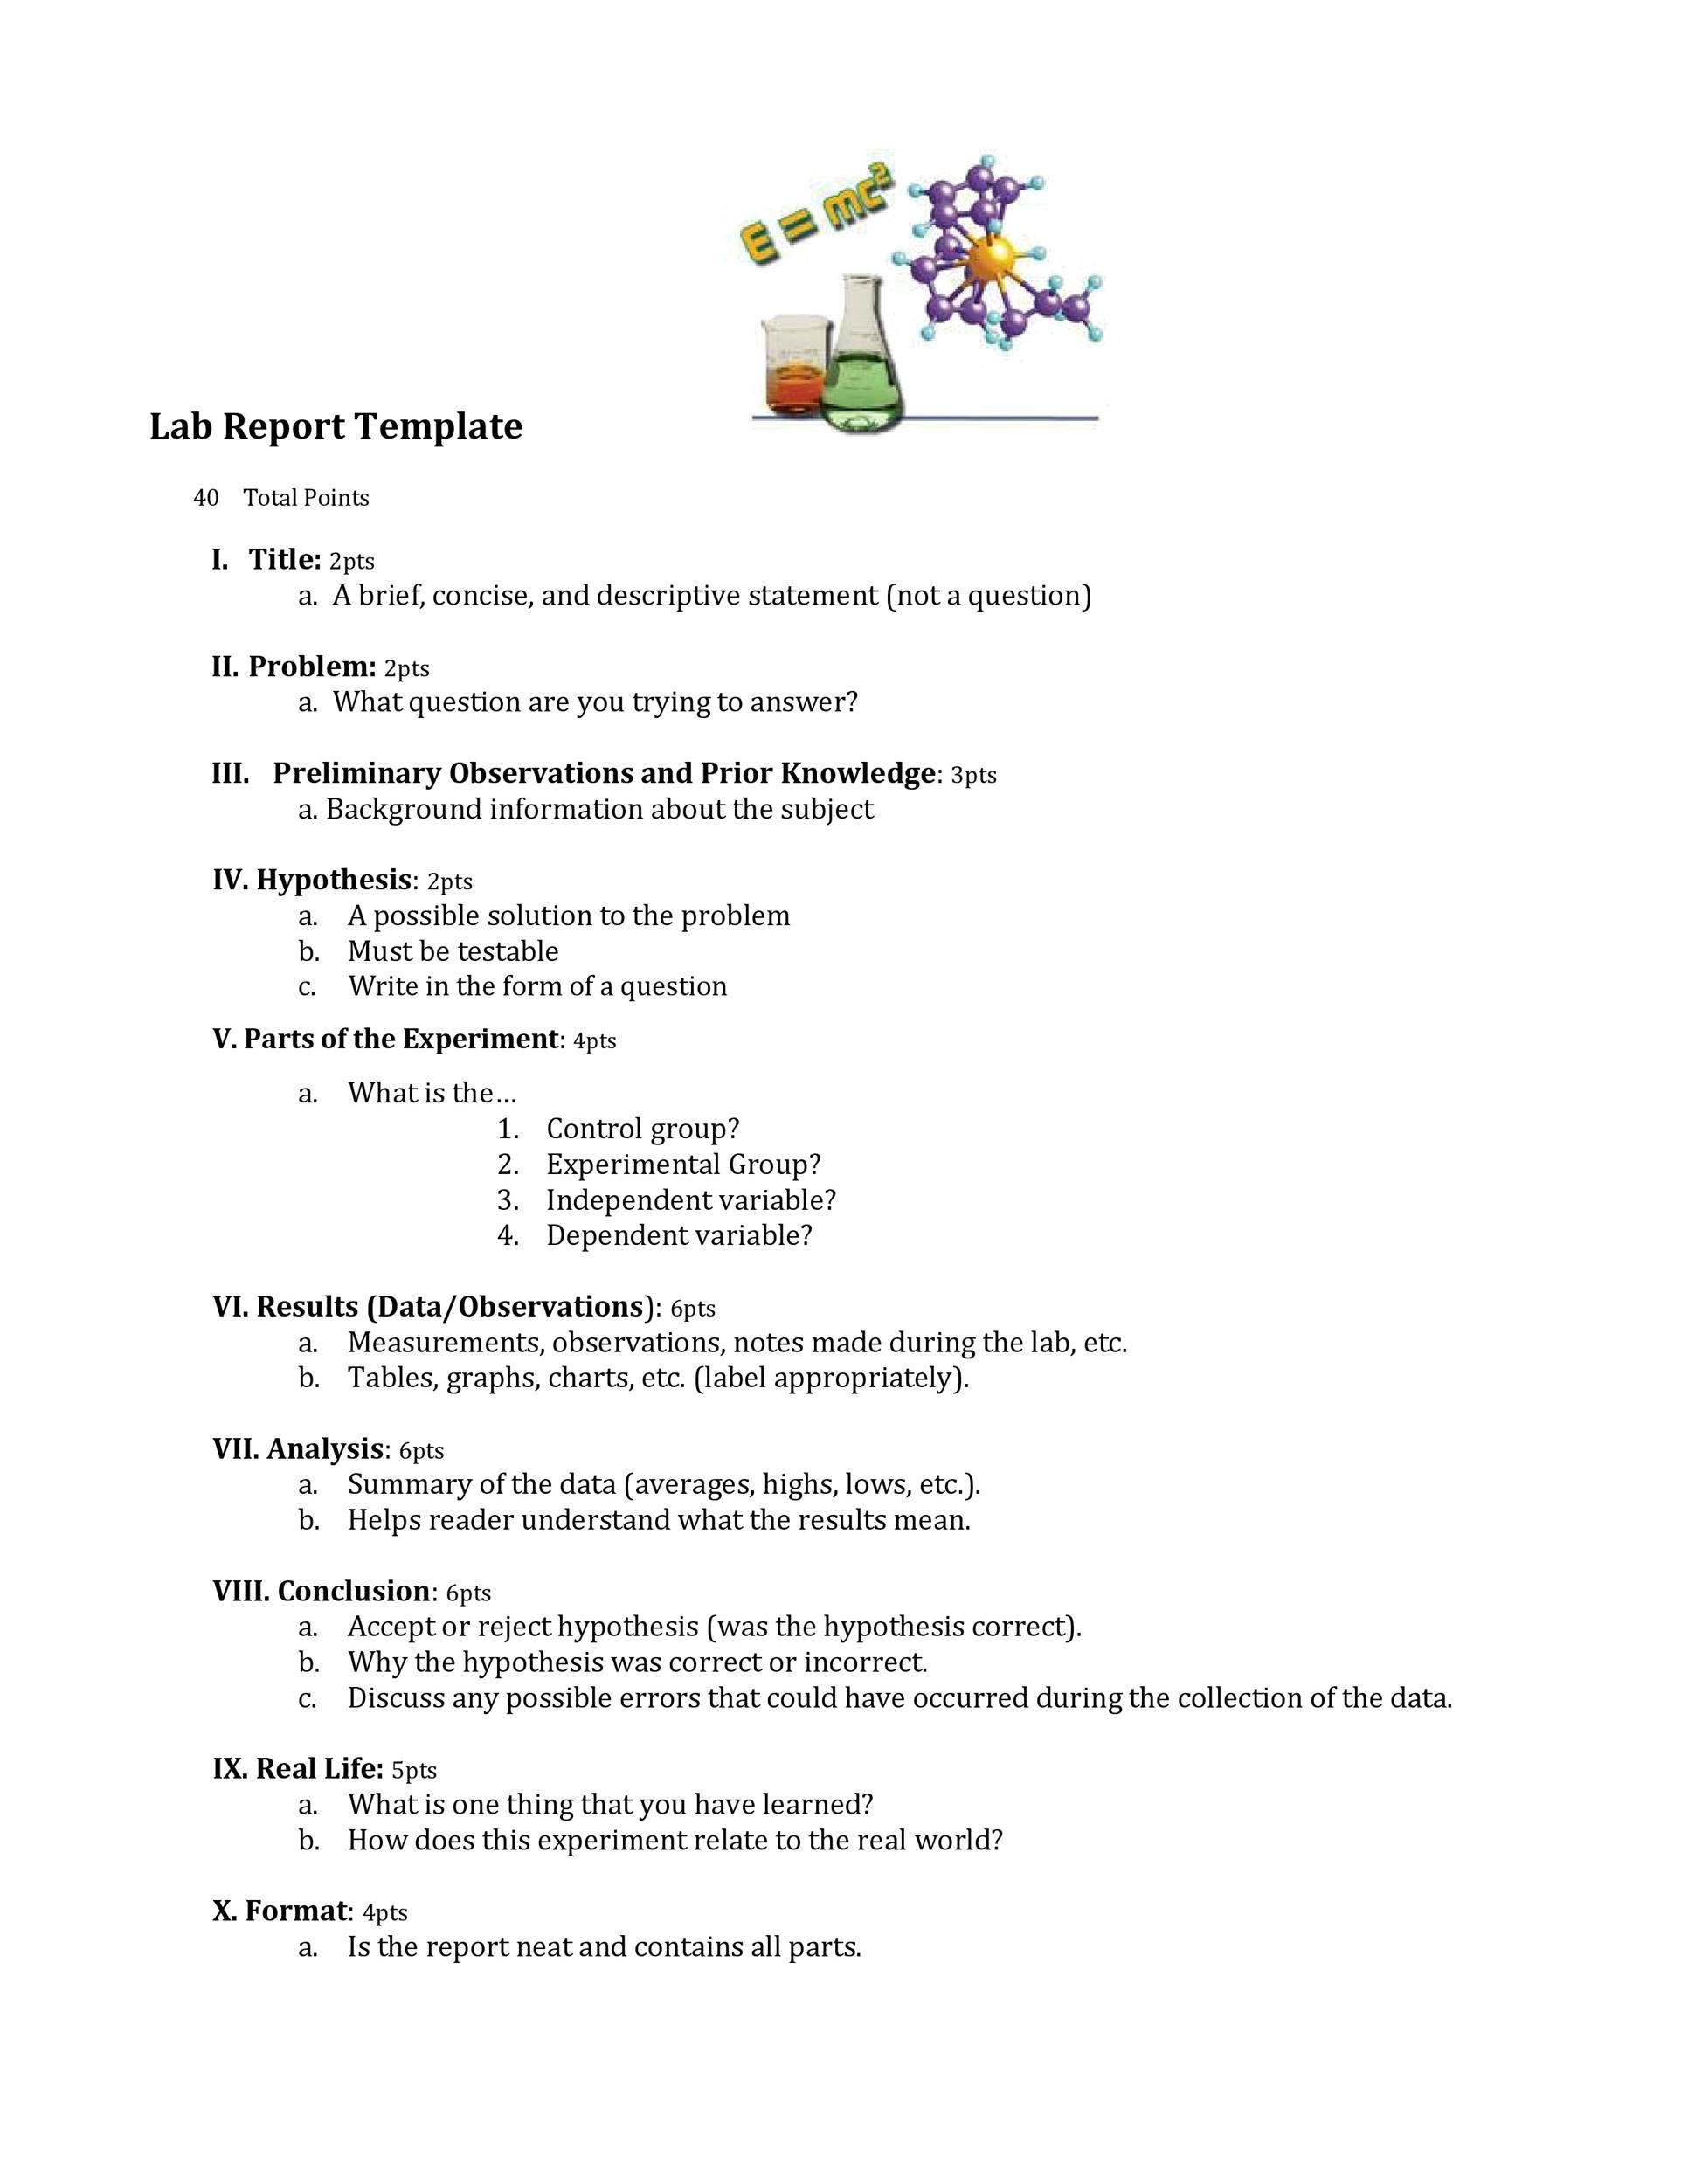
Science Experiment Report Template is the cornerstone of every successful lab project, whether you’re a high‑school student presenting a chemistry demonstration or an aspiring researcher drafting a formal study for a university course. It gives structure, clarity, and credibility to raw data, turning curiosity‑driven observations into compelling narratives that teachers, judges, or peers can easily follow. In this post I’ll walk you through everything you need to know to create, customize, and master a science experiment report template that not only meets grading rubrics but also sparks genuine enthusiasm for the scientific method.
Understanding the Core Components of a Science Experiment Report
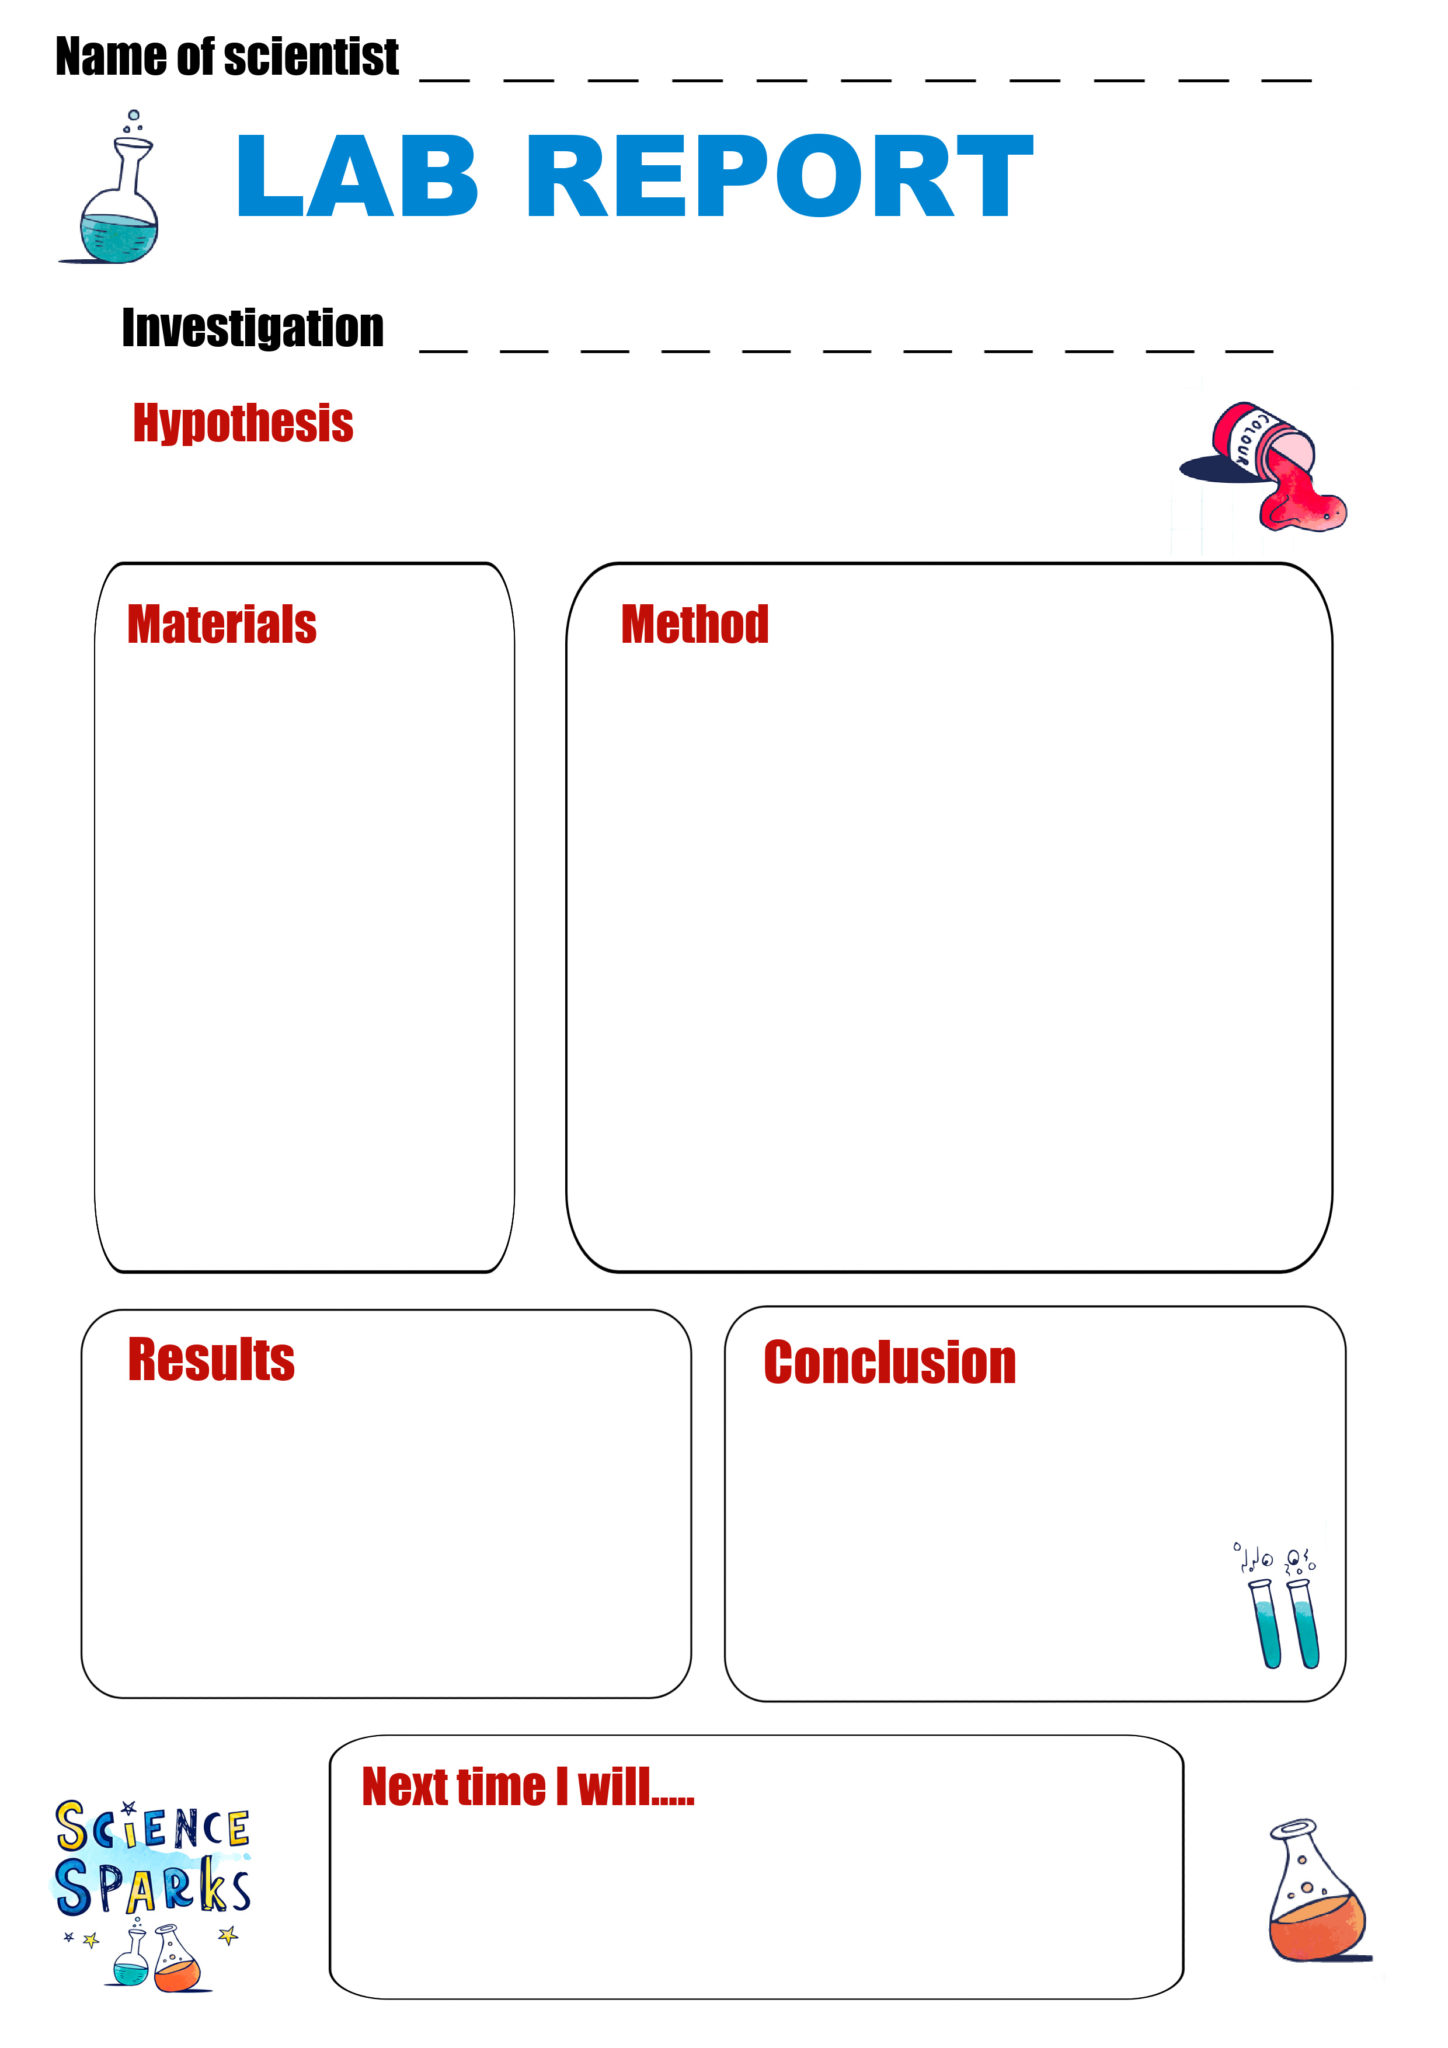
Title and Abstract
The title should be concise yet descriptive—think of it as a billboard for your experiment. It must hint at the variables, the phenomenon, and occasionally the outcome. For example, “Investigating the Effect of Light Intensity on Photosynthetic Rate in Elodea” tells the reader exactly what to expect.
The abstract, typically 150–250 words, provides a snapshot of the entire report. It answers the who, what, why, how, and what‑next in a single paragraph. Write it last, after you’ve polished the rest of the document, so you can accurately summarize results and conclusions.
Introduction
This section sets the stage. Begin with a broad context—why does the topic matter? Then narrow down to the specific research question or hypothesis. A strong introduction weaves in relevant background literature, defines key terms, and clearly states the hypothesis in testable form, such as “If the light intensity increases, then the rate of photosynthesis will increase.”
Materials and Methods
Clarity is king here. List every piece of equipment, chemical, and tool with exact specifications (e.g., “50 mL graduated cylinder, ±0.5 mL accuracy”). Then describe the procedure step‑by‑step in chronological order, using past tense and passive voice for consistency (e.g., “The solution was heated to 45 °C”). Include diagrams or flowcharts if they help visualize complex setups.
Results
Present raw data in tables and graphs before interpreting it. Each table should have a clear caption, column headings with units, and footnotes for any anomalies. Graphs must be labeled with axis titles, units, and a legend if multiple data sets appear. Keep descriptive statistics—means, standard deviations, and sample sizes—near the visualizations to aid quick comprehension.
Discussion
This is where you become a storyteller. Compare your findings with the original hypothesis, discuss any deviations, and explore possible sources of error (instrument precision, environmental variables, human error). Connect results to existing literature, suggest improvements for future experiments, and propose real‑world applications.
Conclusion
Summarize the main takeaways in 2–3 sentences. Restate whether the hypothesis was supported and highlight the most significant insight. Avoid introducing new data; keep it focused and crisp.
References and Appendices
All citations should follow a consistent style—APA, MLA, or a specific school format. Appendices can host supplementary material like raw data sheets, calculation steps, or detailed safety protocols that would clutter the main narrative.
Step‑by‑Step Guide to Building Your Own Template
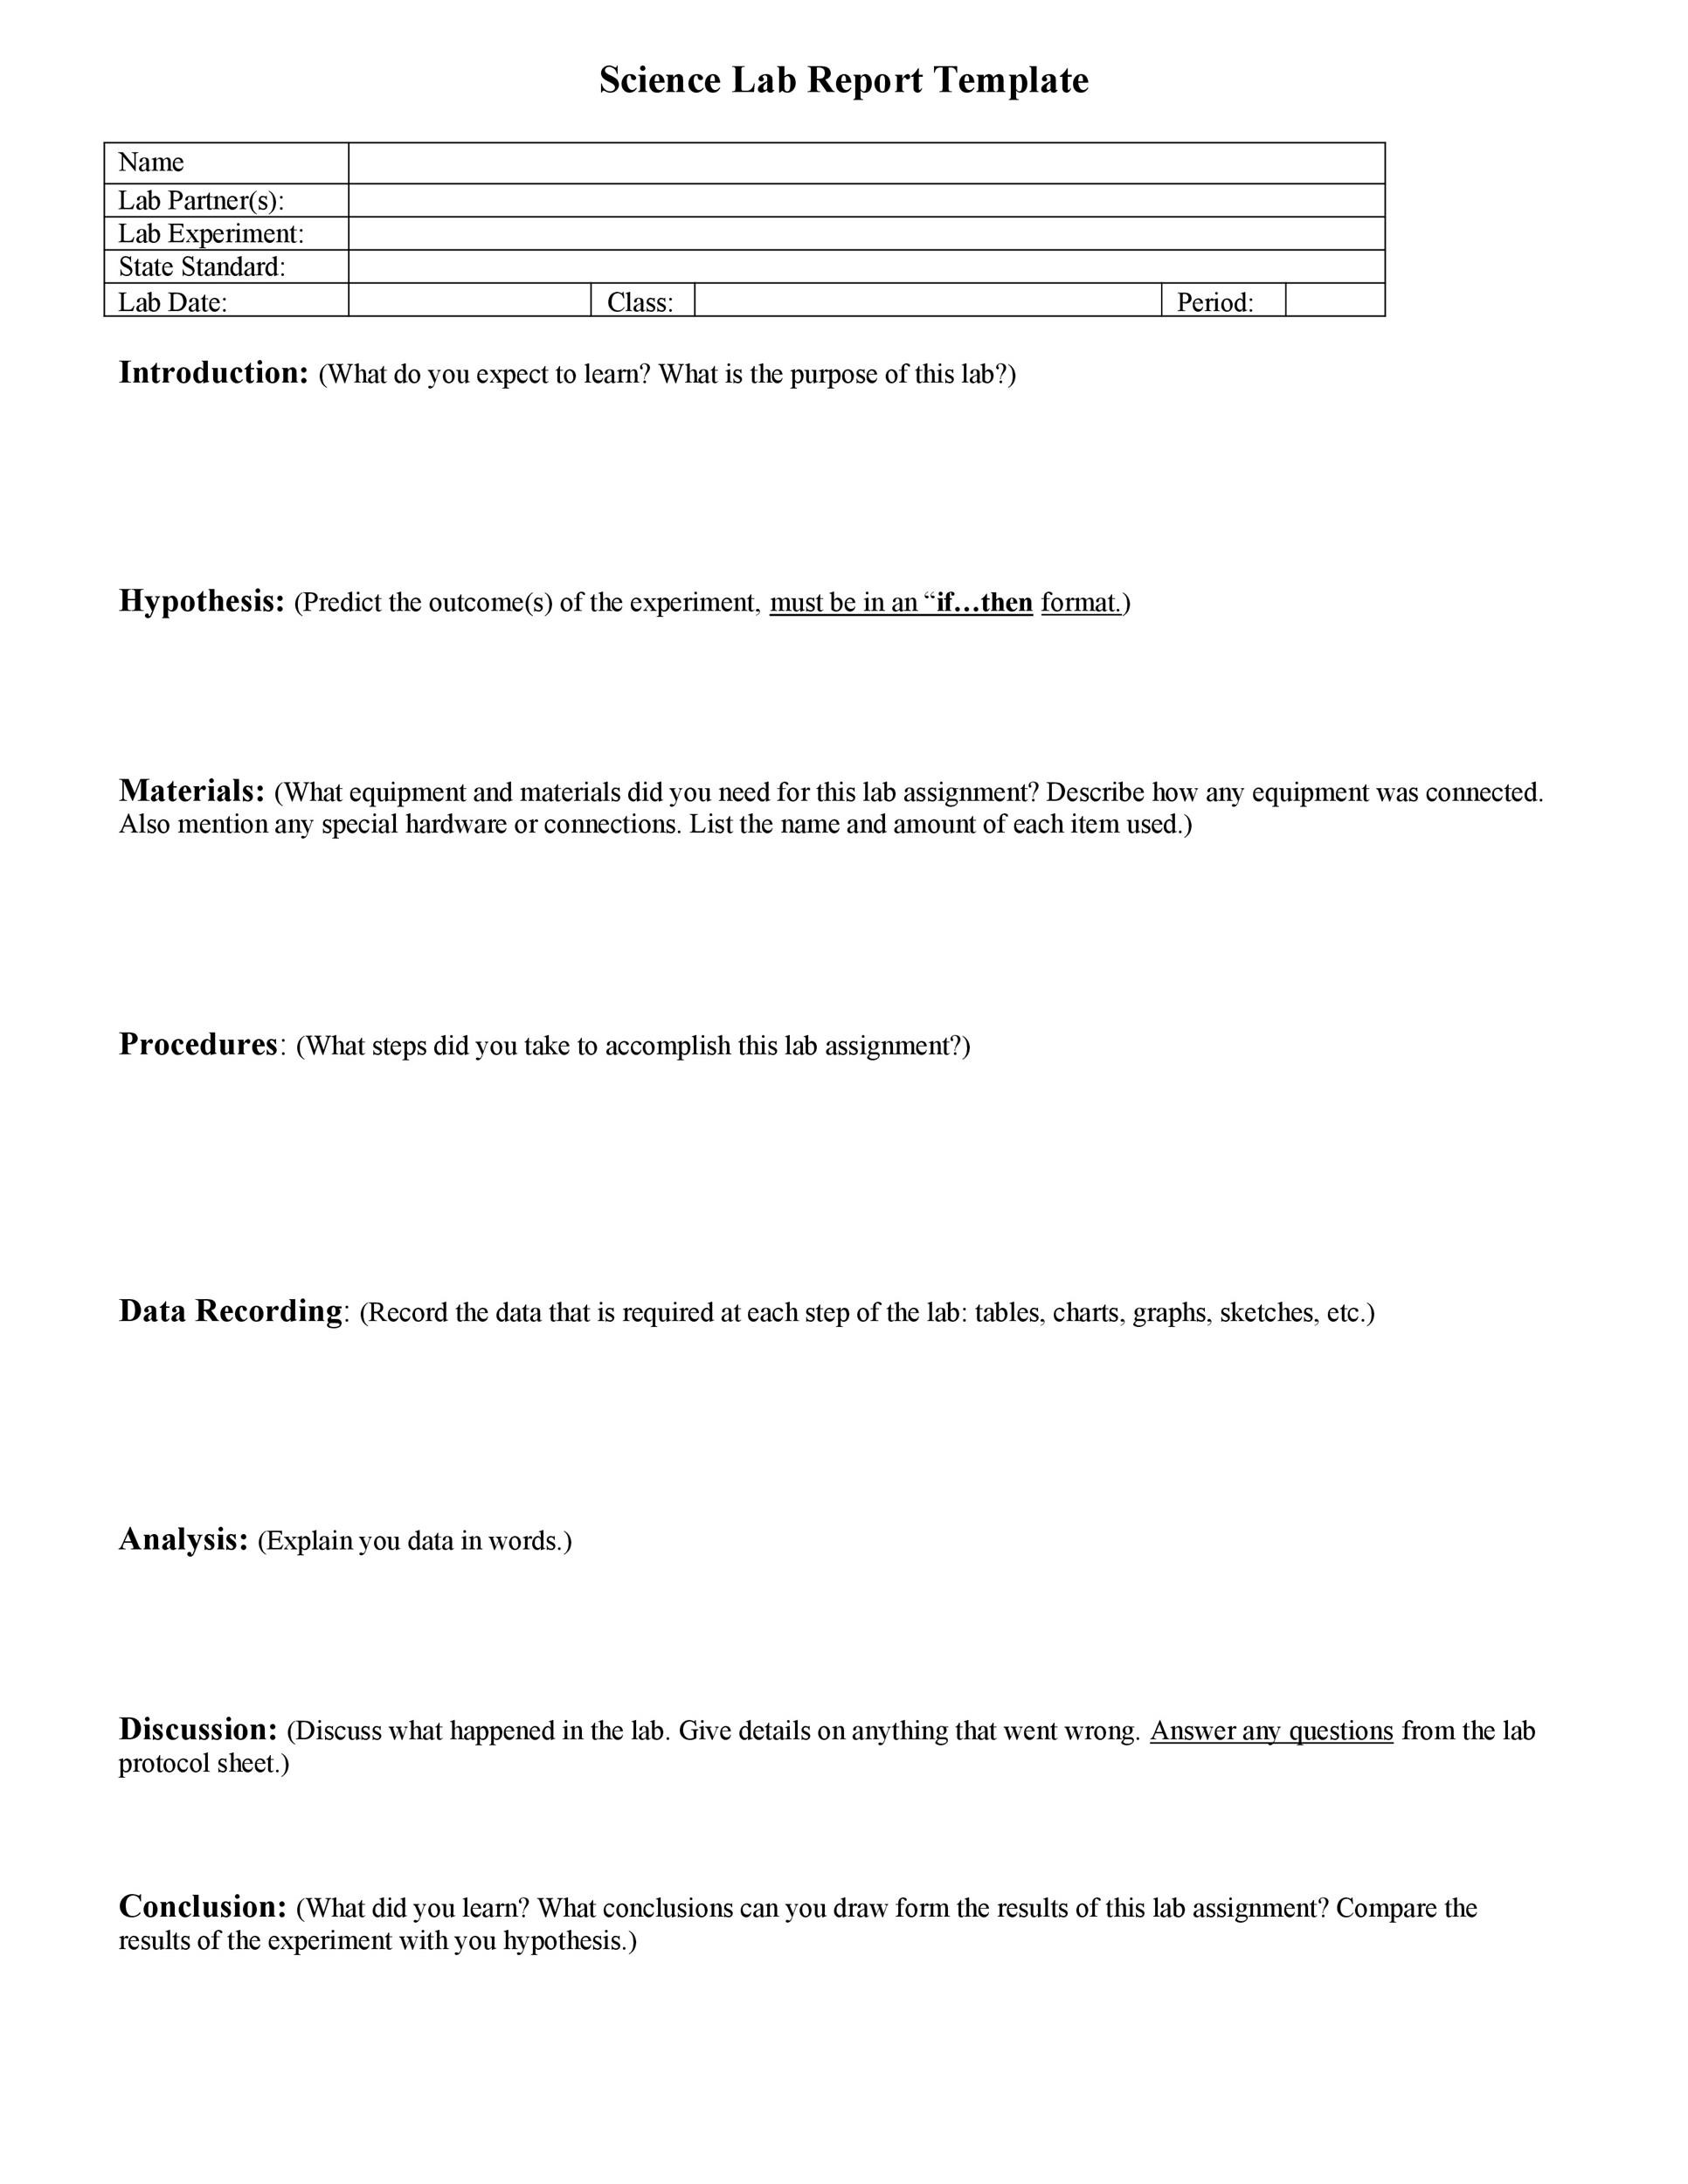
Choose a Layout Platform
Most students start with Microsoft Word or Google Docs because they offer built‑in heading styles, automatic table of contents, and easy formatting. If you prefer a more visual approach, Canva or Adobe InDesign can produce polished PDFs with custom graphics. Whichever platform you pick, set up a master document with predefined styles for headings, subheadings, body text, tables, and figure captions.
Create Placeholder Sections
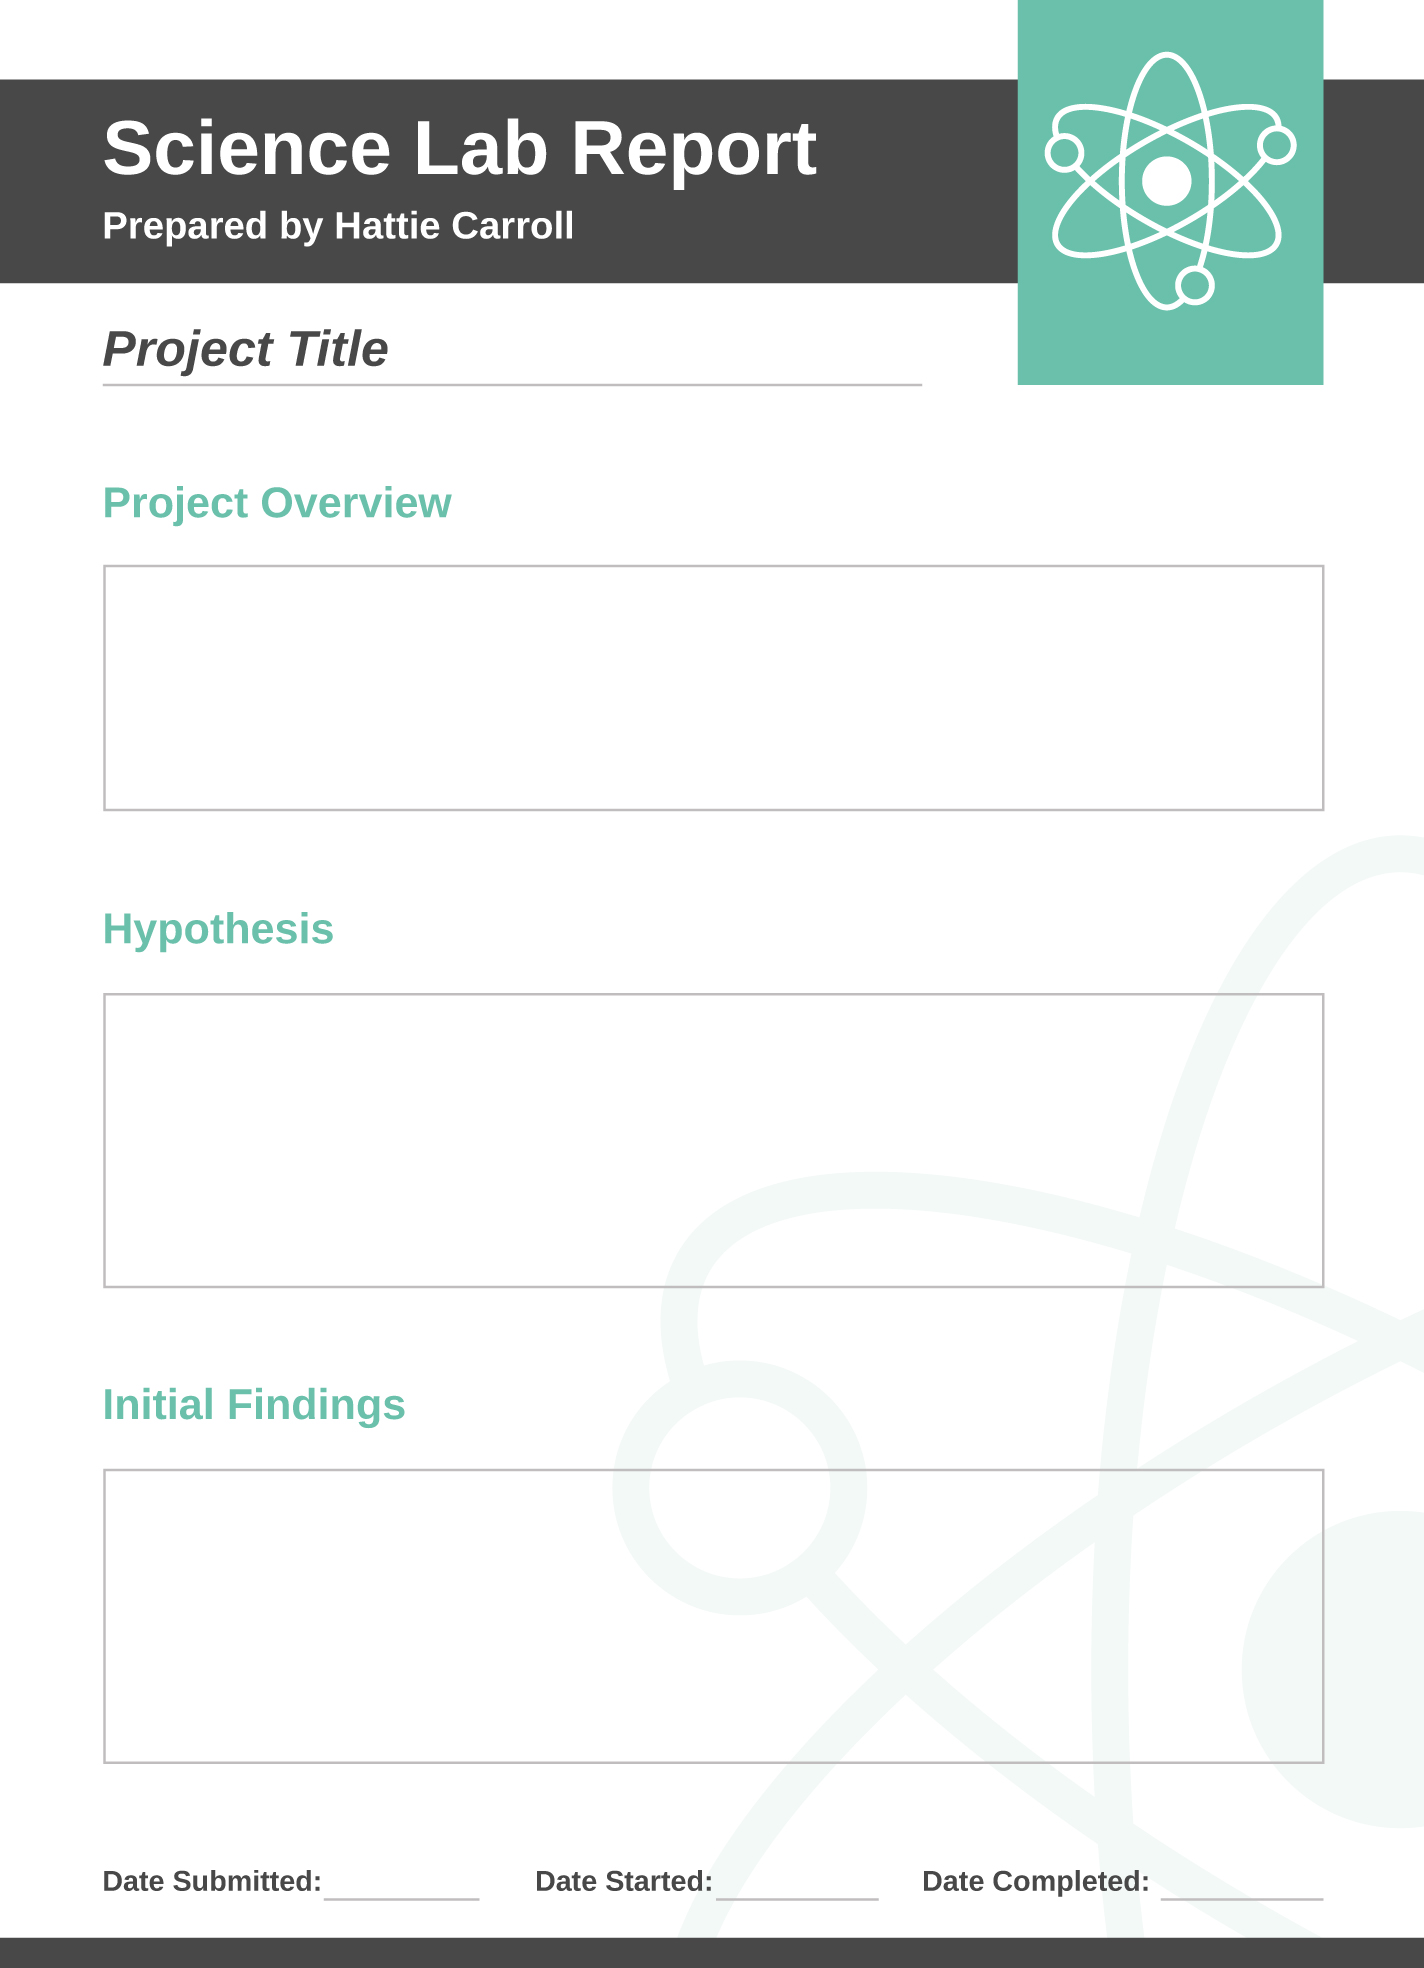
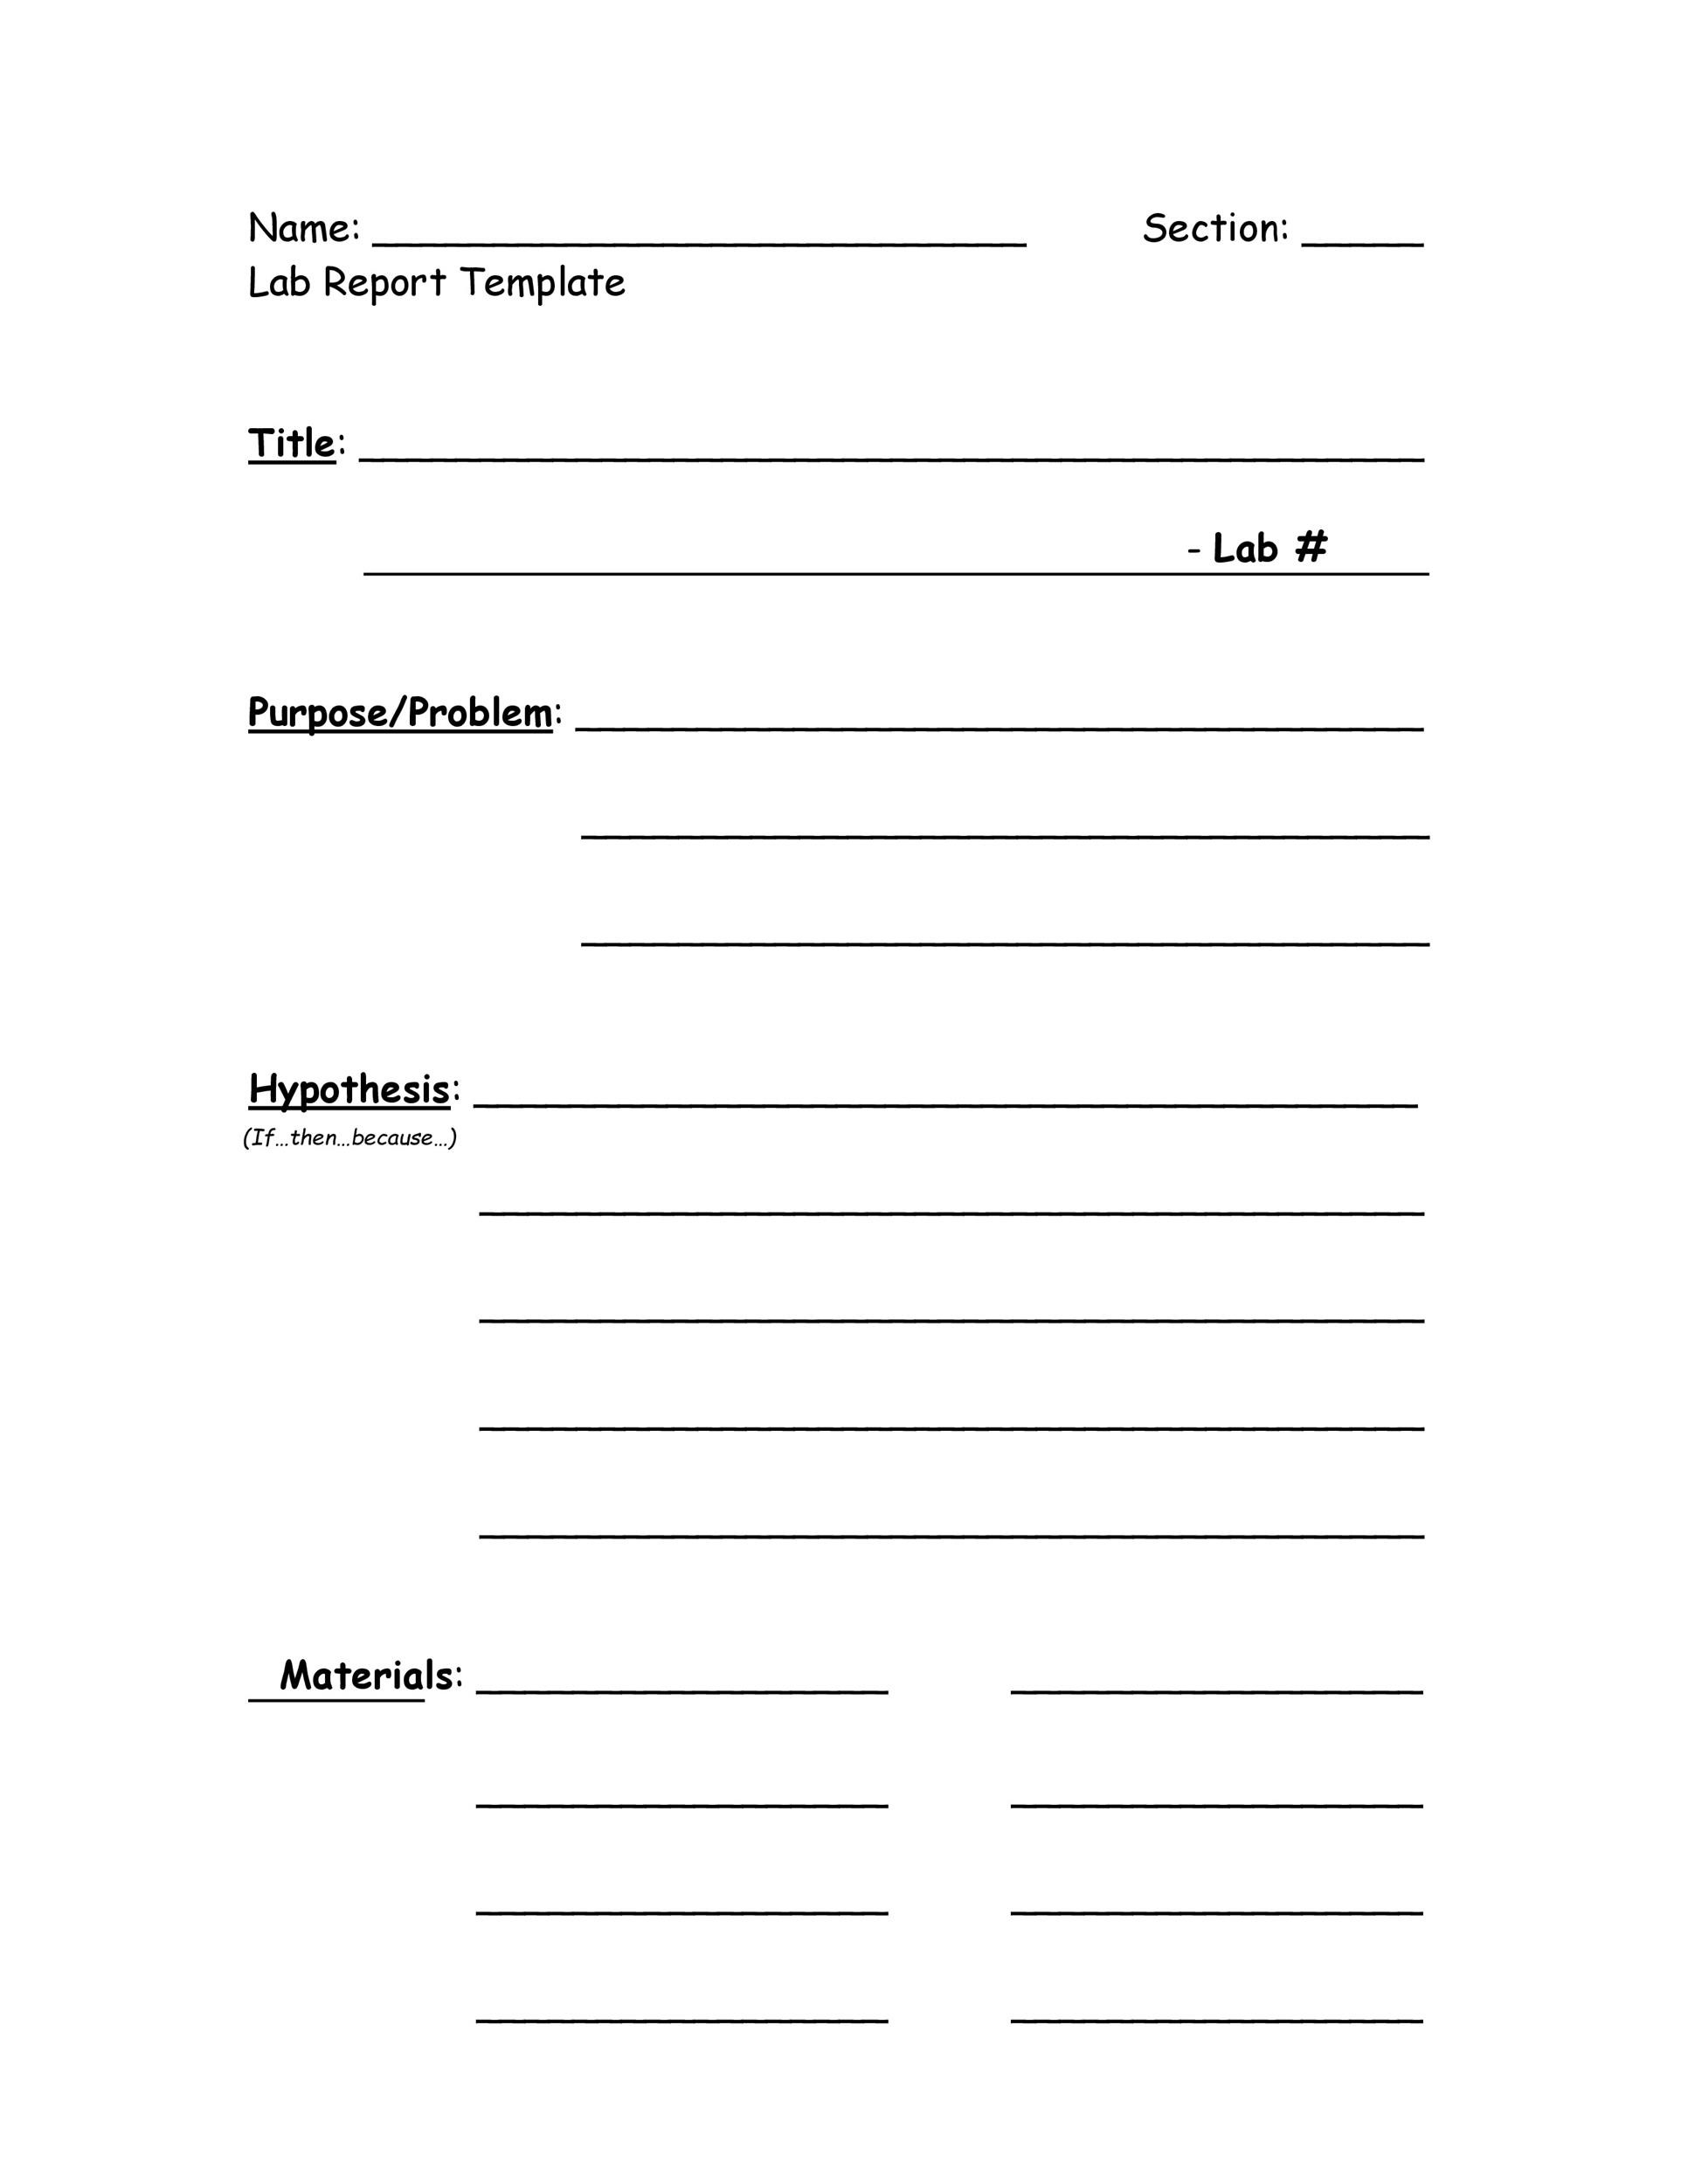
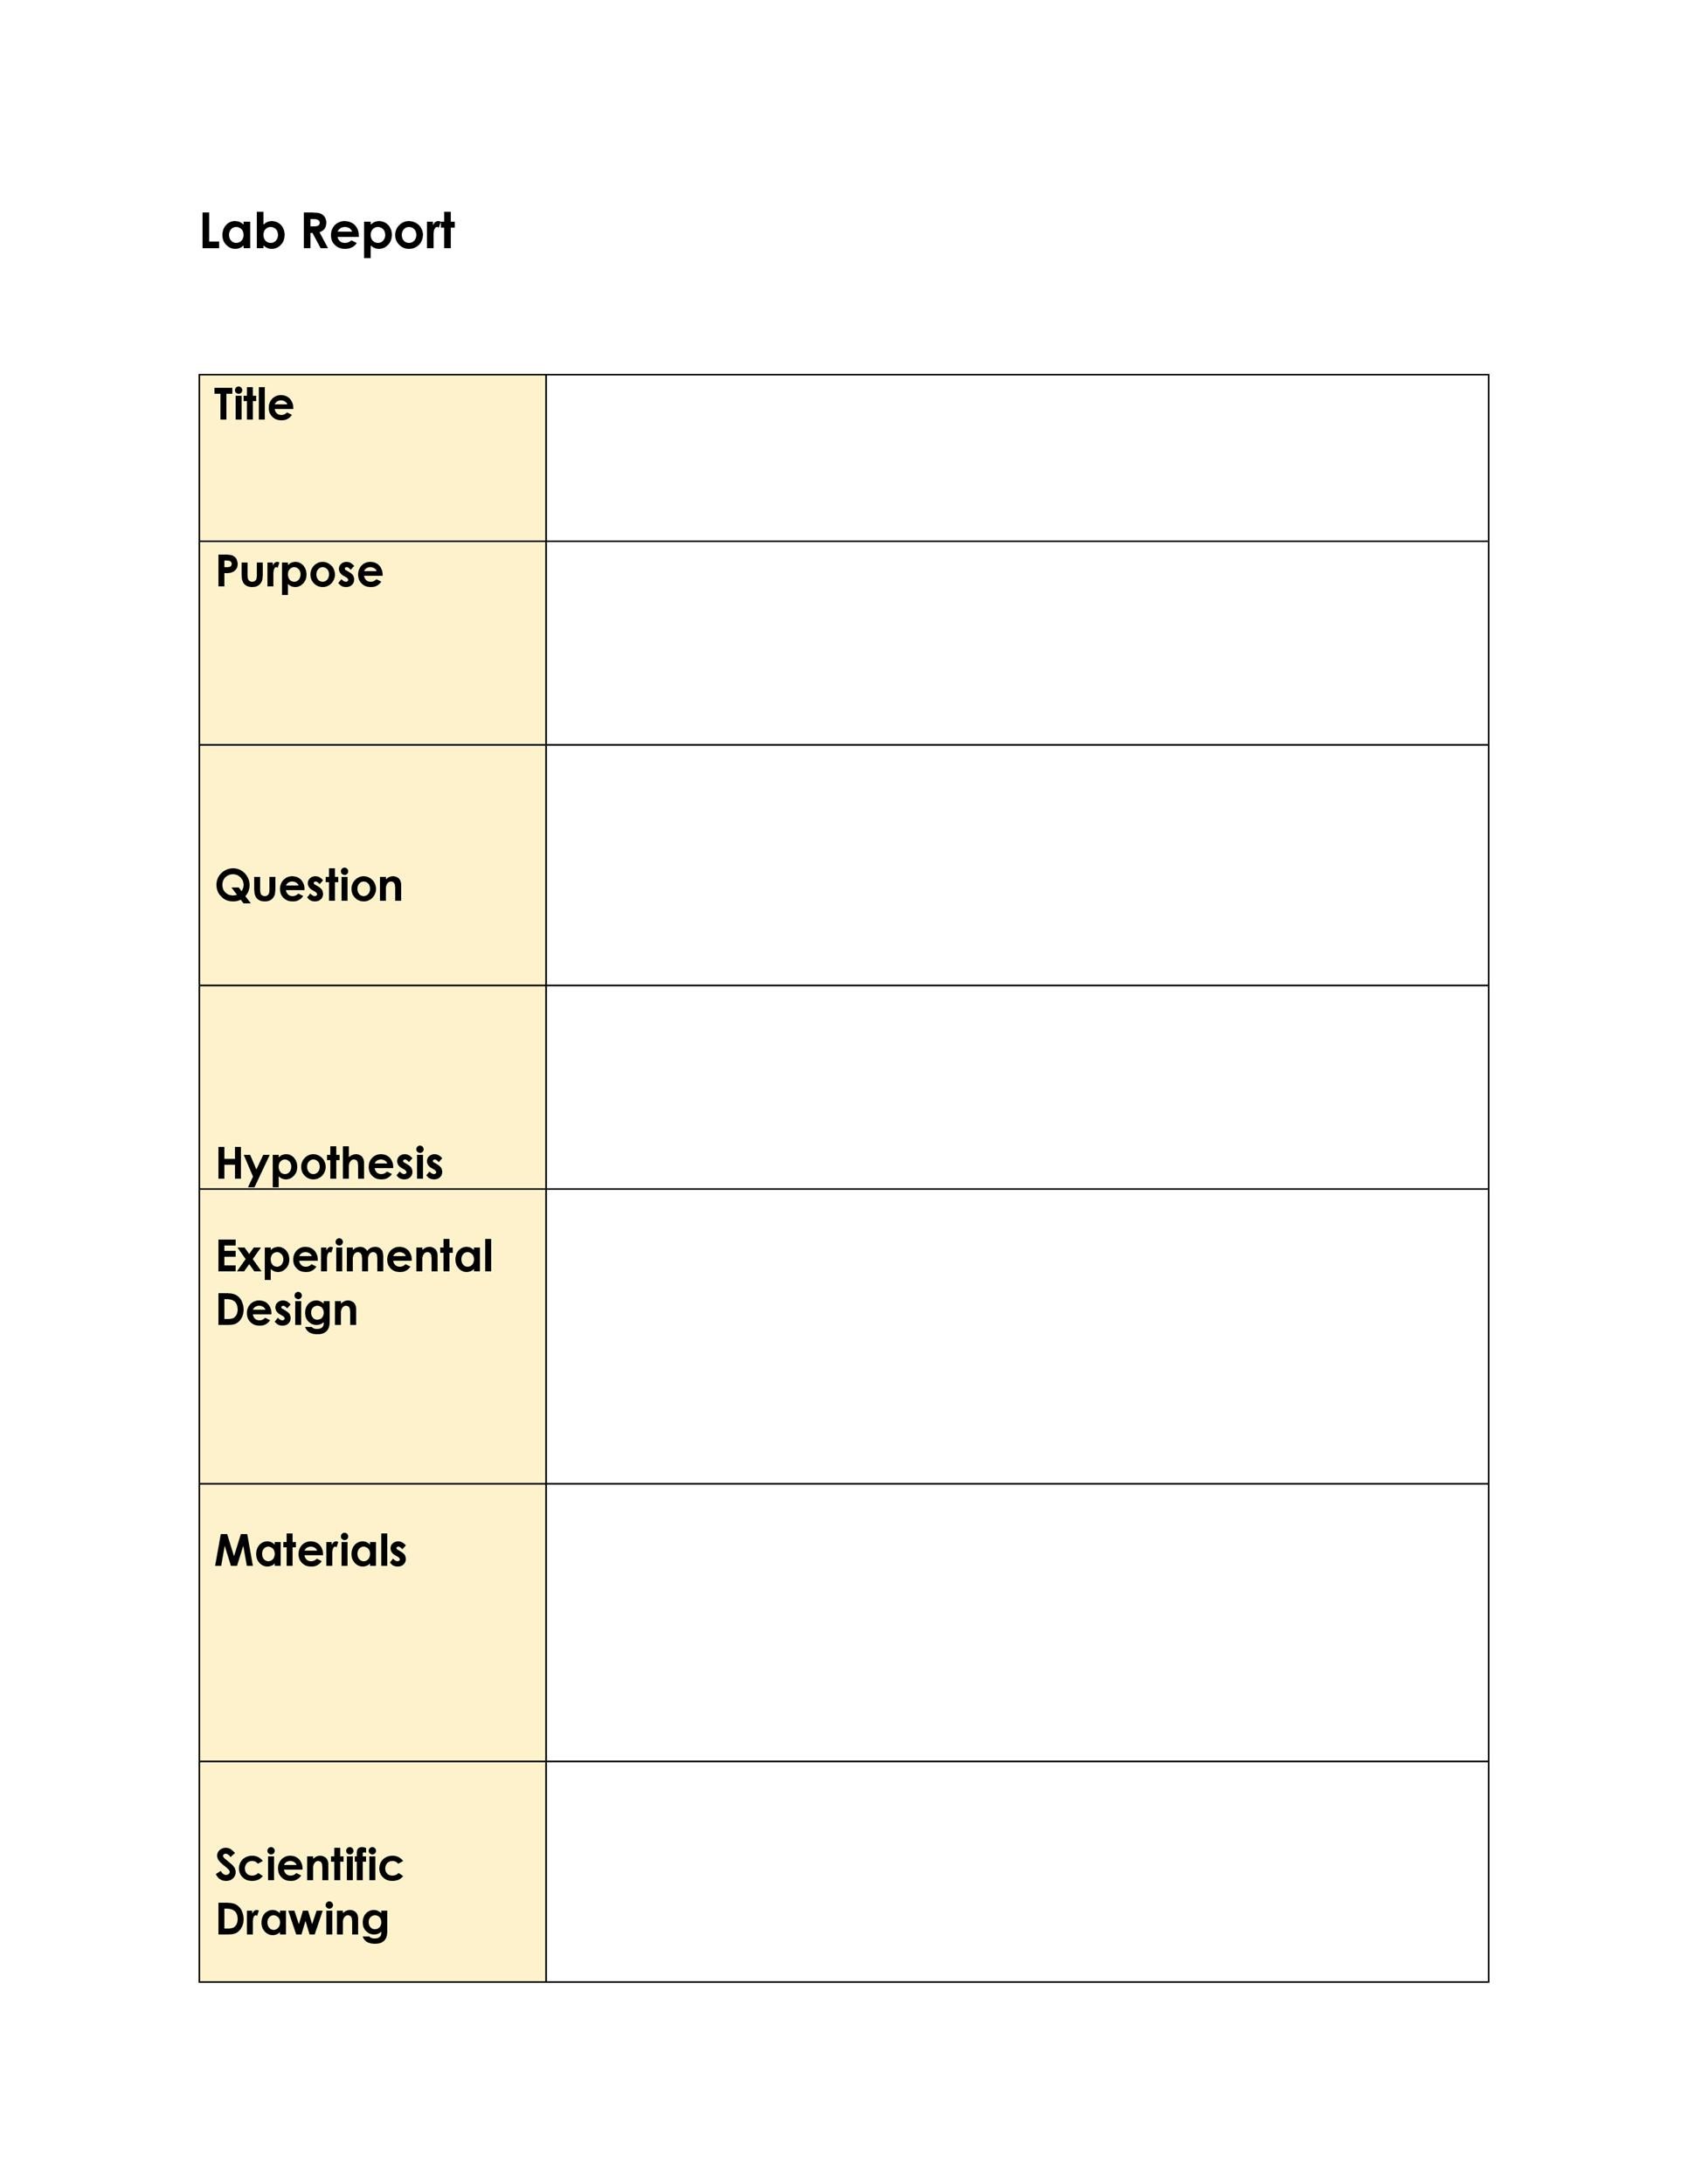
Insert section headings exactly as they will appear in the final report: Title, Abstract, Introduction, Materials and Methods, Results, Discussion, Conclusion, References, Appendices. Use the “Heading 2” style for each main section and “Heading 3” for any sub‑sections, such as “Data Table 1” or “Error Analysis.” This hierarchy enables automatic navigation and a clean table of contents.
Design Consistent Tables and Figures
Set a default table style that includes borders, header shading, and a legible font size (10–12 pt). For figures, create a caption style that italicizes the text and aligns it centrally beneath the image. Include placeholders like “[Insert Graph Here]” so you remember where visual data will go during the writing process.
Integrate Citation Management
Link your document to a citation manager (Zotero, Mendeley, or EndNote). This allows you to insert in‑text citations and generate a bibliography automatically, reducing the risk of formatting errors and saving hours of manual editing.
Save as a Reusable Template
Once the skeleton is complete, save the file as a template (.dotx for Word, .gdoc for Google Docs). Each new experiment can now be started with a single click, ensuring consistency across multiple reports and making it easier for teachers to grade.
Customizing the Template for Different Science Disciplines
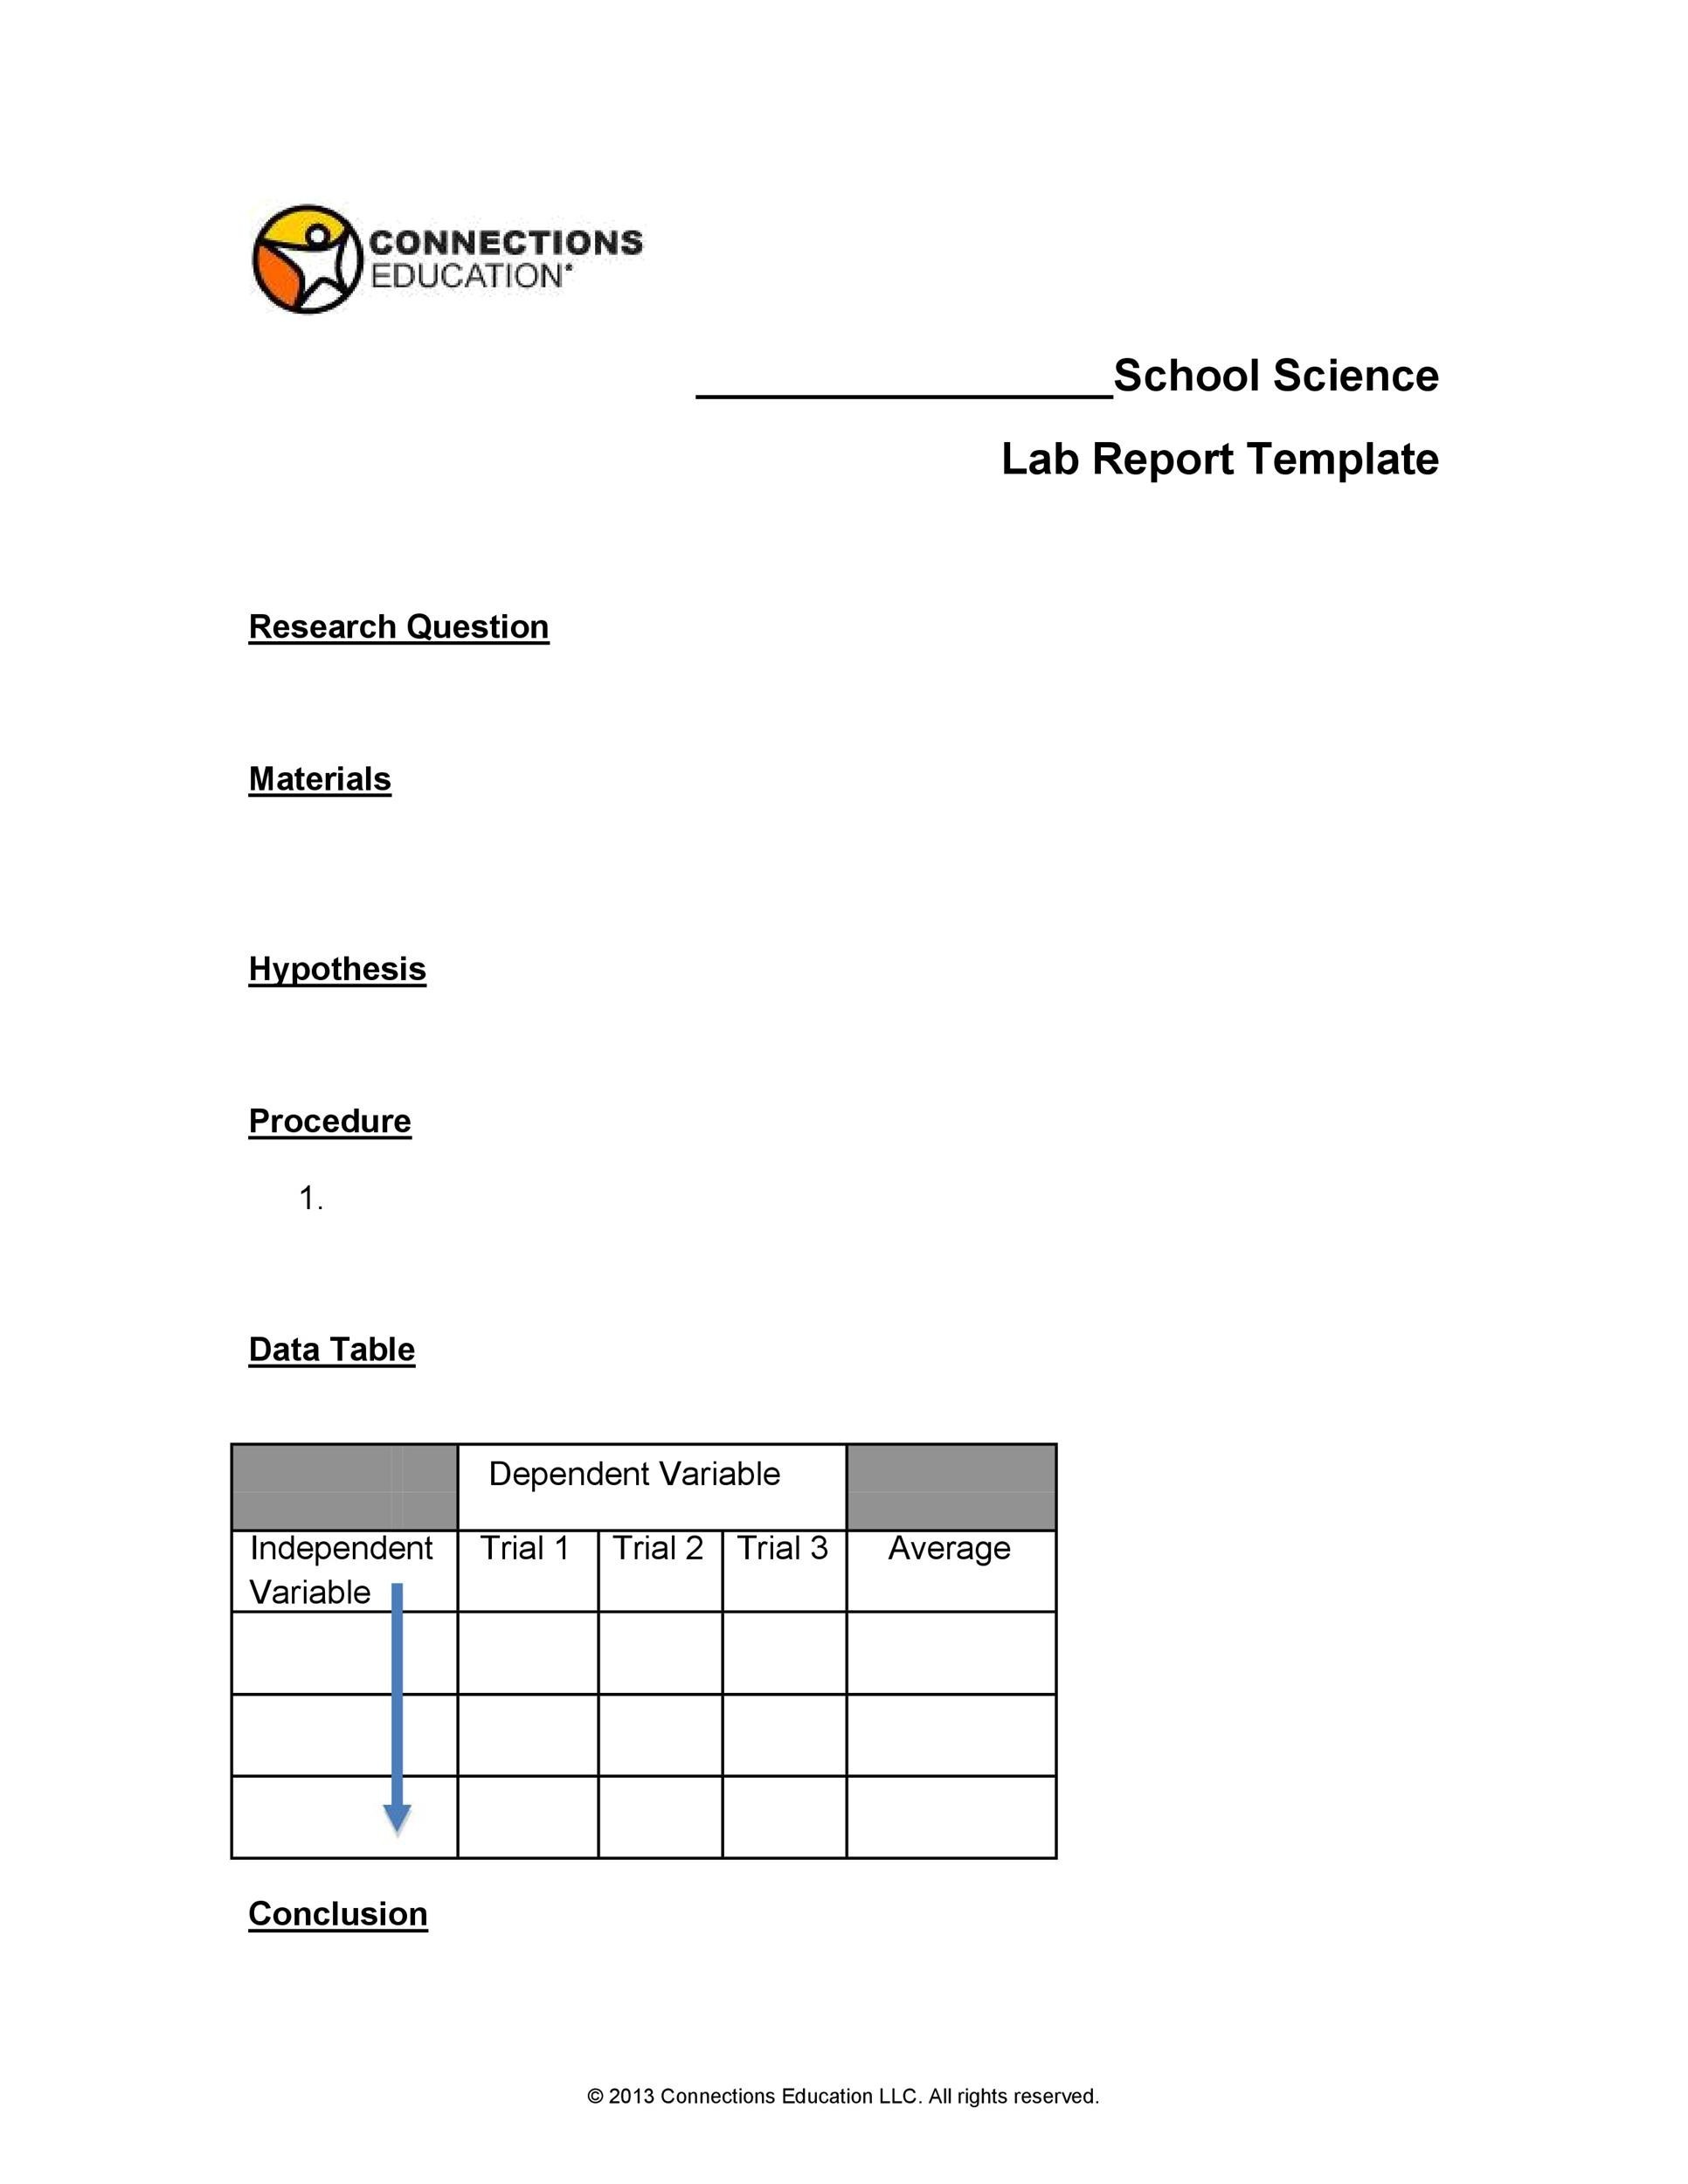
Biology and Life Sciences
Life‑science reports often require detailed methodology sections that include sample collection sites, species identification, and ethical considerations. Add a sub‑section for “Ethical Approval” if working with animal subjects, and include a “Microscopy Images” placeholder for high‑resolution photos.
Chemistry
Chemistry experiments demand precise chemical equations, safety data sheets (SDS), and reaction yield calculations. Include a “Chemical Equation” field and a “Yield and Purity” table to capture theoretical versus actual yields, as well as a safety checklist to remind you of proper PPE and waste disposal.
Physics
Physics reports benefit from clear derivations and uncertainty analysis. Create a “Derivation” subsection where you can lay out the mathematical steps leading to the final equation. Add a “Uncertainty Propagation” table that walks through each variable’s contribution to the total error.
Environmental Science
These projects often involve field data, GIS maps, and long‑term monitoring. Include a “Site Description” box and placeholders for “Map Insert” and “Temporal Data Graph.” A “Statistical Significance” section can summarize p‑values and confidence intervals for trend analysis.
SEO Best Practices for Your Science Report Blog Post
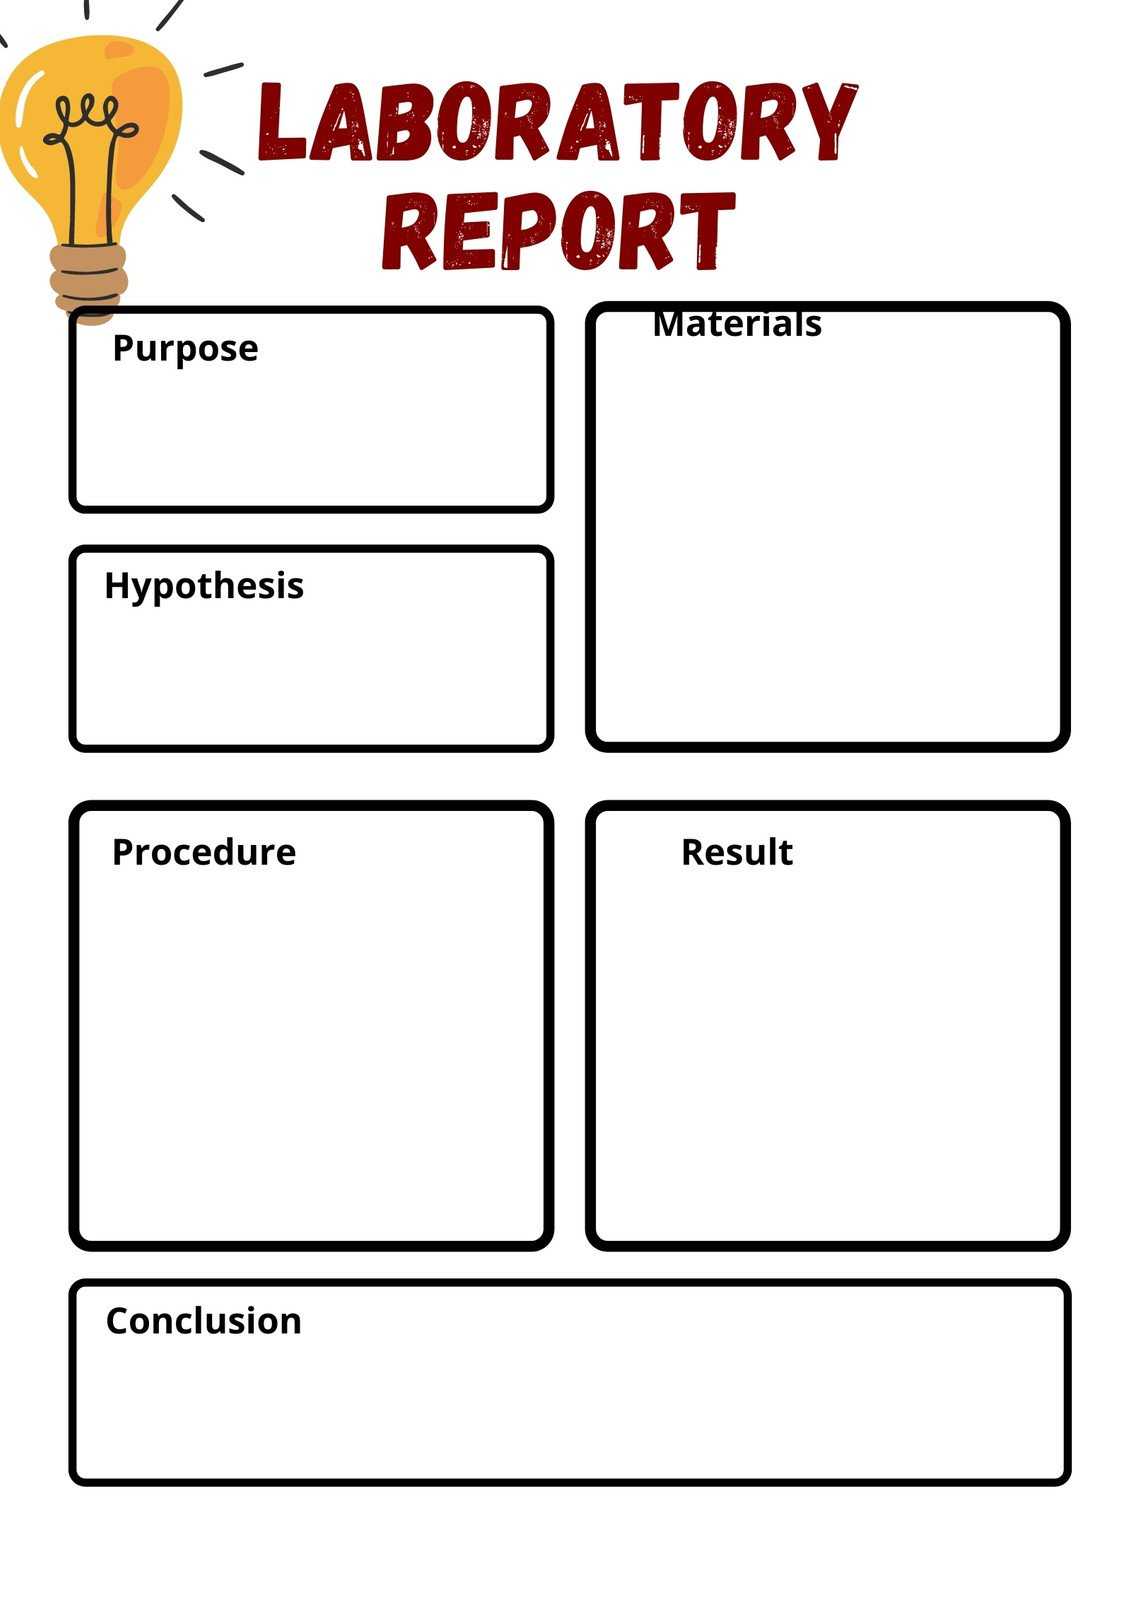
Keyword Placement
Beyond the mandatory Science Experiment Report Template in the opening sentence, sprinkle related keywords naturally throughout the article: “lab report format,” “experiment documentation,” “science report example,” and “how to write a lab report.” Use them in headings, subheadings, and alt text for any images (if you later embed them).
Meta Descriptions and Alt Text (When Publishing)
Although the blog post itself doesn’t contain meta tags, keep in mind that a concise meta description—under 160 characters—should highlight the value proposition: “Learn how to create a flawless Science Experiment Report Template with step‑by‑step guidance, examples, and customization tips.” For images, write alt text like “Sample science experiment report template layout” to reinforce relevance.
Internal and External Linking
Link to related posts such as “How to Analyze Experimental Data” or “Top Free Lab Report Templates” to increase dwell time and signal topical authority. When linking to reputable external resources (e.g., a university’s lab safety guidelines), use descriptive anchor text rather than generic “click here.”
Readability and Engagement
Break up dense paragraphs with bullet points or numbered steps. Use a conversational tone—“you’ll notice” or “let’s explore”—to keep the reader engaged while still delivering expert content. Short sentences, active voice, and varied sentence length improve readability scores and keep the audience on the page longer.
Common Mistakes to Avoid When Using a Template
Copy‑Paste Without Adaptation
It’s tempting to reuse a previous report verbatim. However, each experiment has unique variables, safety considerations, and results. Tailor every section to reflect the specific context; otherwise, the report will feel generic and may lose marks for lack of specificity.
Overloading the Results Section
Presenting every single data point can overwhelm readers. Prioritize key trends and use summary statistics. If you must include exhaustive data, place it in an appendix and reference it in the main text.
Neglecting Error Analysis
Even the most flawless experiment has sources of uncertainty. Skipping the error analysis suggests a lack of scientific rigor. Discuss measurement precision, systematic biases, and how they might have influenced outcomes.
Improper Citation Formatting
Inconsistent citations can lead to plagiarism accusations and lower grades. Stick to one citation style throughout, and double‑check each reference for completeness: author, year, title, journal, volume, pages, and DOI when available.
Real‑World Example: From Concept to Completed Report
Project Overview
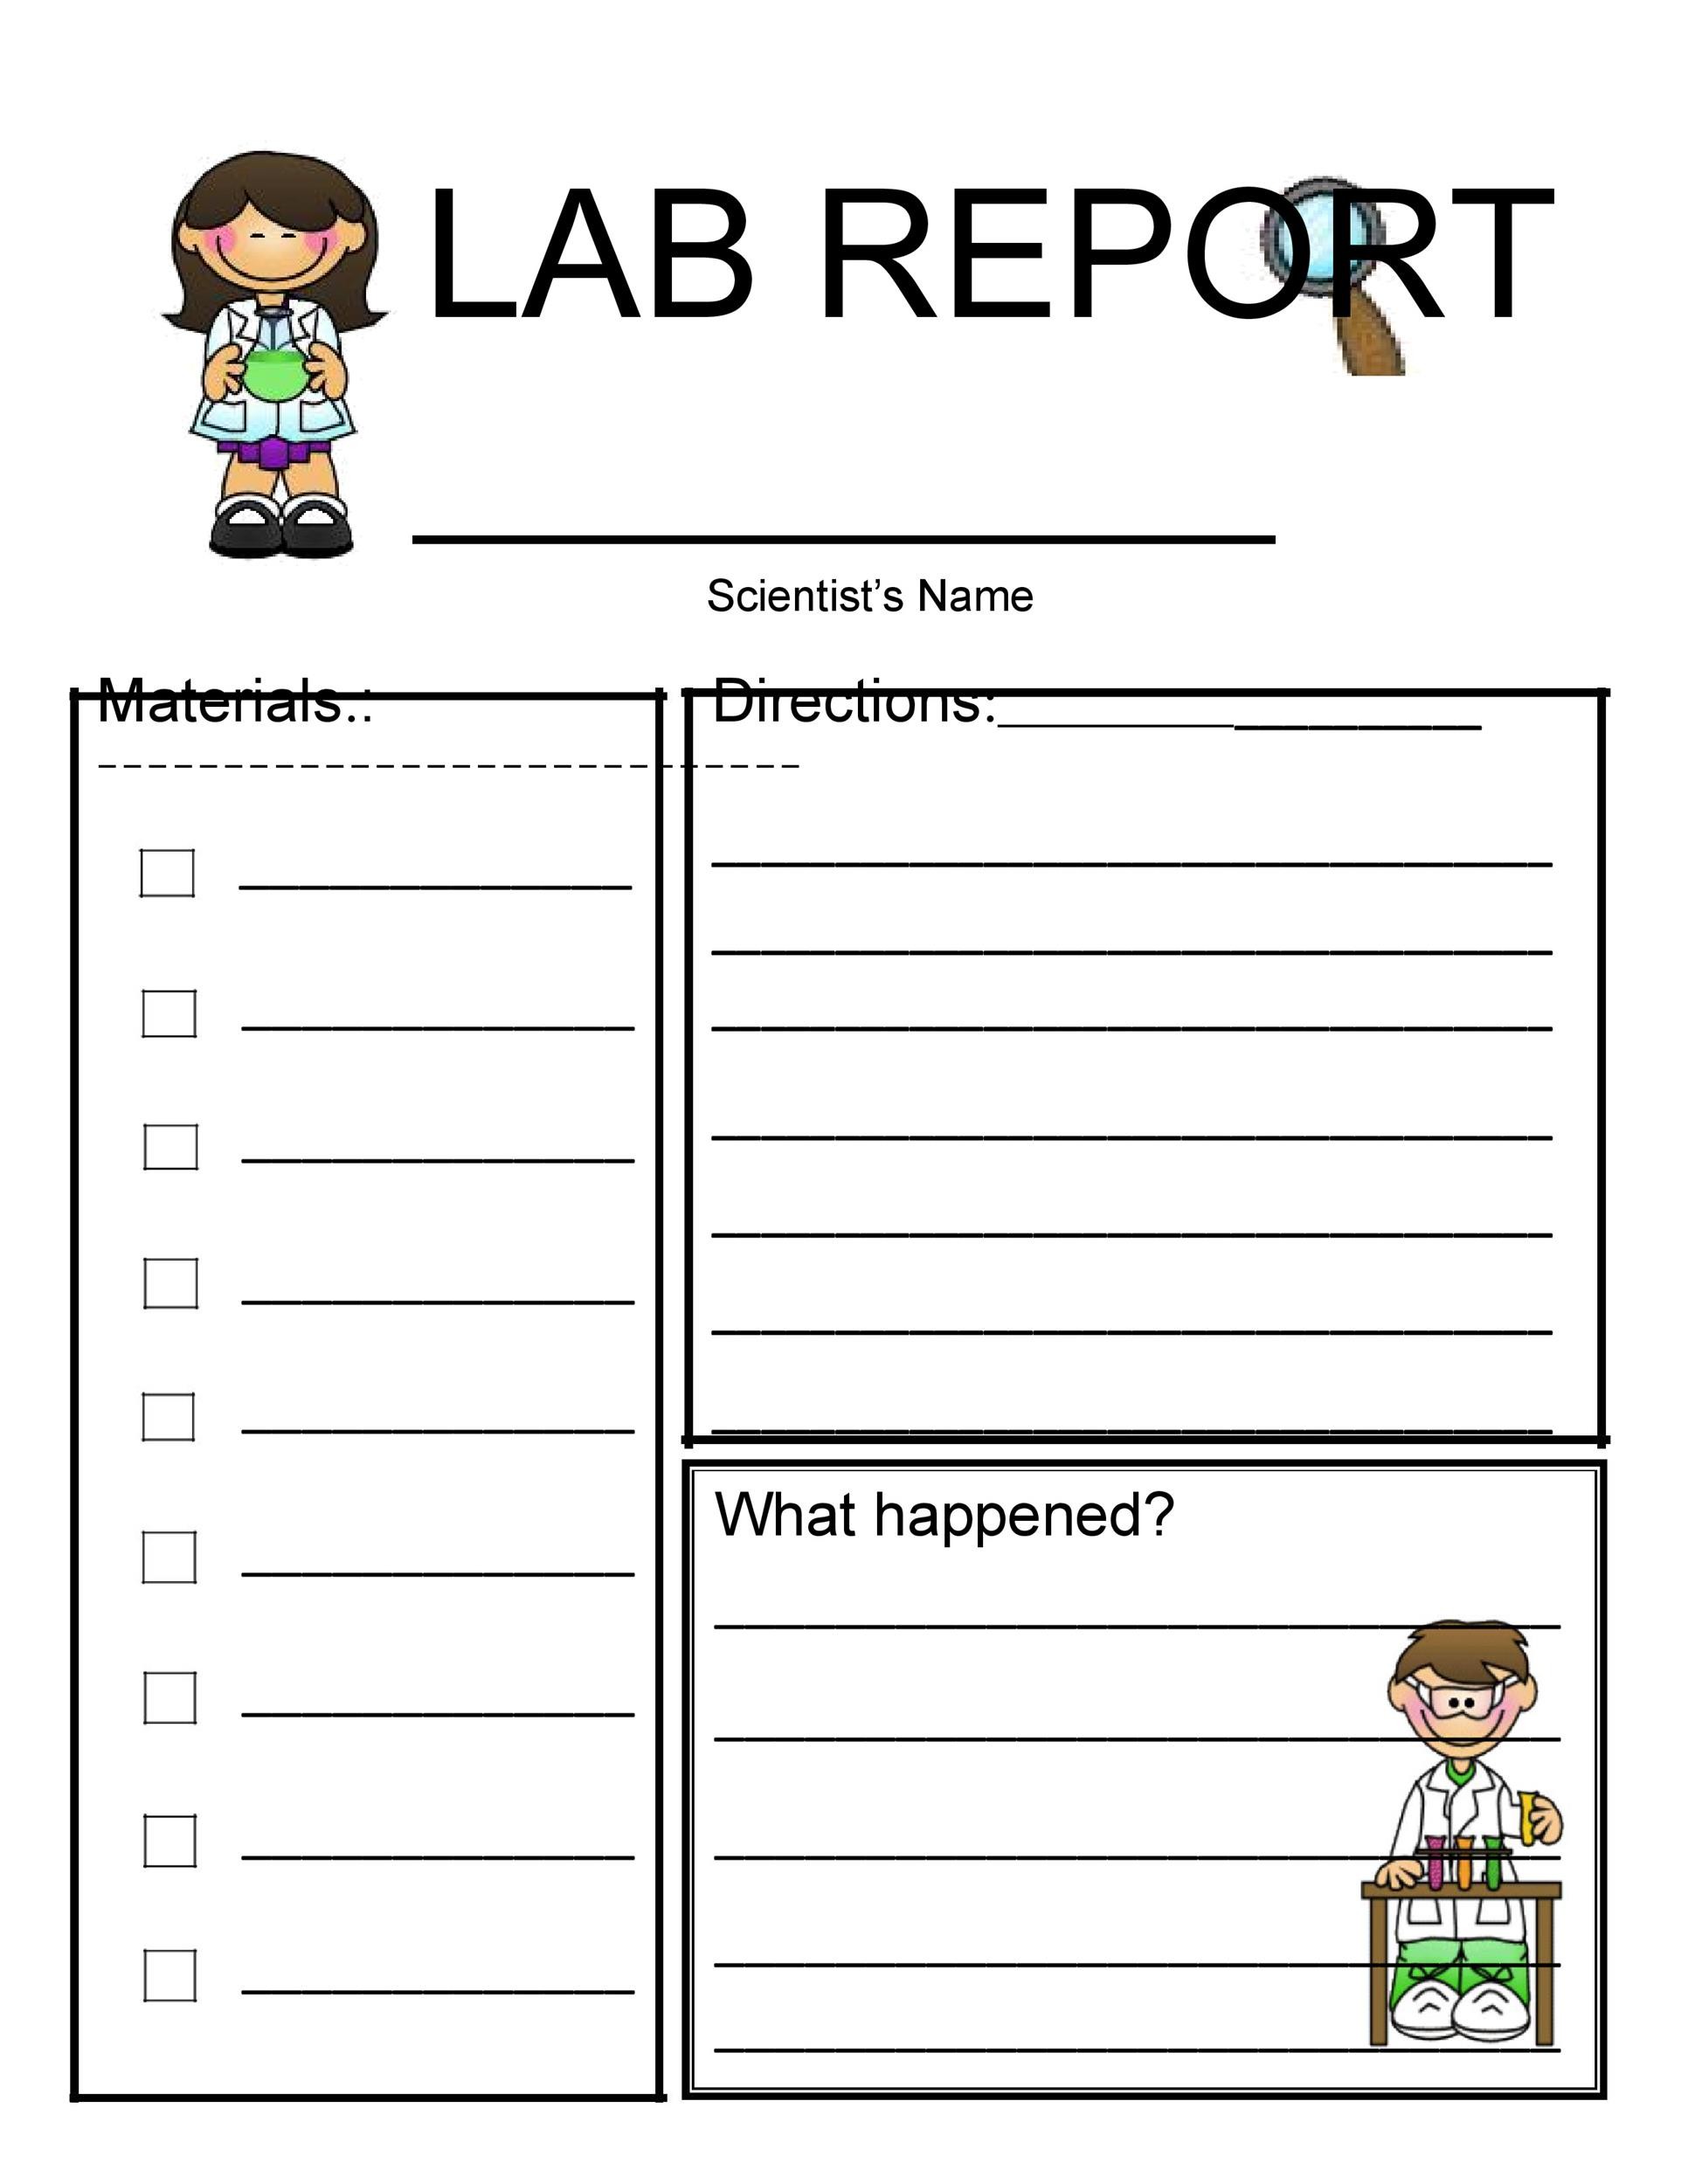
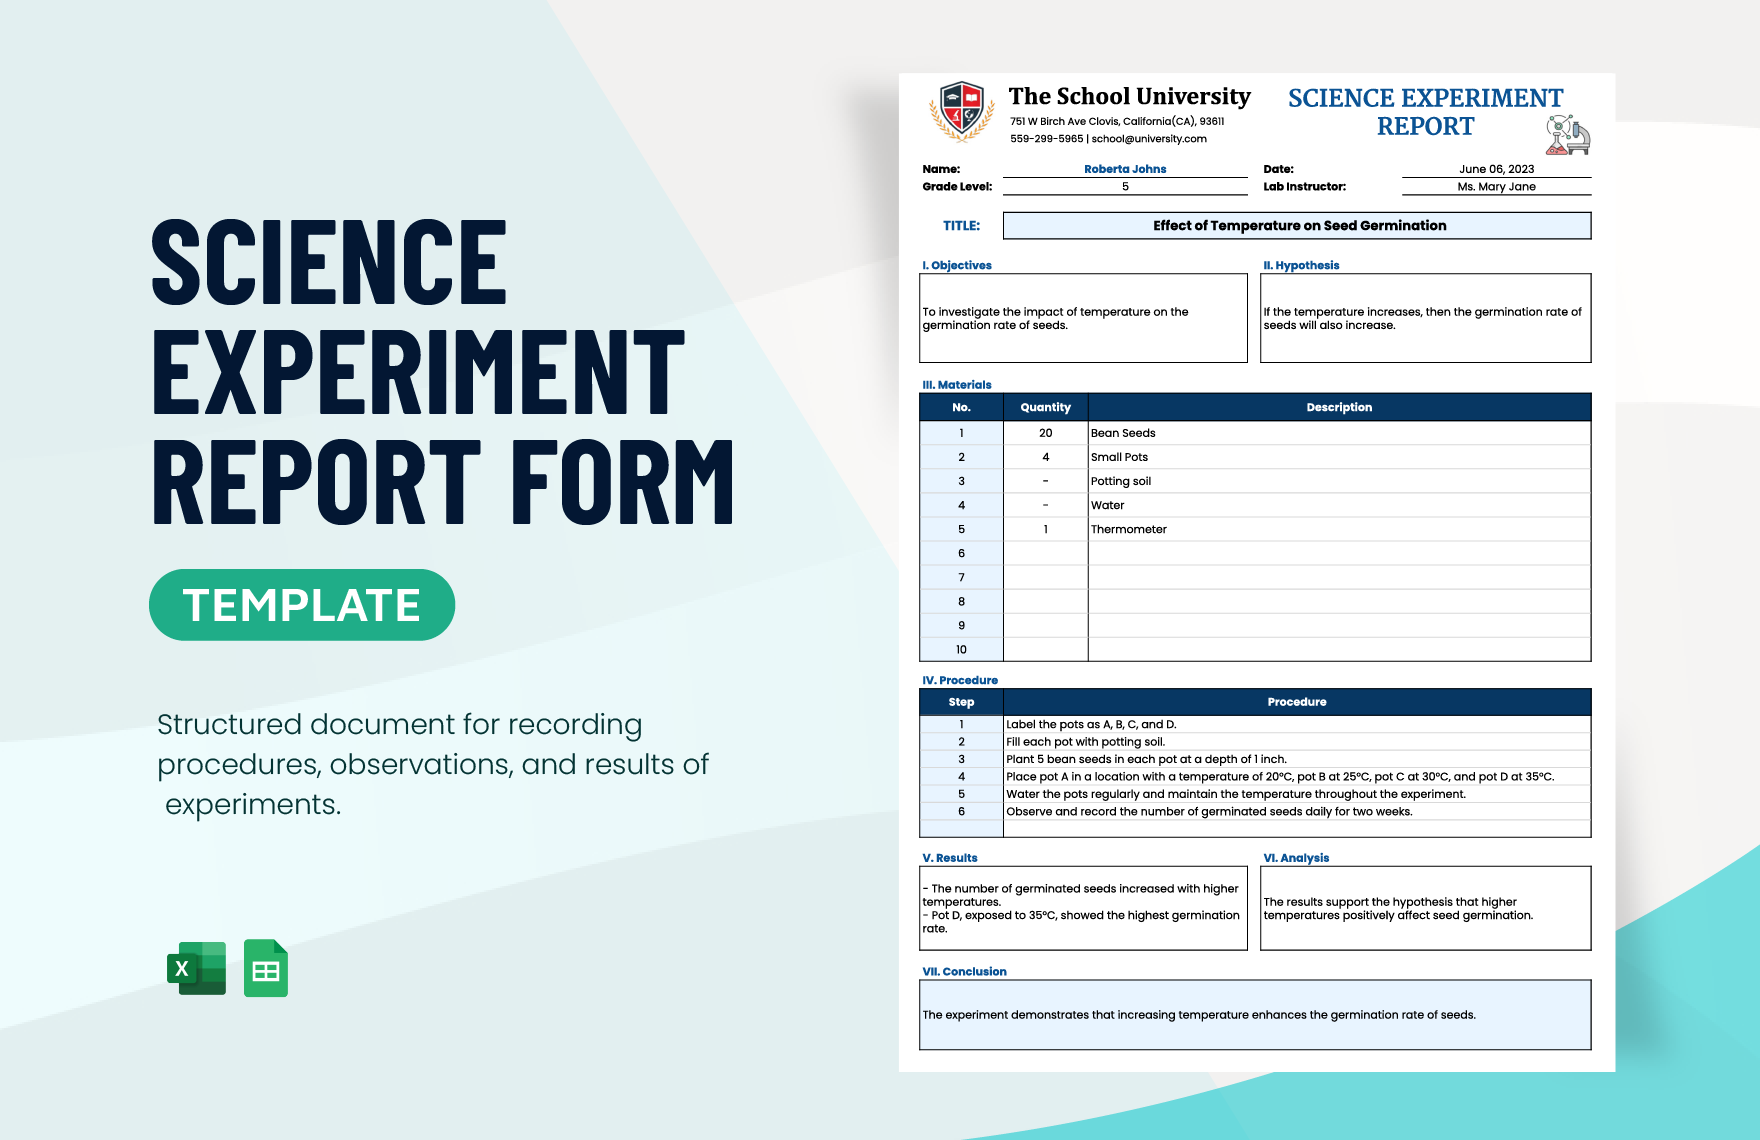
Imagine you’re tasked with testing how different concentrations of salt affect the boiling point of water. Your hypothesis: “Increasing salt concentration will raise the boiling temperature.” Below is a concise walkthrough of how each template section would be filled out.
Title and Abstract
Title: “Impact of Sodium Chloride Concentration on Water Boiling Point”
Abstract: A 200‑word summary describing the experimental setup (five salt solutions ranging from 0 % to 5 % w/v), the measurement method (digital thermometer with ±0.1 °C accuracy), key results (boiling point increased by 0.5 °C per 1 % salt), and conclusion (hypothesis supported, with noted experimental error).
Introduction
Begin with the relevance of boiling point elevation in cooking, industrial processes, and colligative properties. Cite classic thermodynamics texts, then present the specific research question and hypothesis.
Materials and Methods
- Distilled water (500 mL)
- Sodium chloride (analytical grade)
- Digital thermometer (±0.1 °C)
- Heat‑resistant beaker (1 L)
- Stirring rod
Procedure: Dissolve measured amounts of salt to achieve desired concentrations, heat each solution on a calibrated hot plate, stir continuously, and record the temperature at which a steady rolling boil is observed. Repeat three times per concentration.
Results
Table 1 presents average boiling points for each concentration. Figure 1 depicts a linear trend line with R² = 0.98, indicating strong correlation.
Discussion
The observed temperature rise aligns with colligative theory, which predicts a proportional relationship between solute concentration and boiling point elevation. Discuss minor deviations due to heat loss and thermometer calibration drift. Suggest using a calorimeter for higher precision in future trials.
Conclusion
The experiment confirms that salt raises water’s boiling point, supporting the hypothesis. The template helped organize data efficiently, making the analysis straightforward and the report clear.
Tips for Maintaining and Evolving Your Template Over Time
Periodic Review
At the end of each semester, revisit the template. Gather feedback from teachers or peers about sections that felt redundant or confusing. Update placeholder text, adjust table styles, or add new sections such as “Data Modeling” if you’ve started incorporating software tools.
Incorporate Digital Tools
Link your template to spreadsheet programs (Excel, Google Sheets) for automatic chart generation. Use conditional formatting to highlight outliers directly in the results table. If you’re comfortable with LaTeX, consider a hybrid approach where the main document is in Word but equations and complex tables are generated via LaTeX snippets.
Version Control
Store the template in a cloud folder with version history (OneDrive, Google Drive) so you can revert to earlier drafts if needed. Adding a version number in the file name (e.g., “Science_Experiment_Report_Template_v2.3”) helps track improvements.
Conclusion
A well‑crafted Science Experiment Report Template does more than satisfy grading rubrics; it cultivates disciplined thinking, improves communication, and streamlines the entire research process from hypothesis to final presentation. By understanding each essential component, customizing the layout for your discipline, and avoiding common pitfalls, you’ll produce reports that are both scientifically rigorous and visually compelling. Keep refining your template, embrace feedback, and let each completed experiment reinforce the habit of clear, concise, and confident scientific writing.






Related posts of "Science Experiment Report Template"
