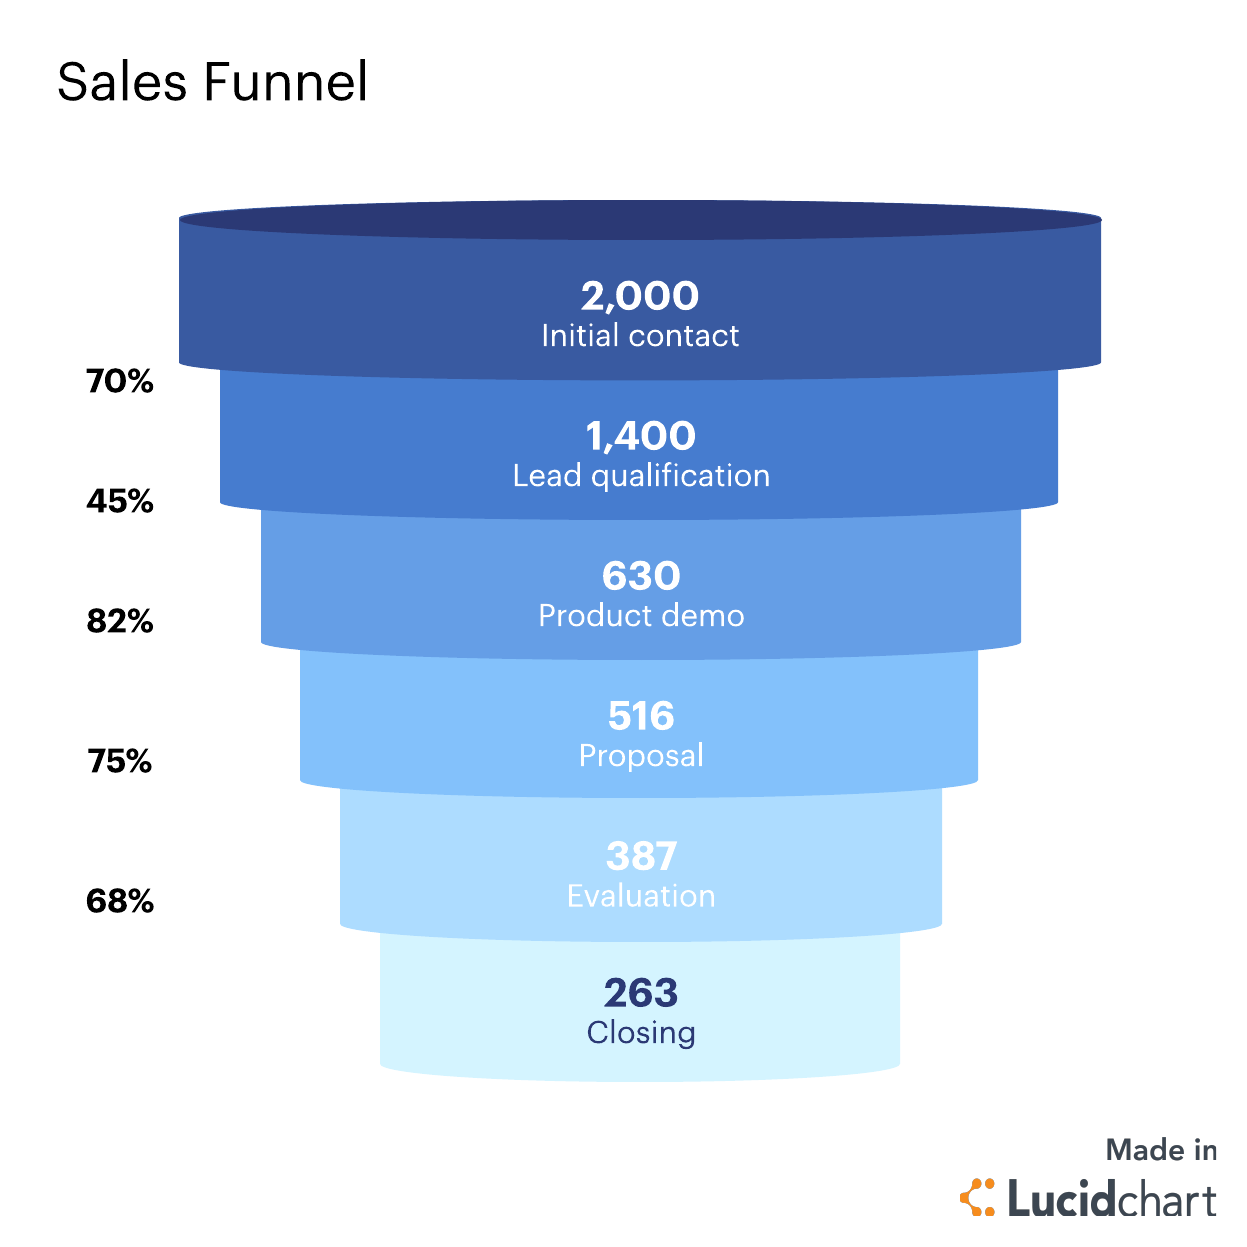
Sales Funnel Report Template is the backbone of any data-driven marketing strategy, turning raw numbers into actionable insights that guide every touchpoint of customer acquisition. By structuring this template around the critical phases of the funnel—awareness, consideration, conversion, and retention—businesses can pinpoint bottlenecks, quantify ROI, and refine tactics with laser precision.
Understanding the Sales Funnel
Stages of a Funnel
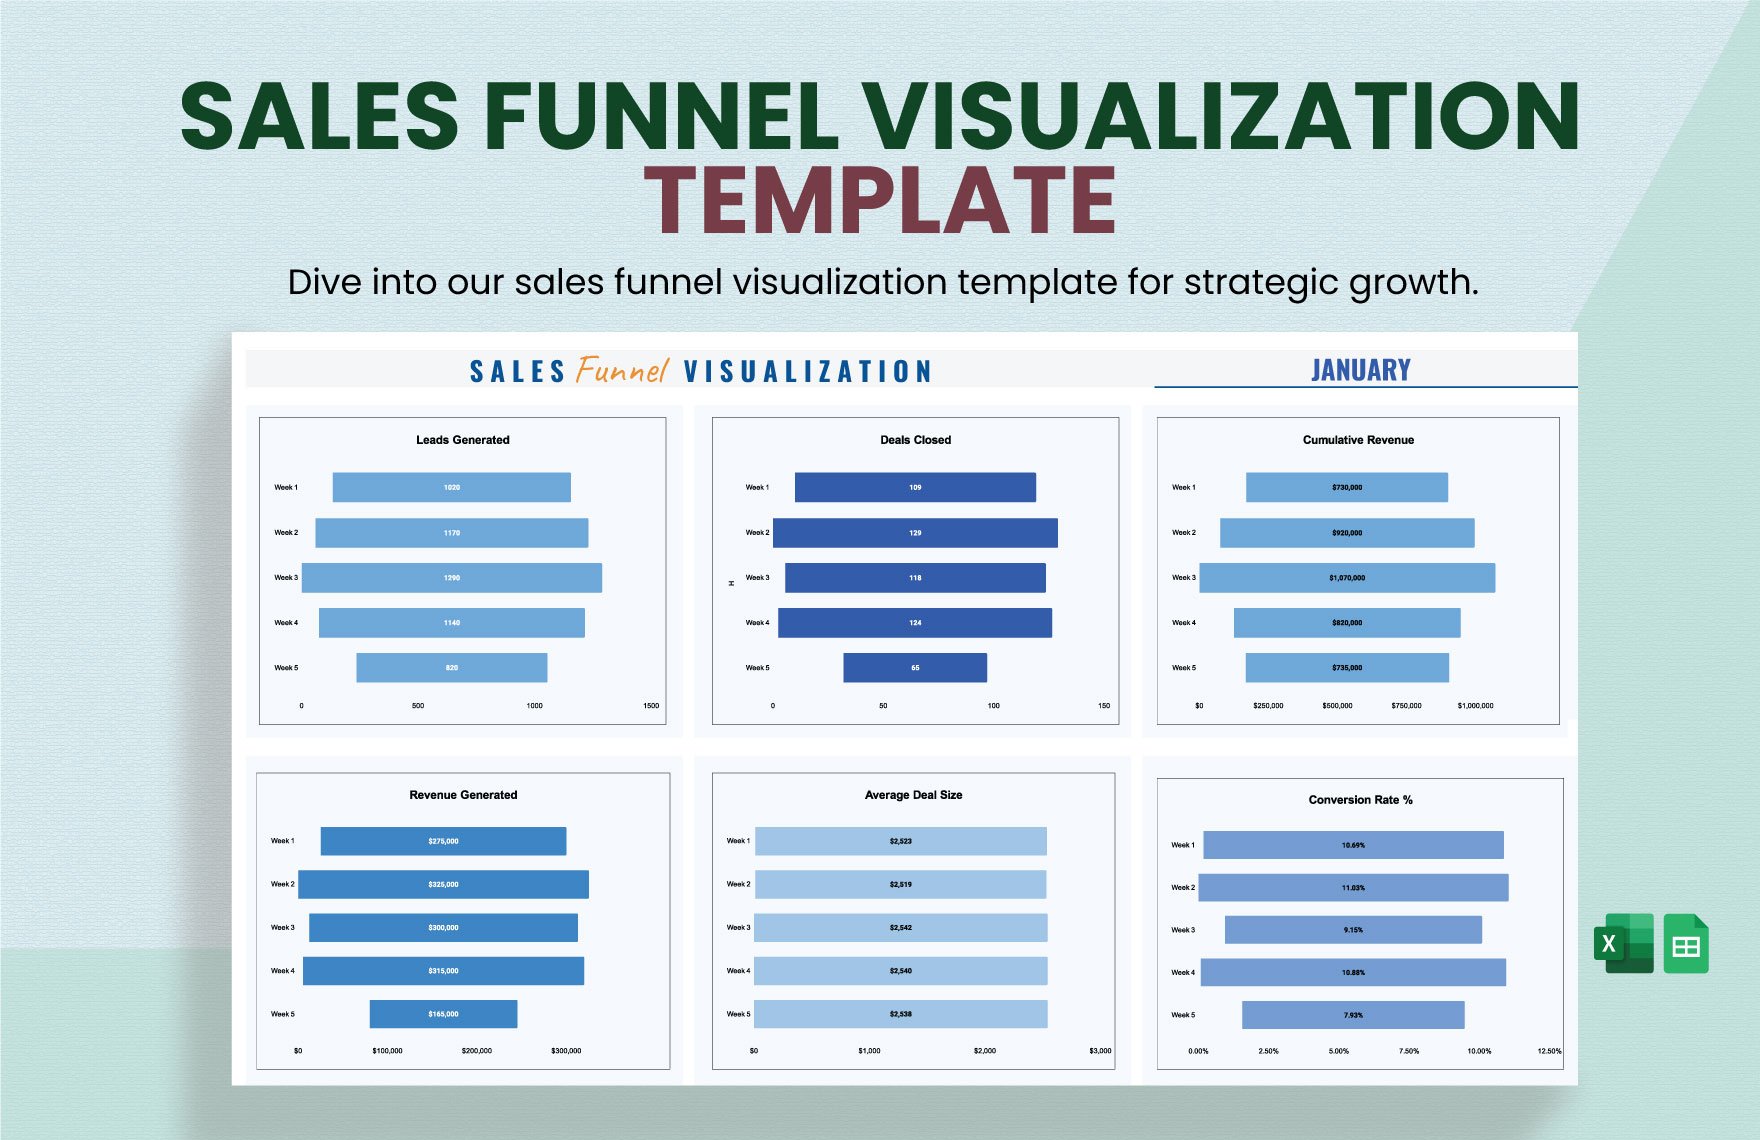
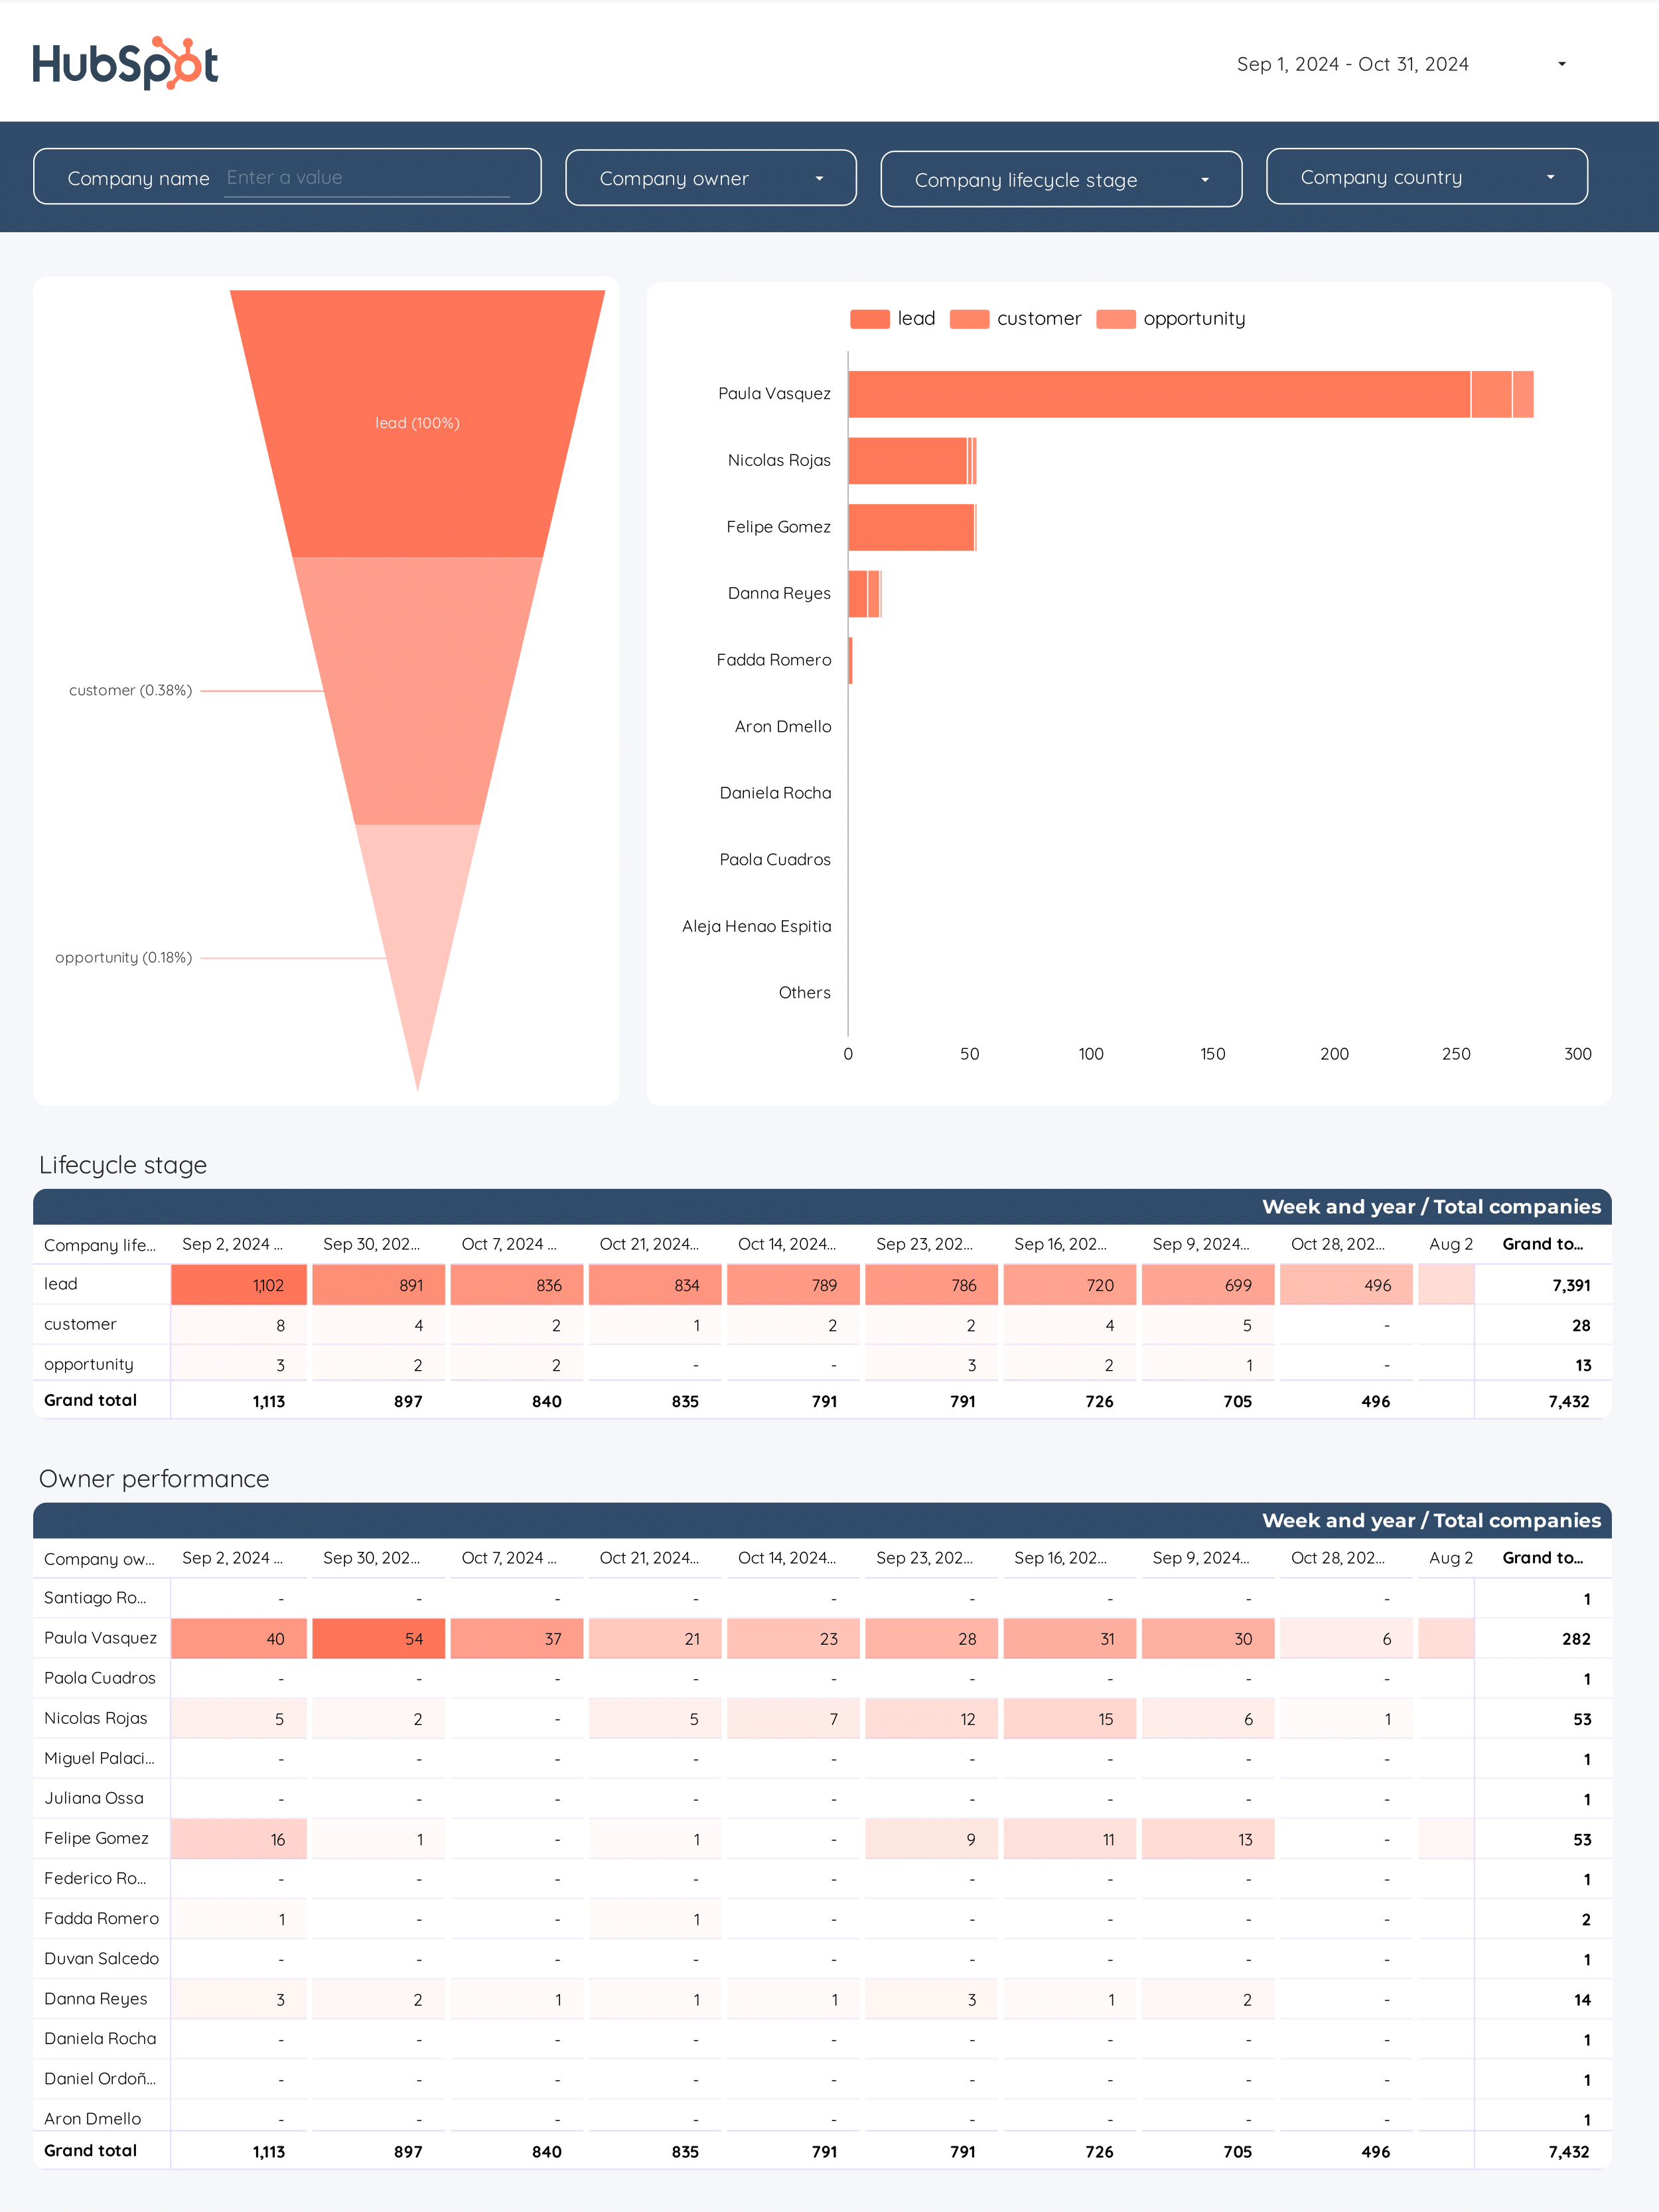
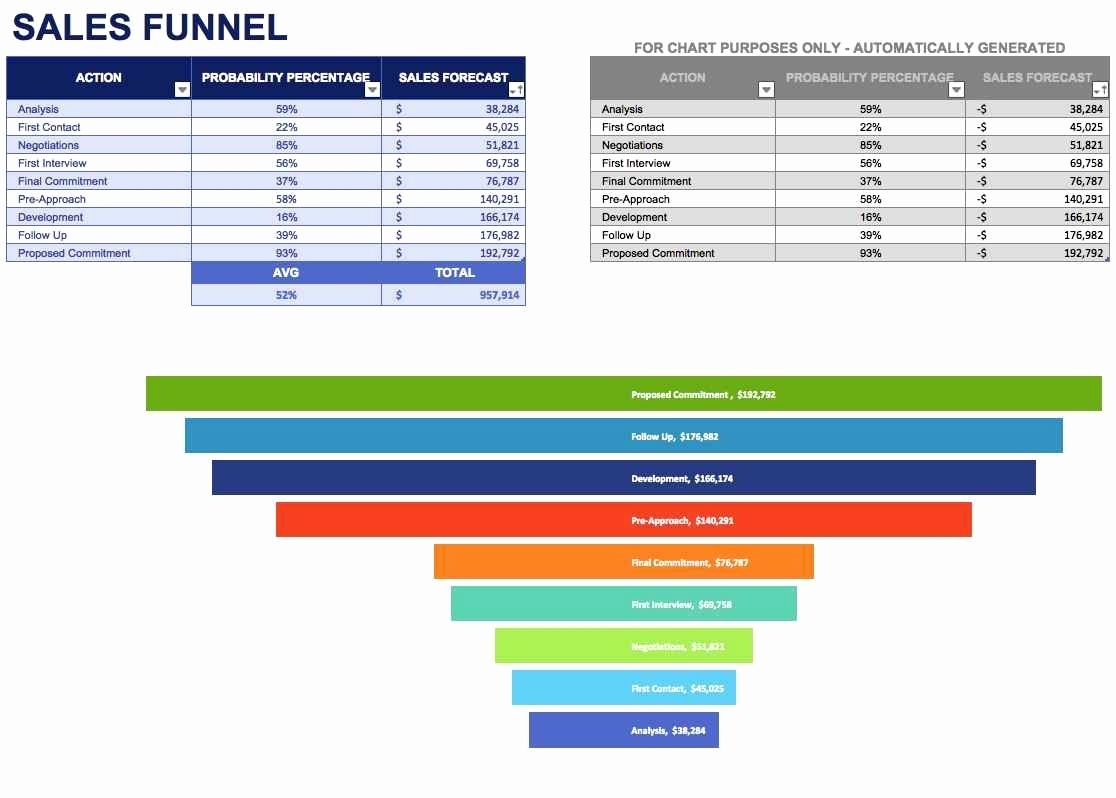
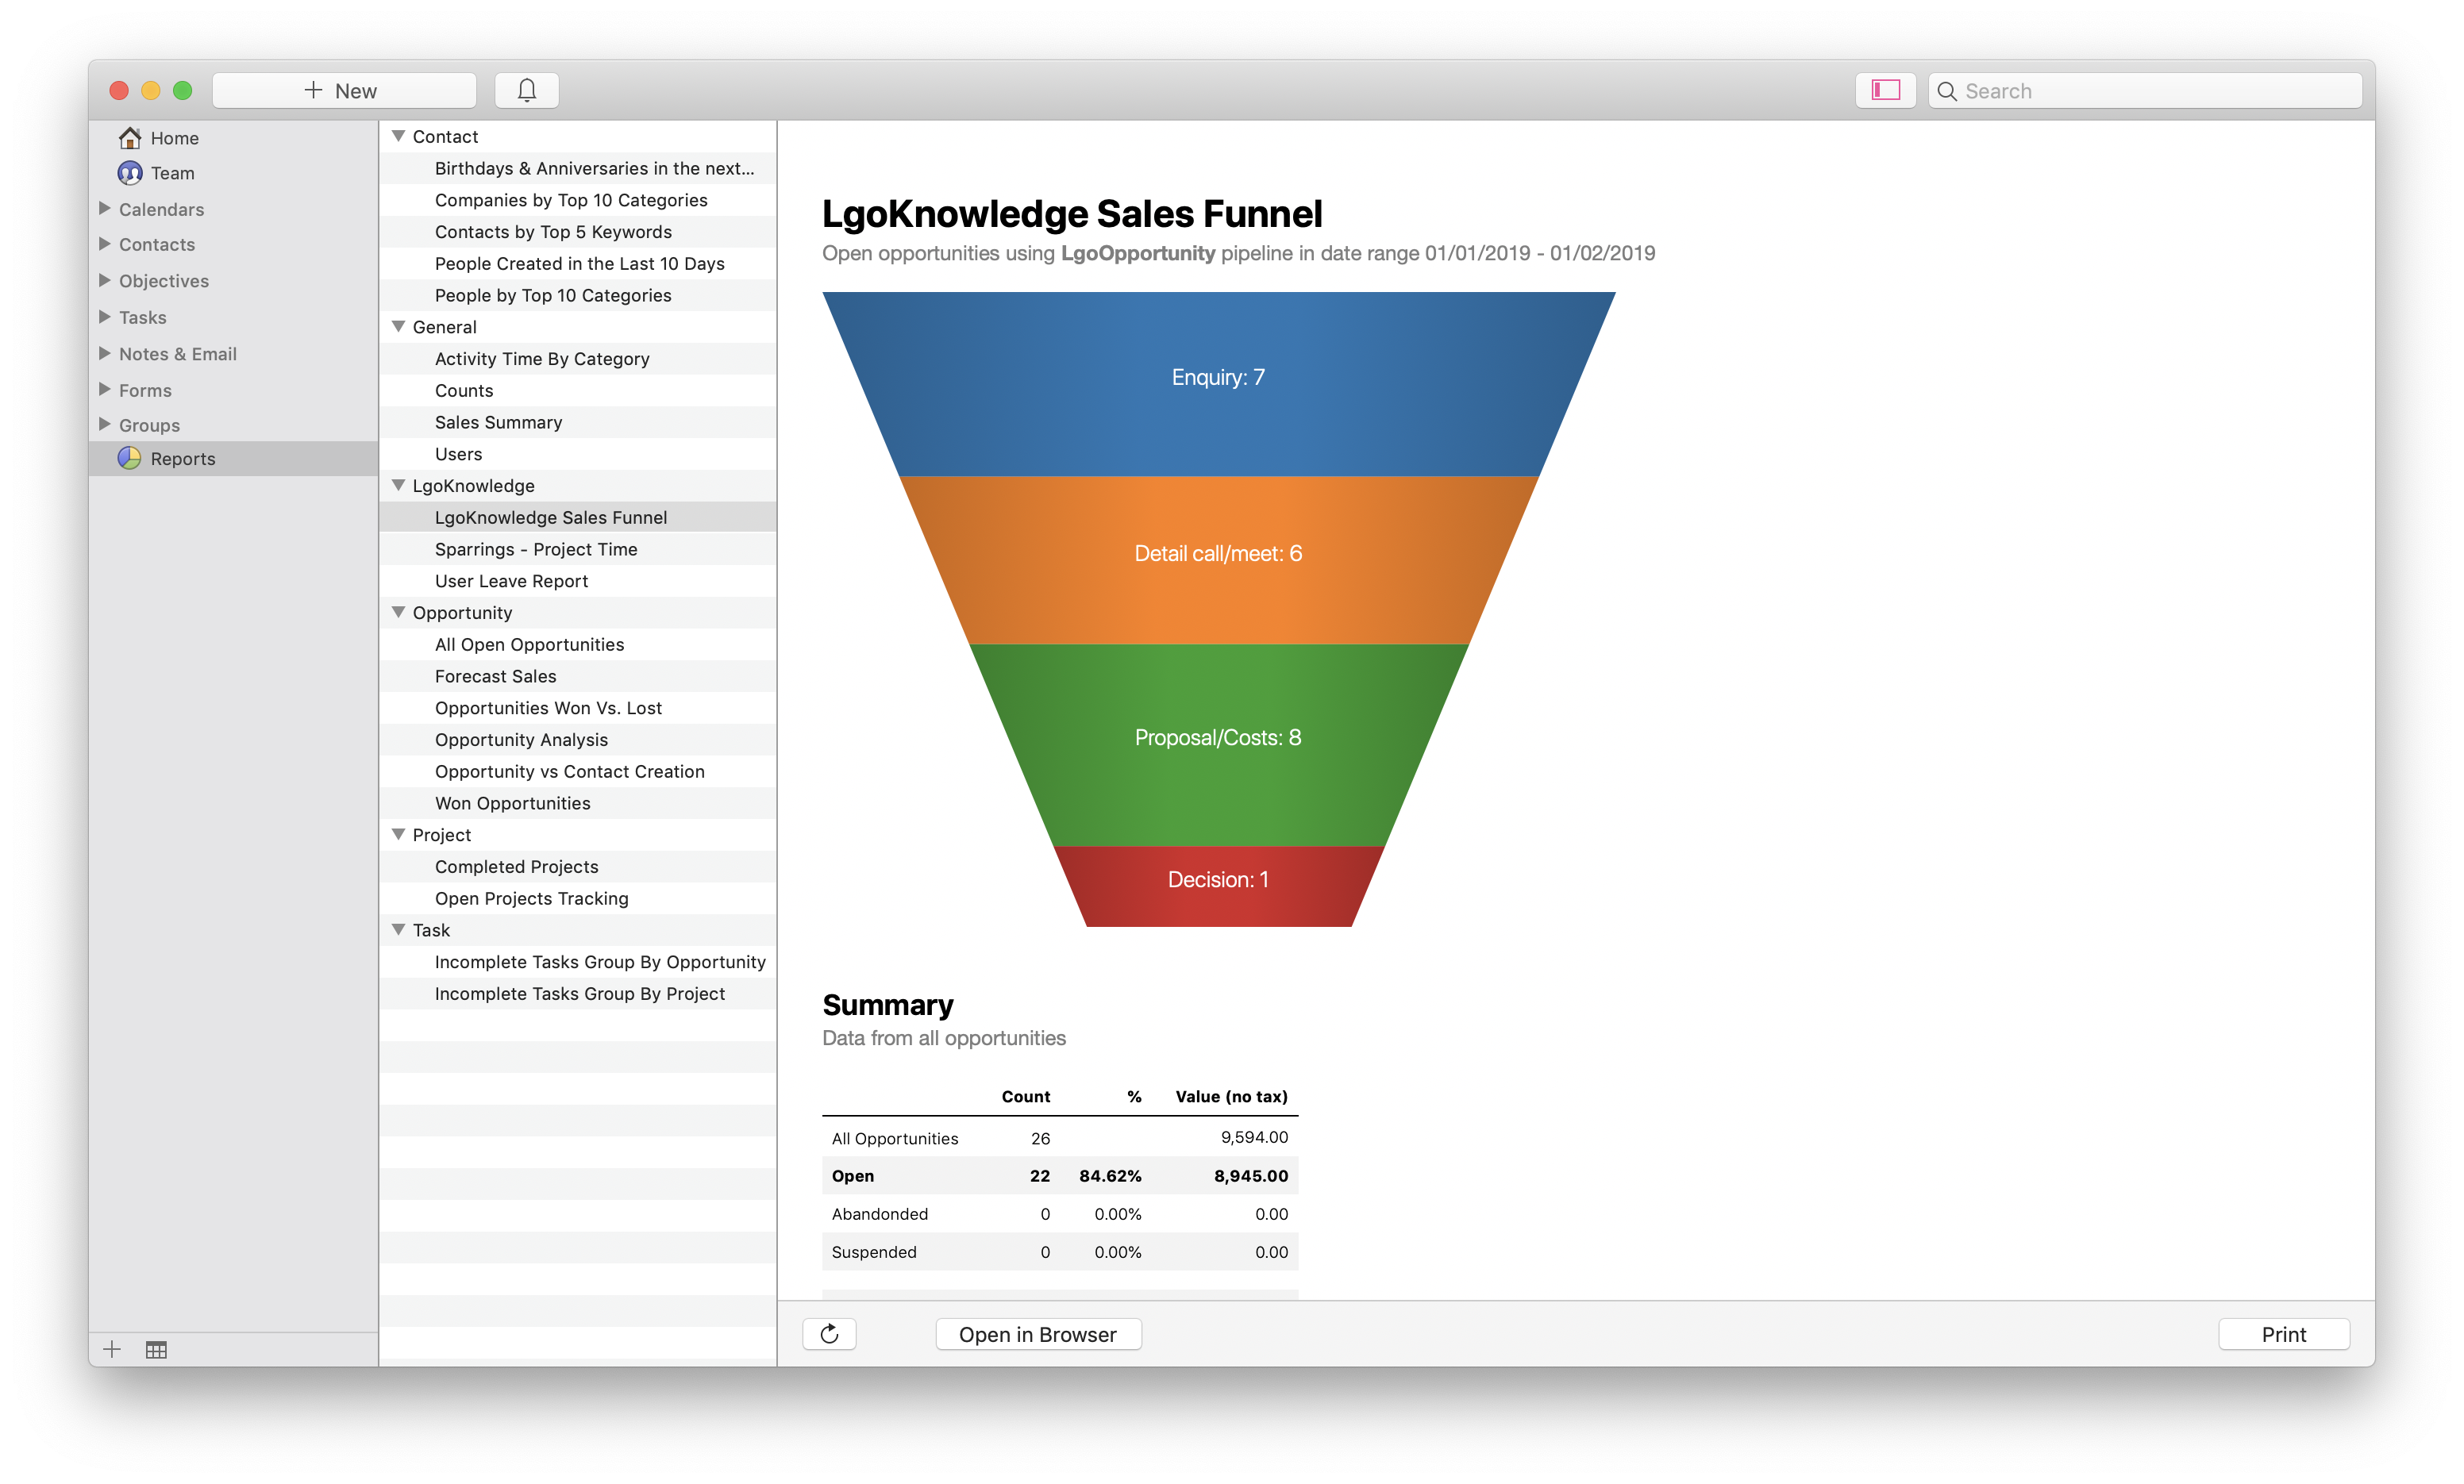
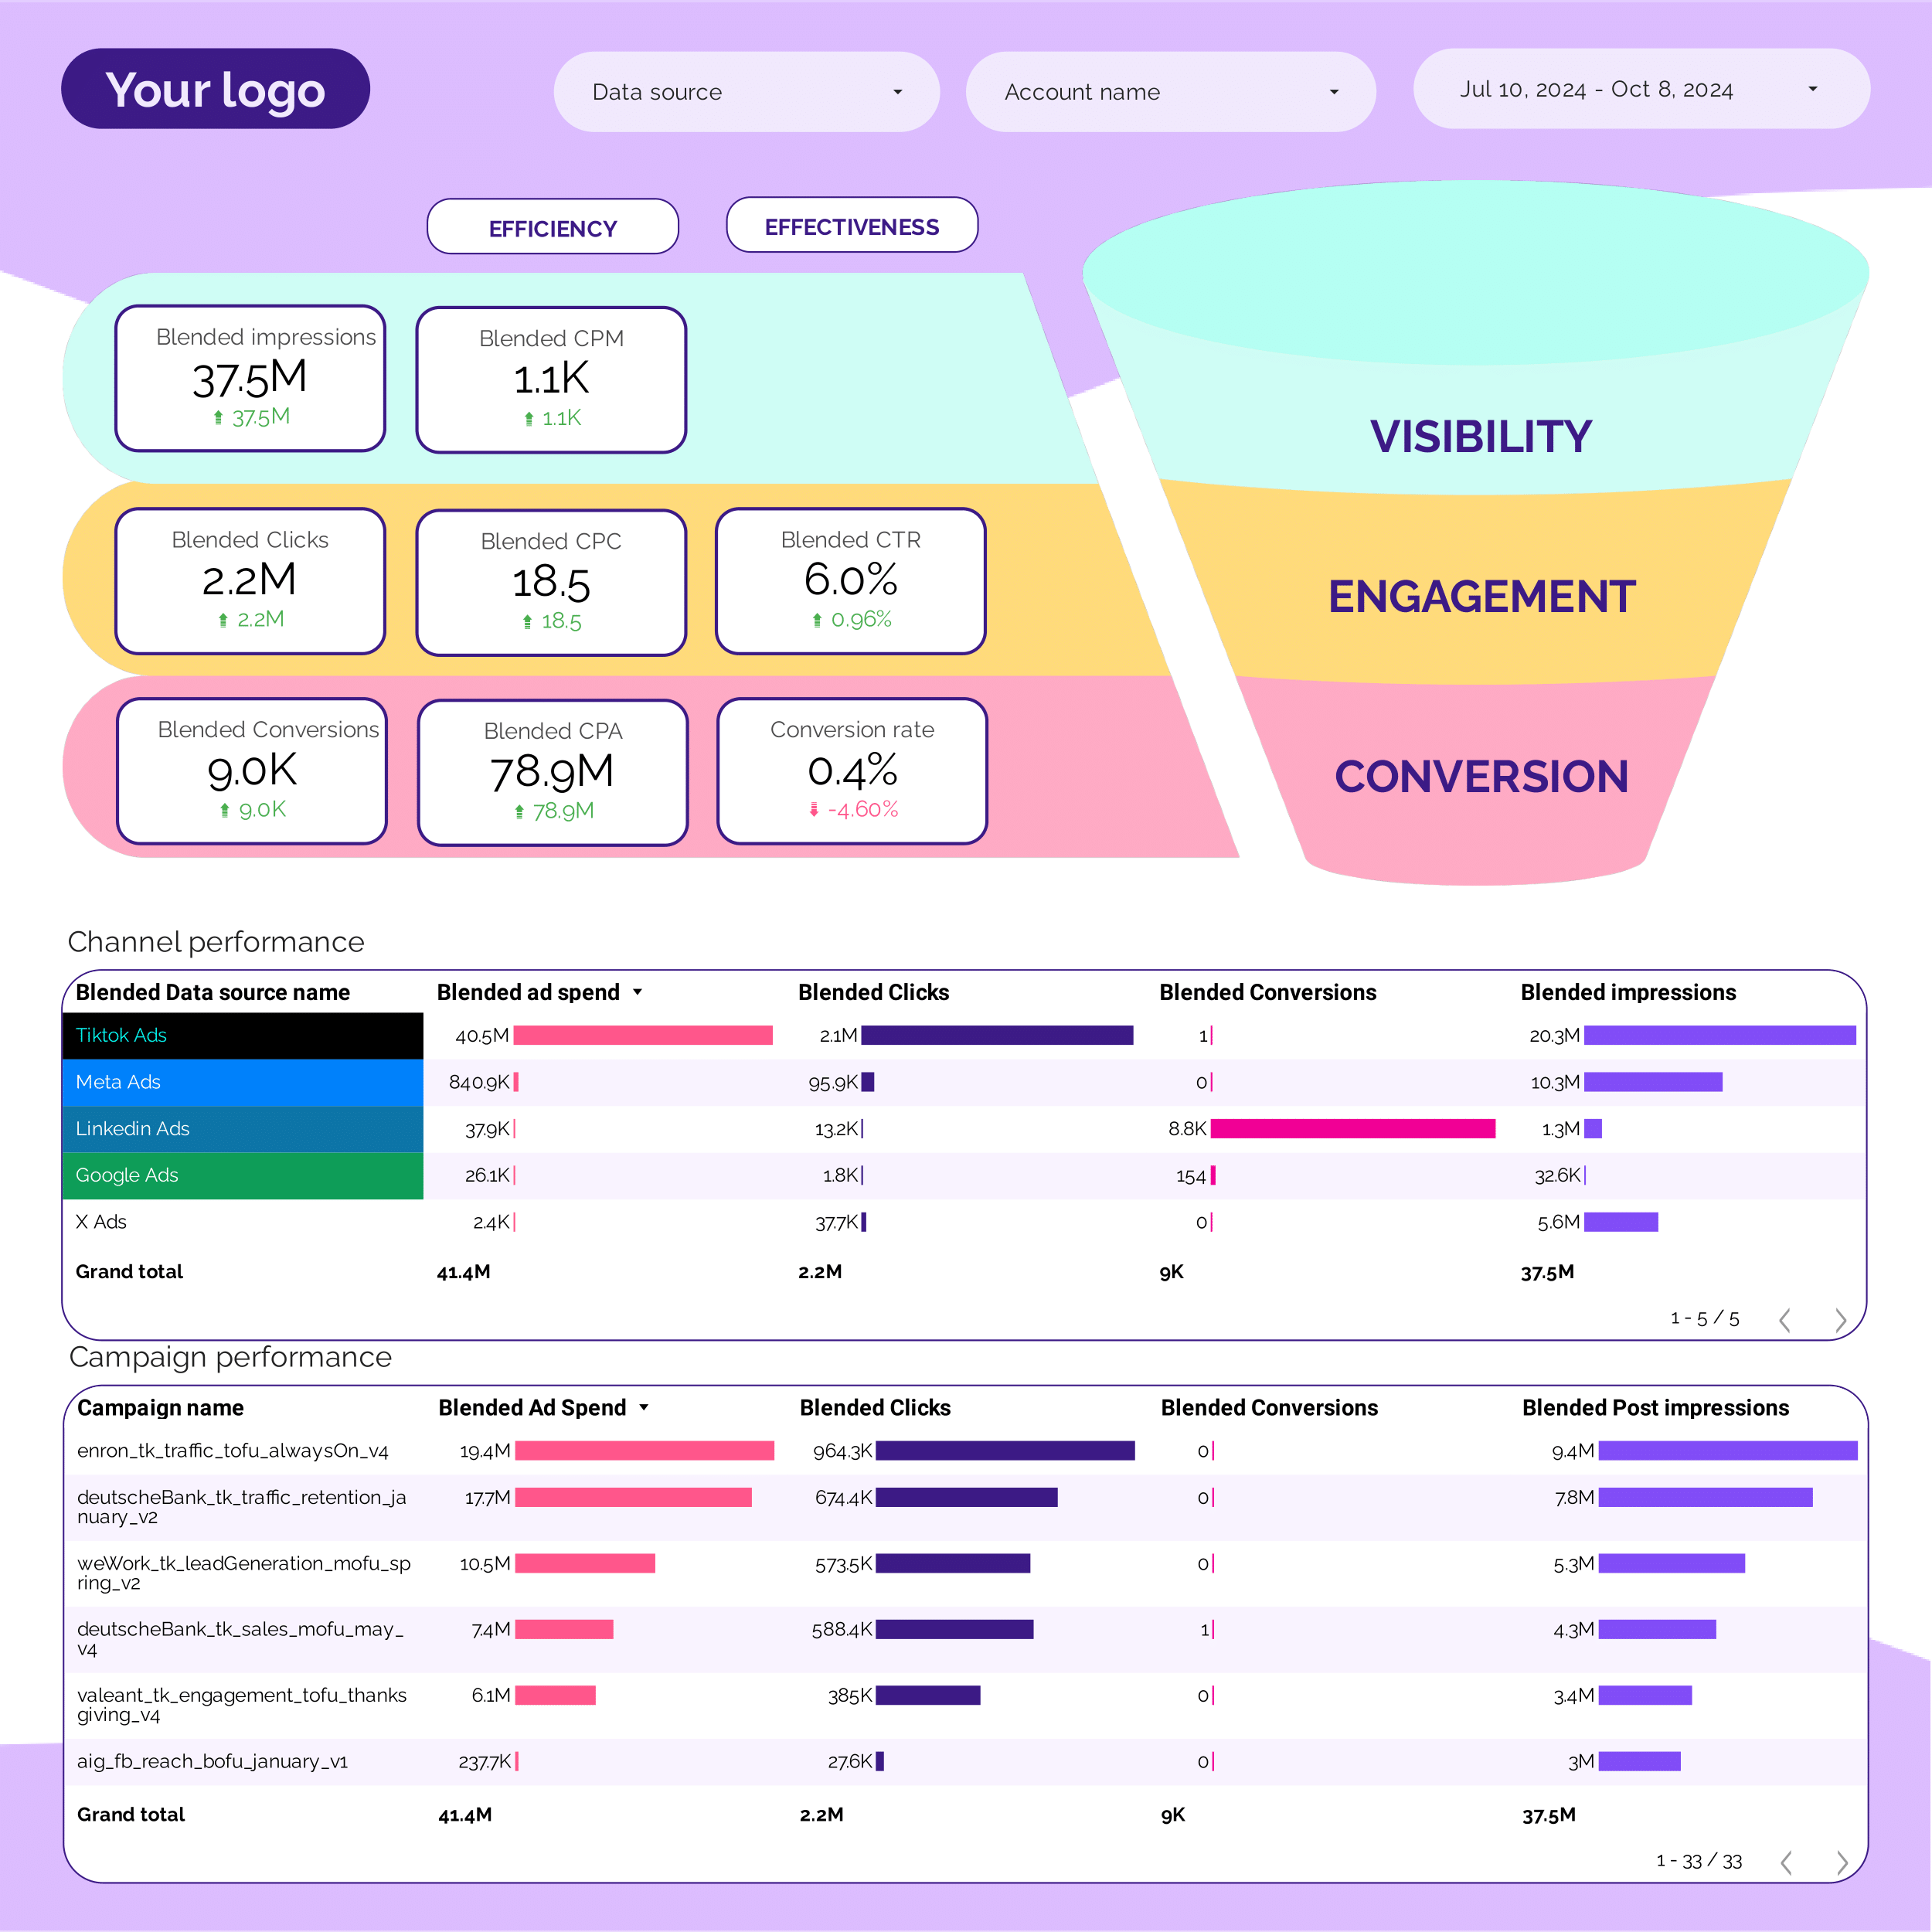
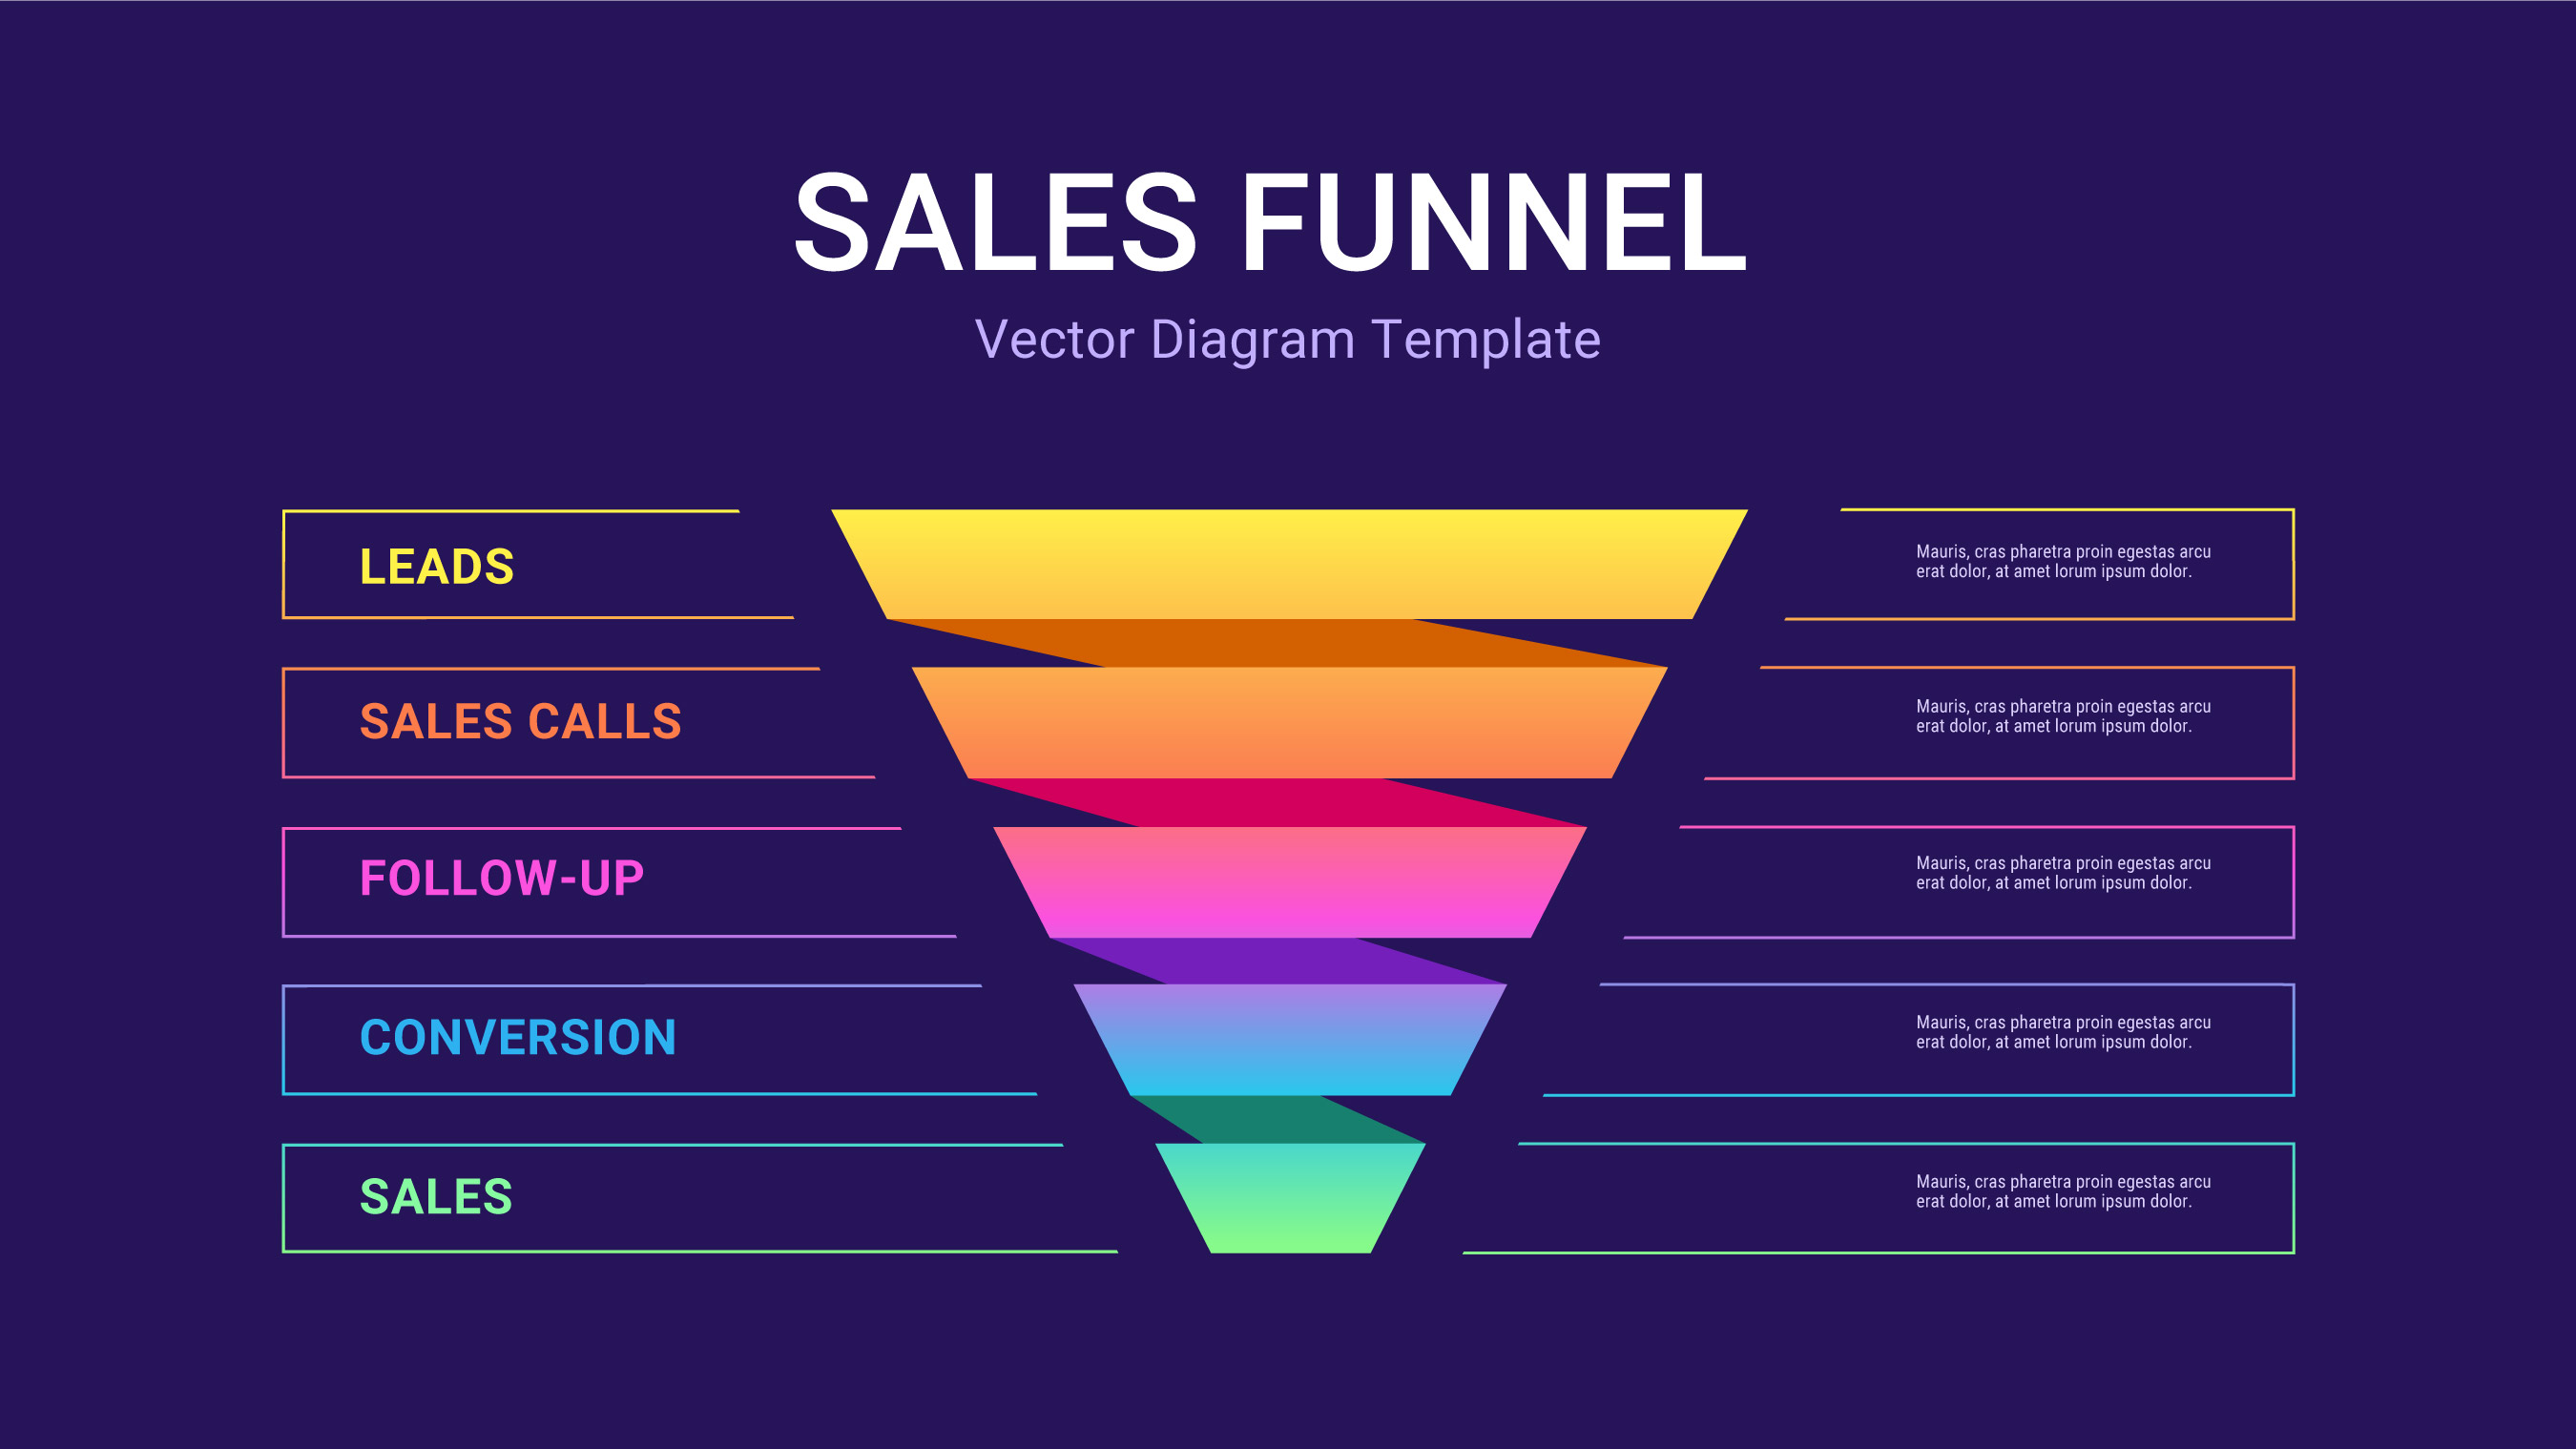
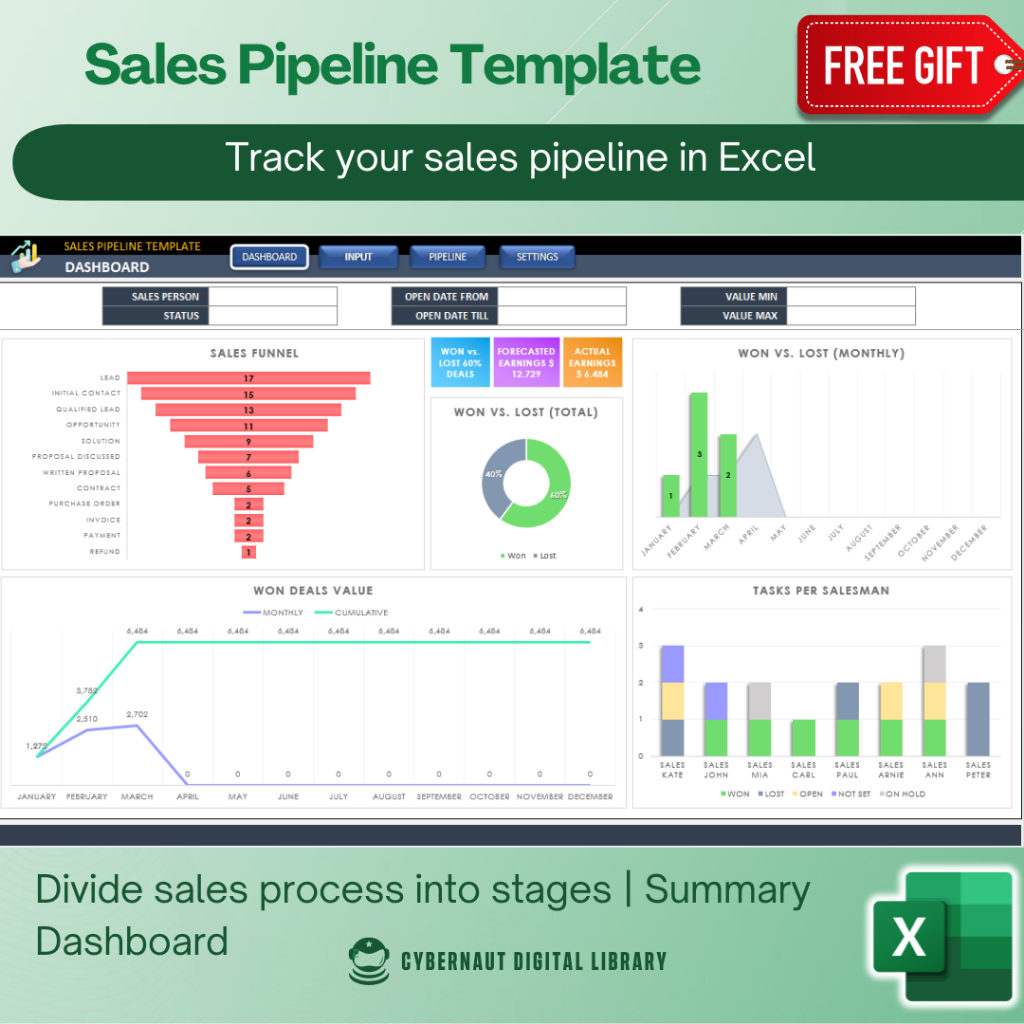
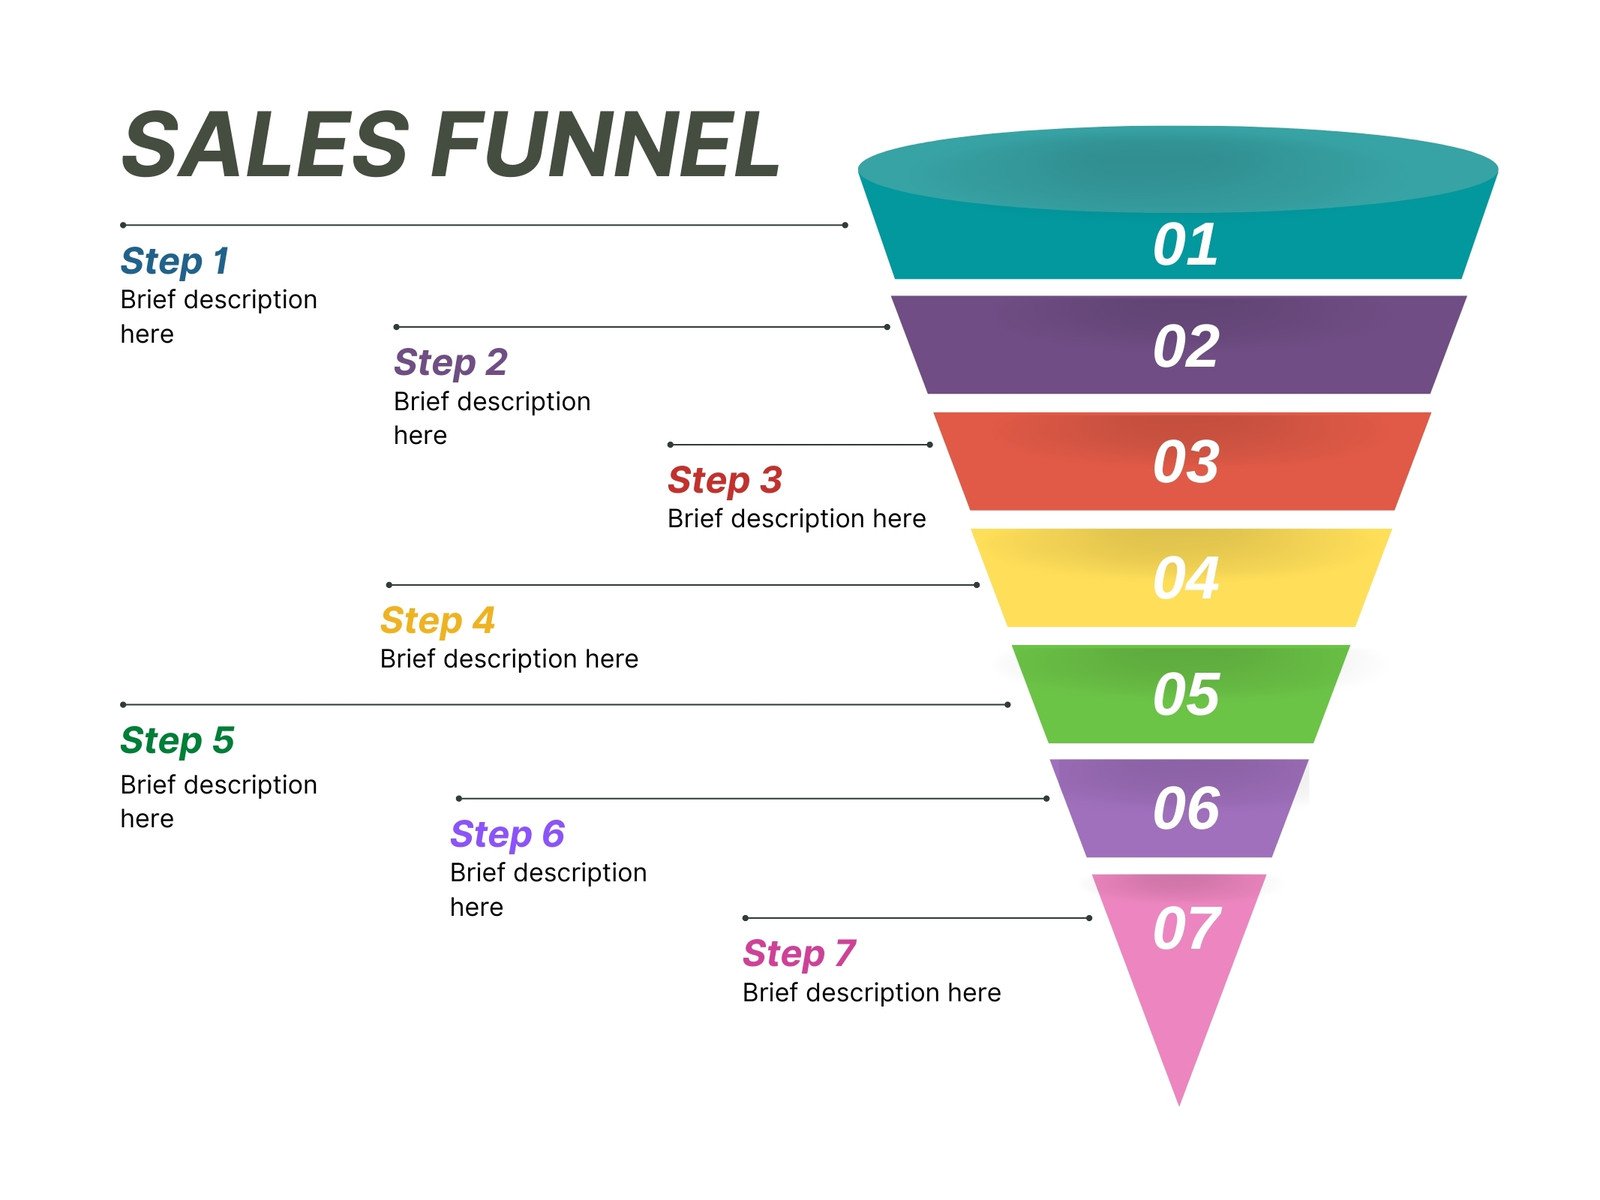
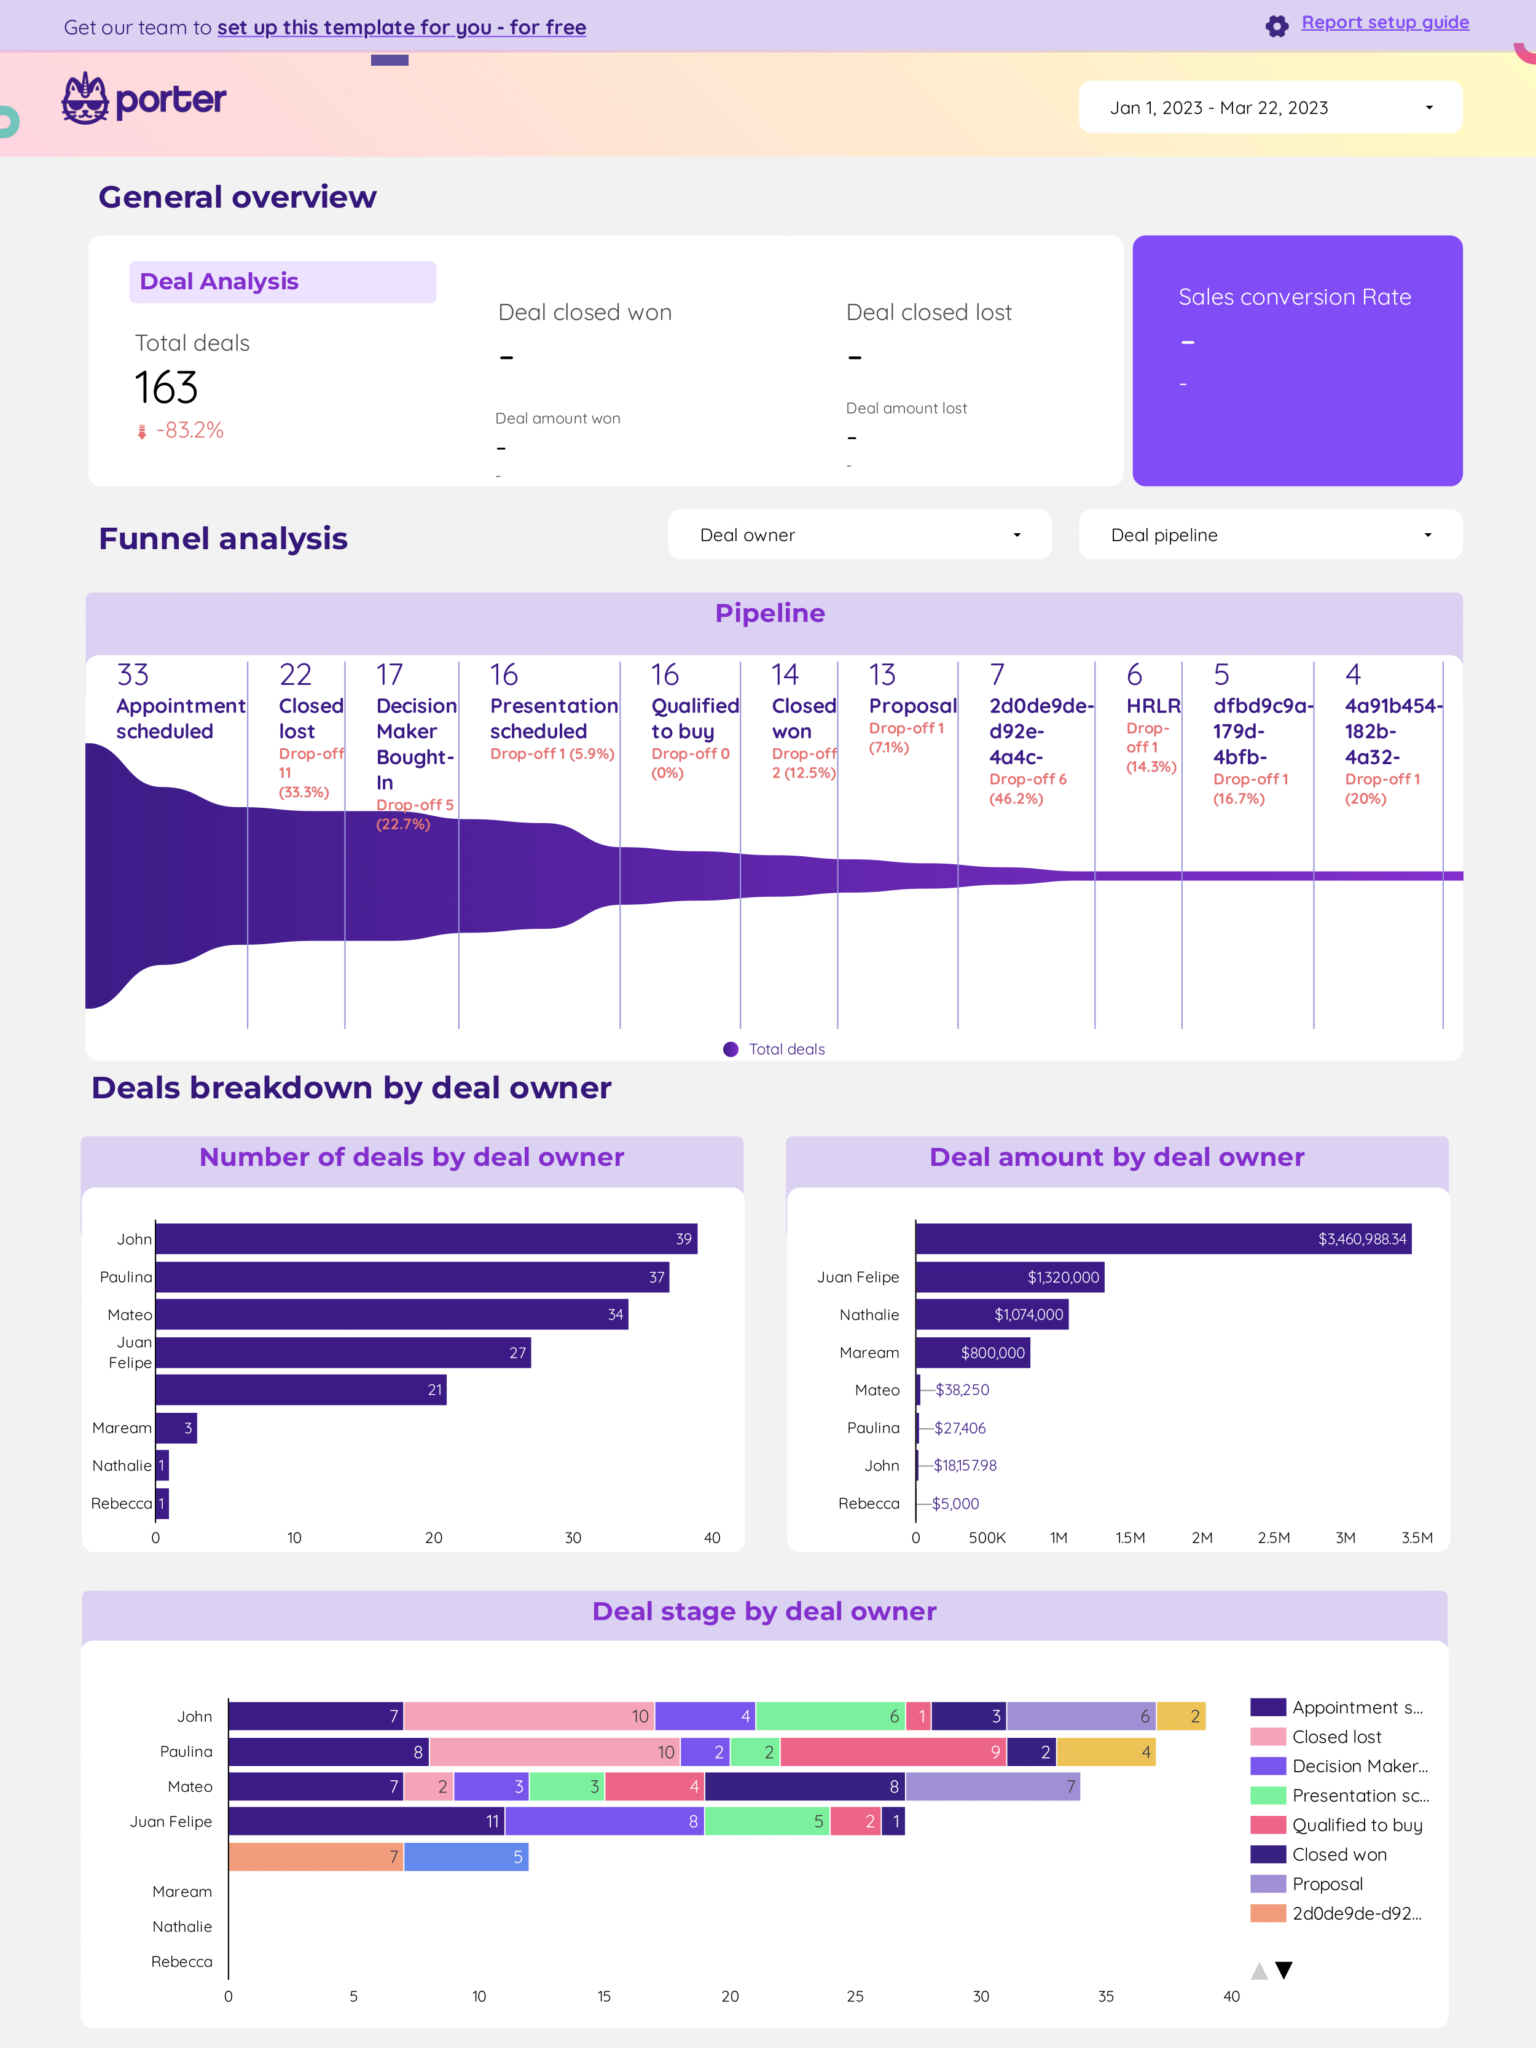
At its core, a sales funnel visualizes the customer journey as a series of progressively narrower stages. The top of the funnel captures broad exposure, the middle narrows to qualified leads, and the base represents closed sales. Each stage requires distinct metrics: reach for awareness, engagement for consideration, and conversion rate for the bottom. By aligning the template’s columns with these stages, marketers keep every metric contextually relevant.
Why Tracking Matters
Without granular tracking, campaigns feel like black‑box experiments. A well‑crafted funnel report exposes leakage points—such as a sudden drop in webinar registrations—allowing teams to test hypotheses and deploy fixes. Consistent data collection also establishes benchmarks, turning incremental improvements into measurable growth over time.
Key Metrics to Include in Your Template
Awareness Metrics
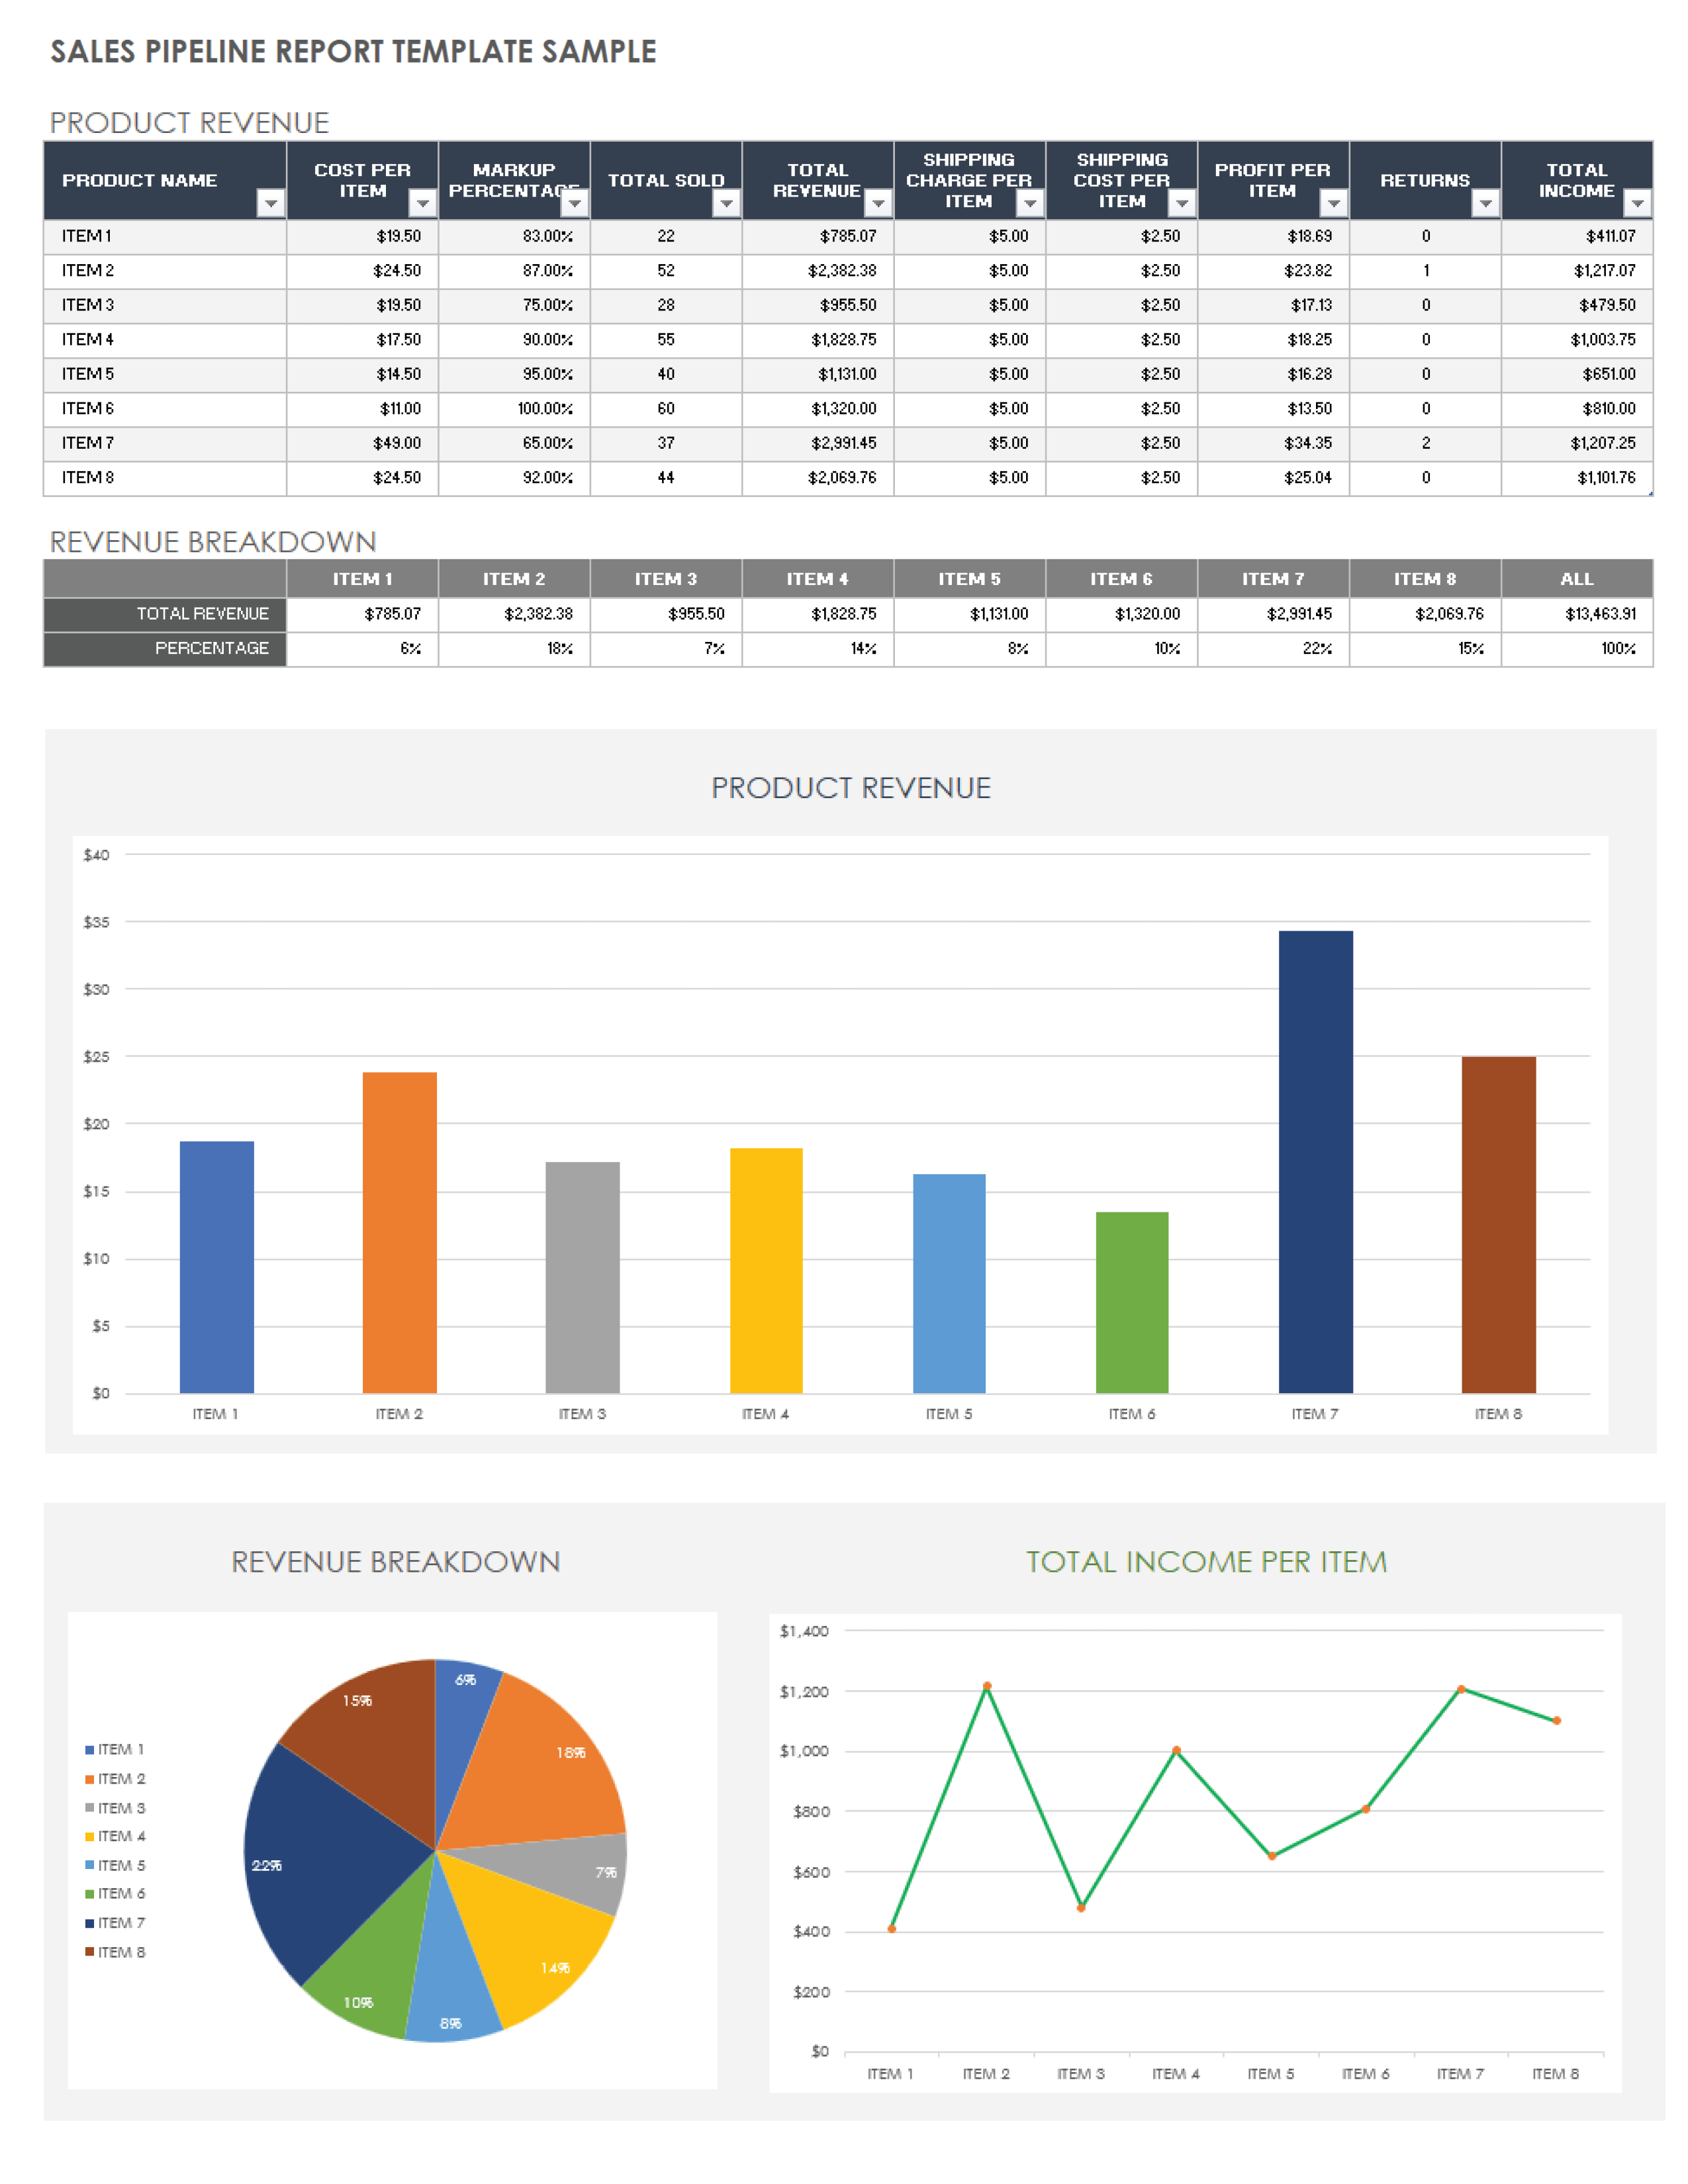
- Impressions: Total number of times content appears.
- Reach: Unique individuals exposed to the content.
- Click‑Through Rate (CTR): Engagement relative to reach.
Consideration Metrics
- Lead Qualification Score: Weighted score reflecting readiness.
- Time to First Interaction: Speed of initial engagement.
- Content Downloads: Number of gated assets accessed.
Conversion Metrics
- Conversion Rate: Percentage of leads that close.
- Cost per Acquisition (CPA): Spend required to secure a customer.
- Average Deal Size: Revenue per closed sale.
Retention Metrics
- Churn Rate: Percentage of customers lost.
- Net Promoter Score (NPS): Customer advocacy level.
- Upsell/Cross‑Sell Revenue: Incremental income from existing clients.
Design Principles for a Black‑Toned Report
Color Palette and Contrast
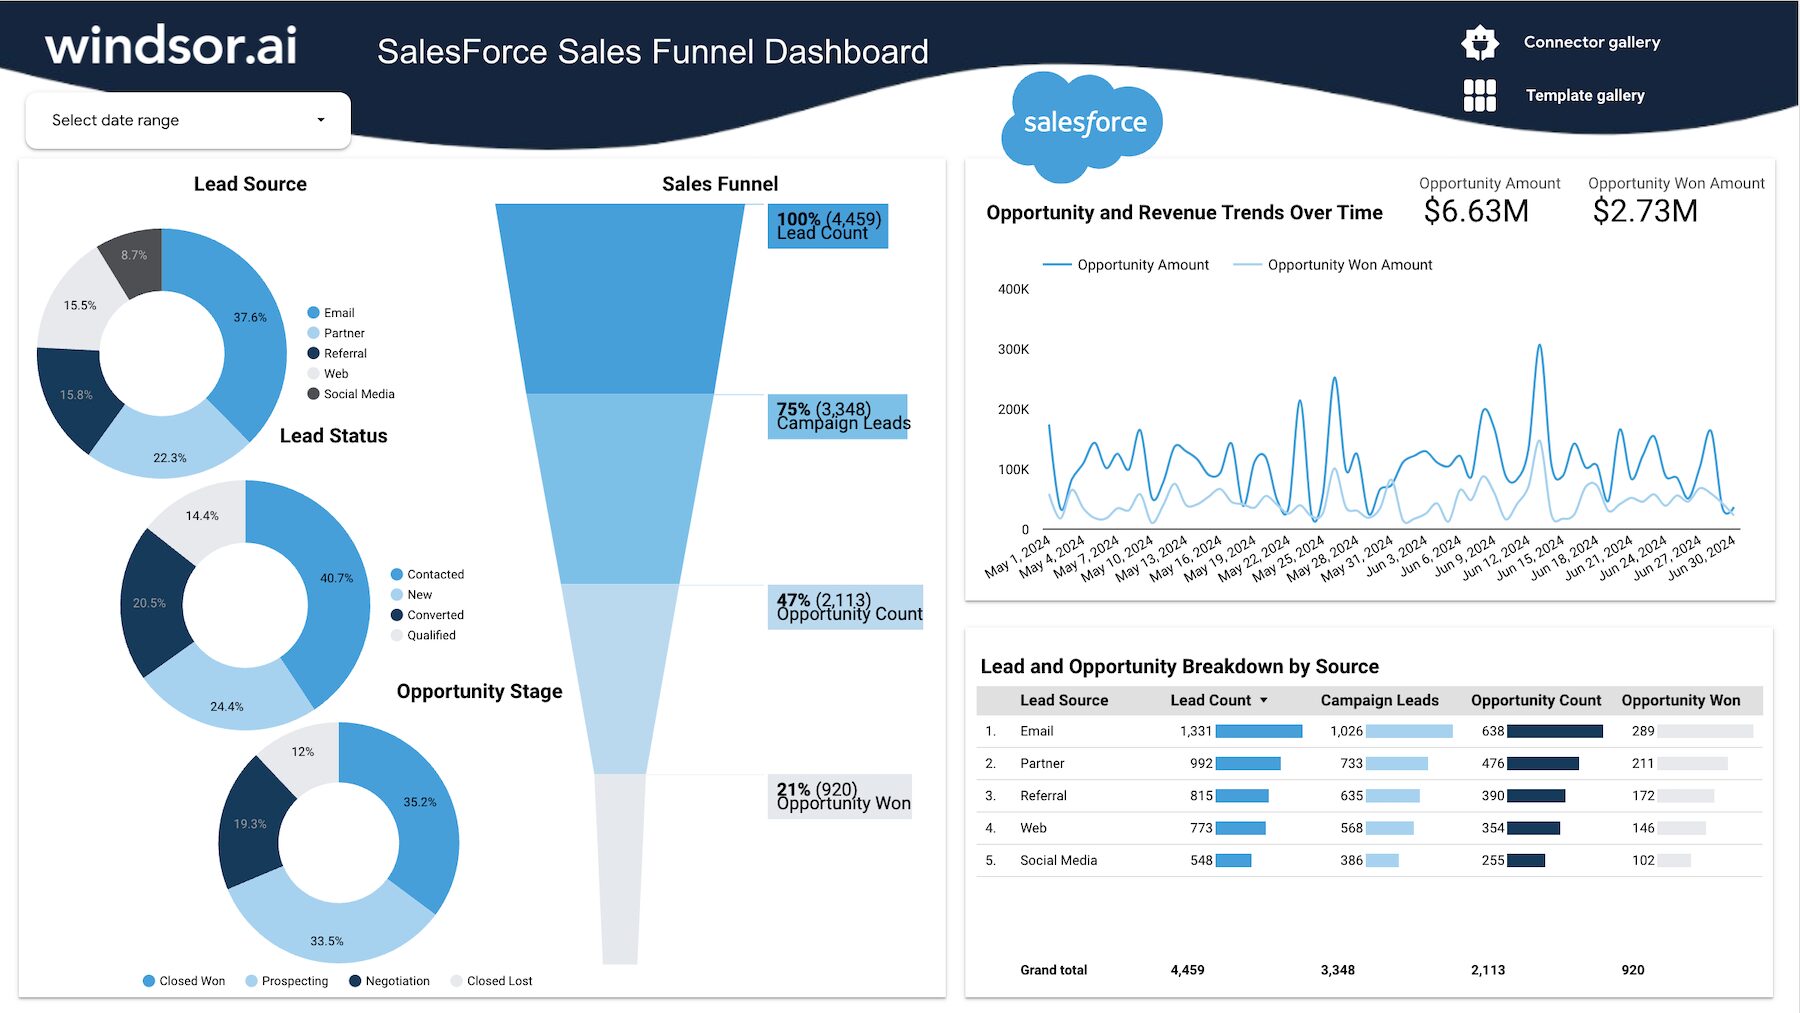
Use a dark slate background with high‑contrast text—white or muted gold—to ensure readability. Subtle accents in deep teal or charcoal can highlight key figures without breaking the monochrome aesthetic.
Typography Choices
Opt for sans‑serif typefaces like Helvetica or Gotham for headings, paired with a legible serif such as Garamond for body text. Maintain consistent font weights: bold for headings, regular for data, and light for notes.
Visual Hierarchy and Layout
Employ grid systems to align charts, tables, and KPI boxes. White space, even in a dark theme, prevents visual clutter and guides the reader’s eye across the report’s logical flow.
Step‑by‑Step Guide to Building Your Template

Choose Your Tool
While Excel and Google Sheets are accessible, design‑heavy templates benefit from Canva’s drag‑and‑drop interface, which offers pre‑made charts and the ability to maintain brand consistency across multiple pages.
Layout and Structure
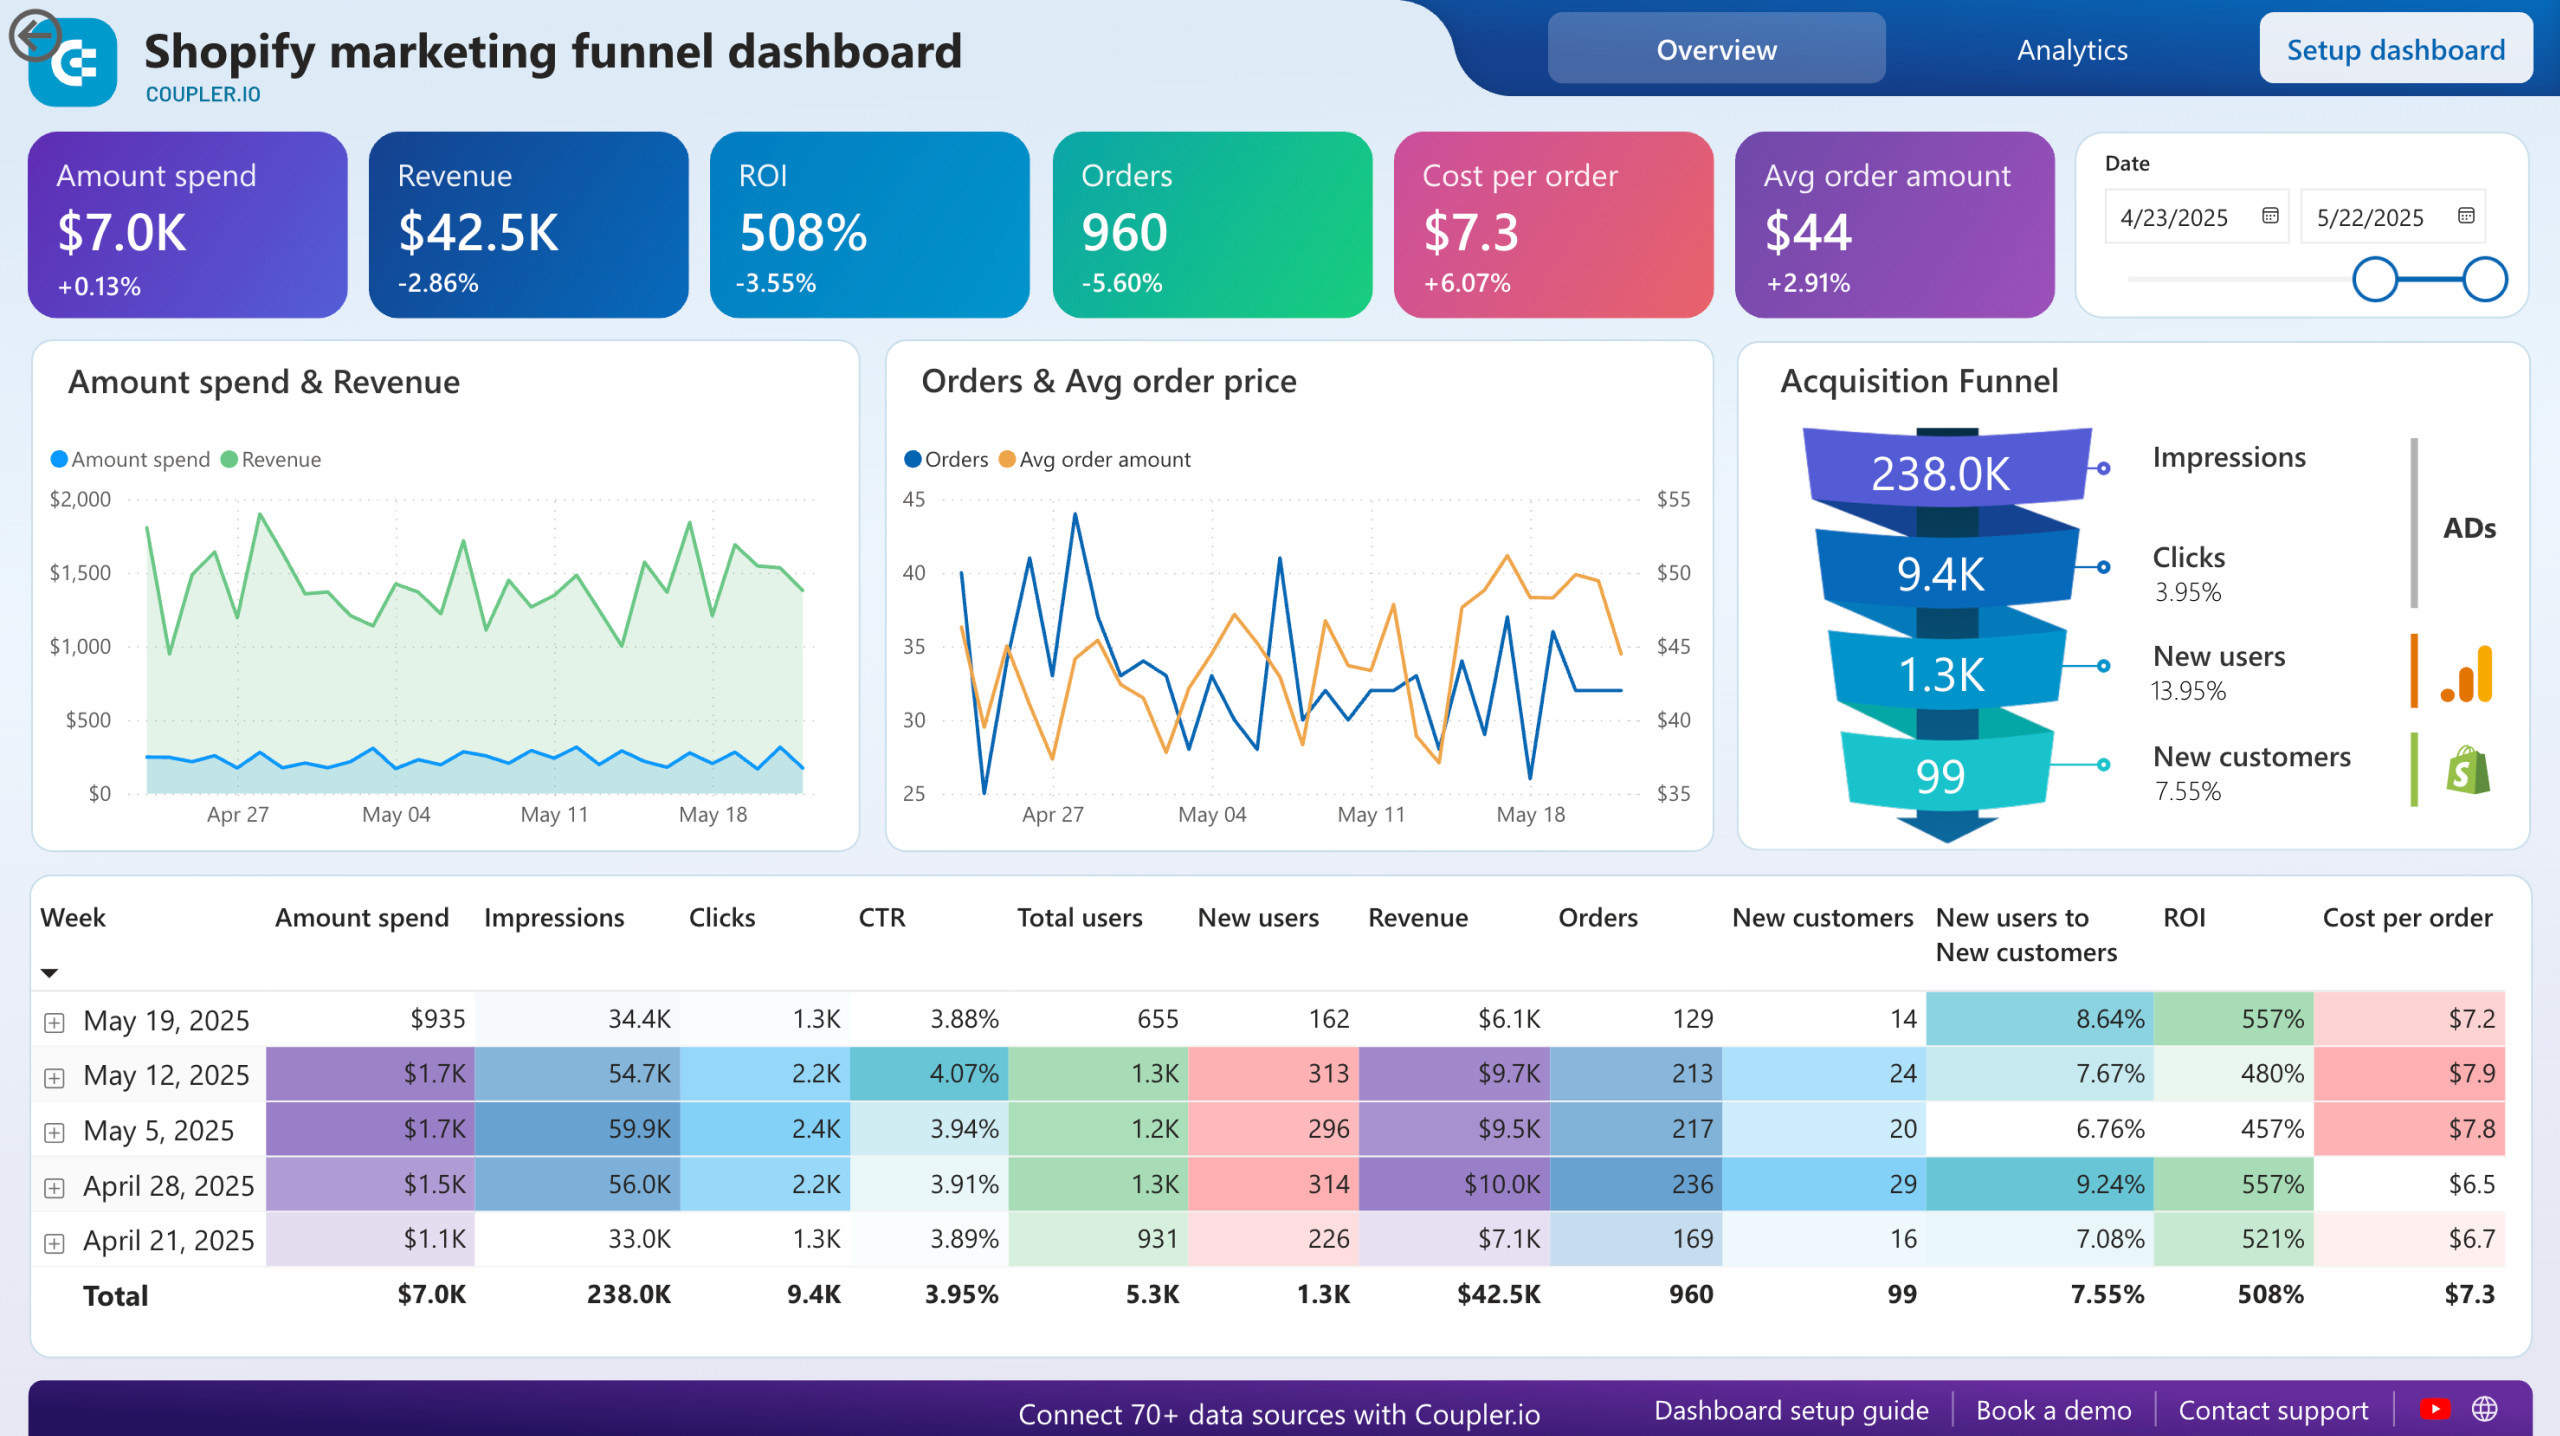
Begin with a title page featuring the company logo and the report period. Follow with a summary slide that highlights top‑level KPI changes. Subsequent pages should dedicate one full section to each funnel stage, embedding charts, tables, and narrative commentary.
Populate Data
Import raw data from CRM, marketing automation, and analytics platforms. Use pivot tables or data connectors to automate updates. Ensure data sources are clearly cited in a footer to reinforce credibility.
Analyze and Iterate
After presenting the metrics, include an analysis block where you interpret trends, suggest actions, and forecast next‑quarter expectations. Use conditional formatting to flag under‑performing metrics—such as a CPA increase—to prompt immediate attention.
Real‑World Examples and Case Studies

Example 1: SaaS Company
A SaaS startup implemented a funnel report that tracked trial sign‑ups, demo requests, and paid conversions. By spotlighting a 35% drop in demo requests after a pricing change, the product team promptly adjusted the demo scheduling flow, recouping a 12% lift in conversion rate within two weeks.
Example 2: E‑Commerce Store
An online retailer added cart‑abandonment heatmaps to its funnel template. The visual data revealed that most abandonments occurred during the payment step. Re‑designing the checkout flow—simplifying form fields and offering alternative payment methods—drove a 20% increase in completed purchases, directly boosting quarterly revenue.
Tips for Maintaining Accuracy and Relevance
Data Integrity Checks
Run automated validation scripts to flag anomalies such as negative spend values or duplicate lead IDs. Set thresholds that trigger alerts when metrics deviate from expected ranges.
Refresh Cadence
Weekly dashboards provide real‑time insights, while monthly or quarterly reports capture long‑term trends. Align the refresh schedule with business cycles: launch periods, fiscal quarters, and product roadmaps.
Stakeholder Feedback Loops
Present drafts to marketing, sales, and finance teams early. Their input ensures that the template covers all relevant KPIs and that the narrative aligns with strategic priorities.
Integrating Automation and Reporting Platforms

CRM Integration
Connect your funnel template directly to Salesforce or HubSpot. Automated data pulls eliminate manual entry errors and ensure that every new lead immediately populates the appropriate funnel stage.
Marketing Automation Sync
Platforms like Marketo or Pardot can feed email engagement metrics into the template, revealing which nurture paths produce the highest conversion rates.
Analytics Connectors
Link Google Analytics or Adobe Analytics to capture traffic sources and on‑site behavior, allowing you to map visitor journey to funnel stages.
Common Pitfalls and How to Avoid Them
Over‑Complex Tables
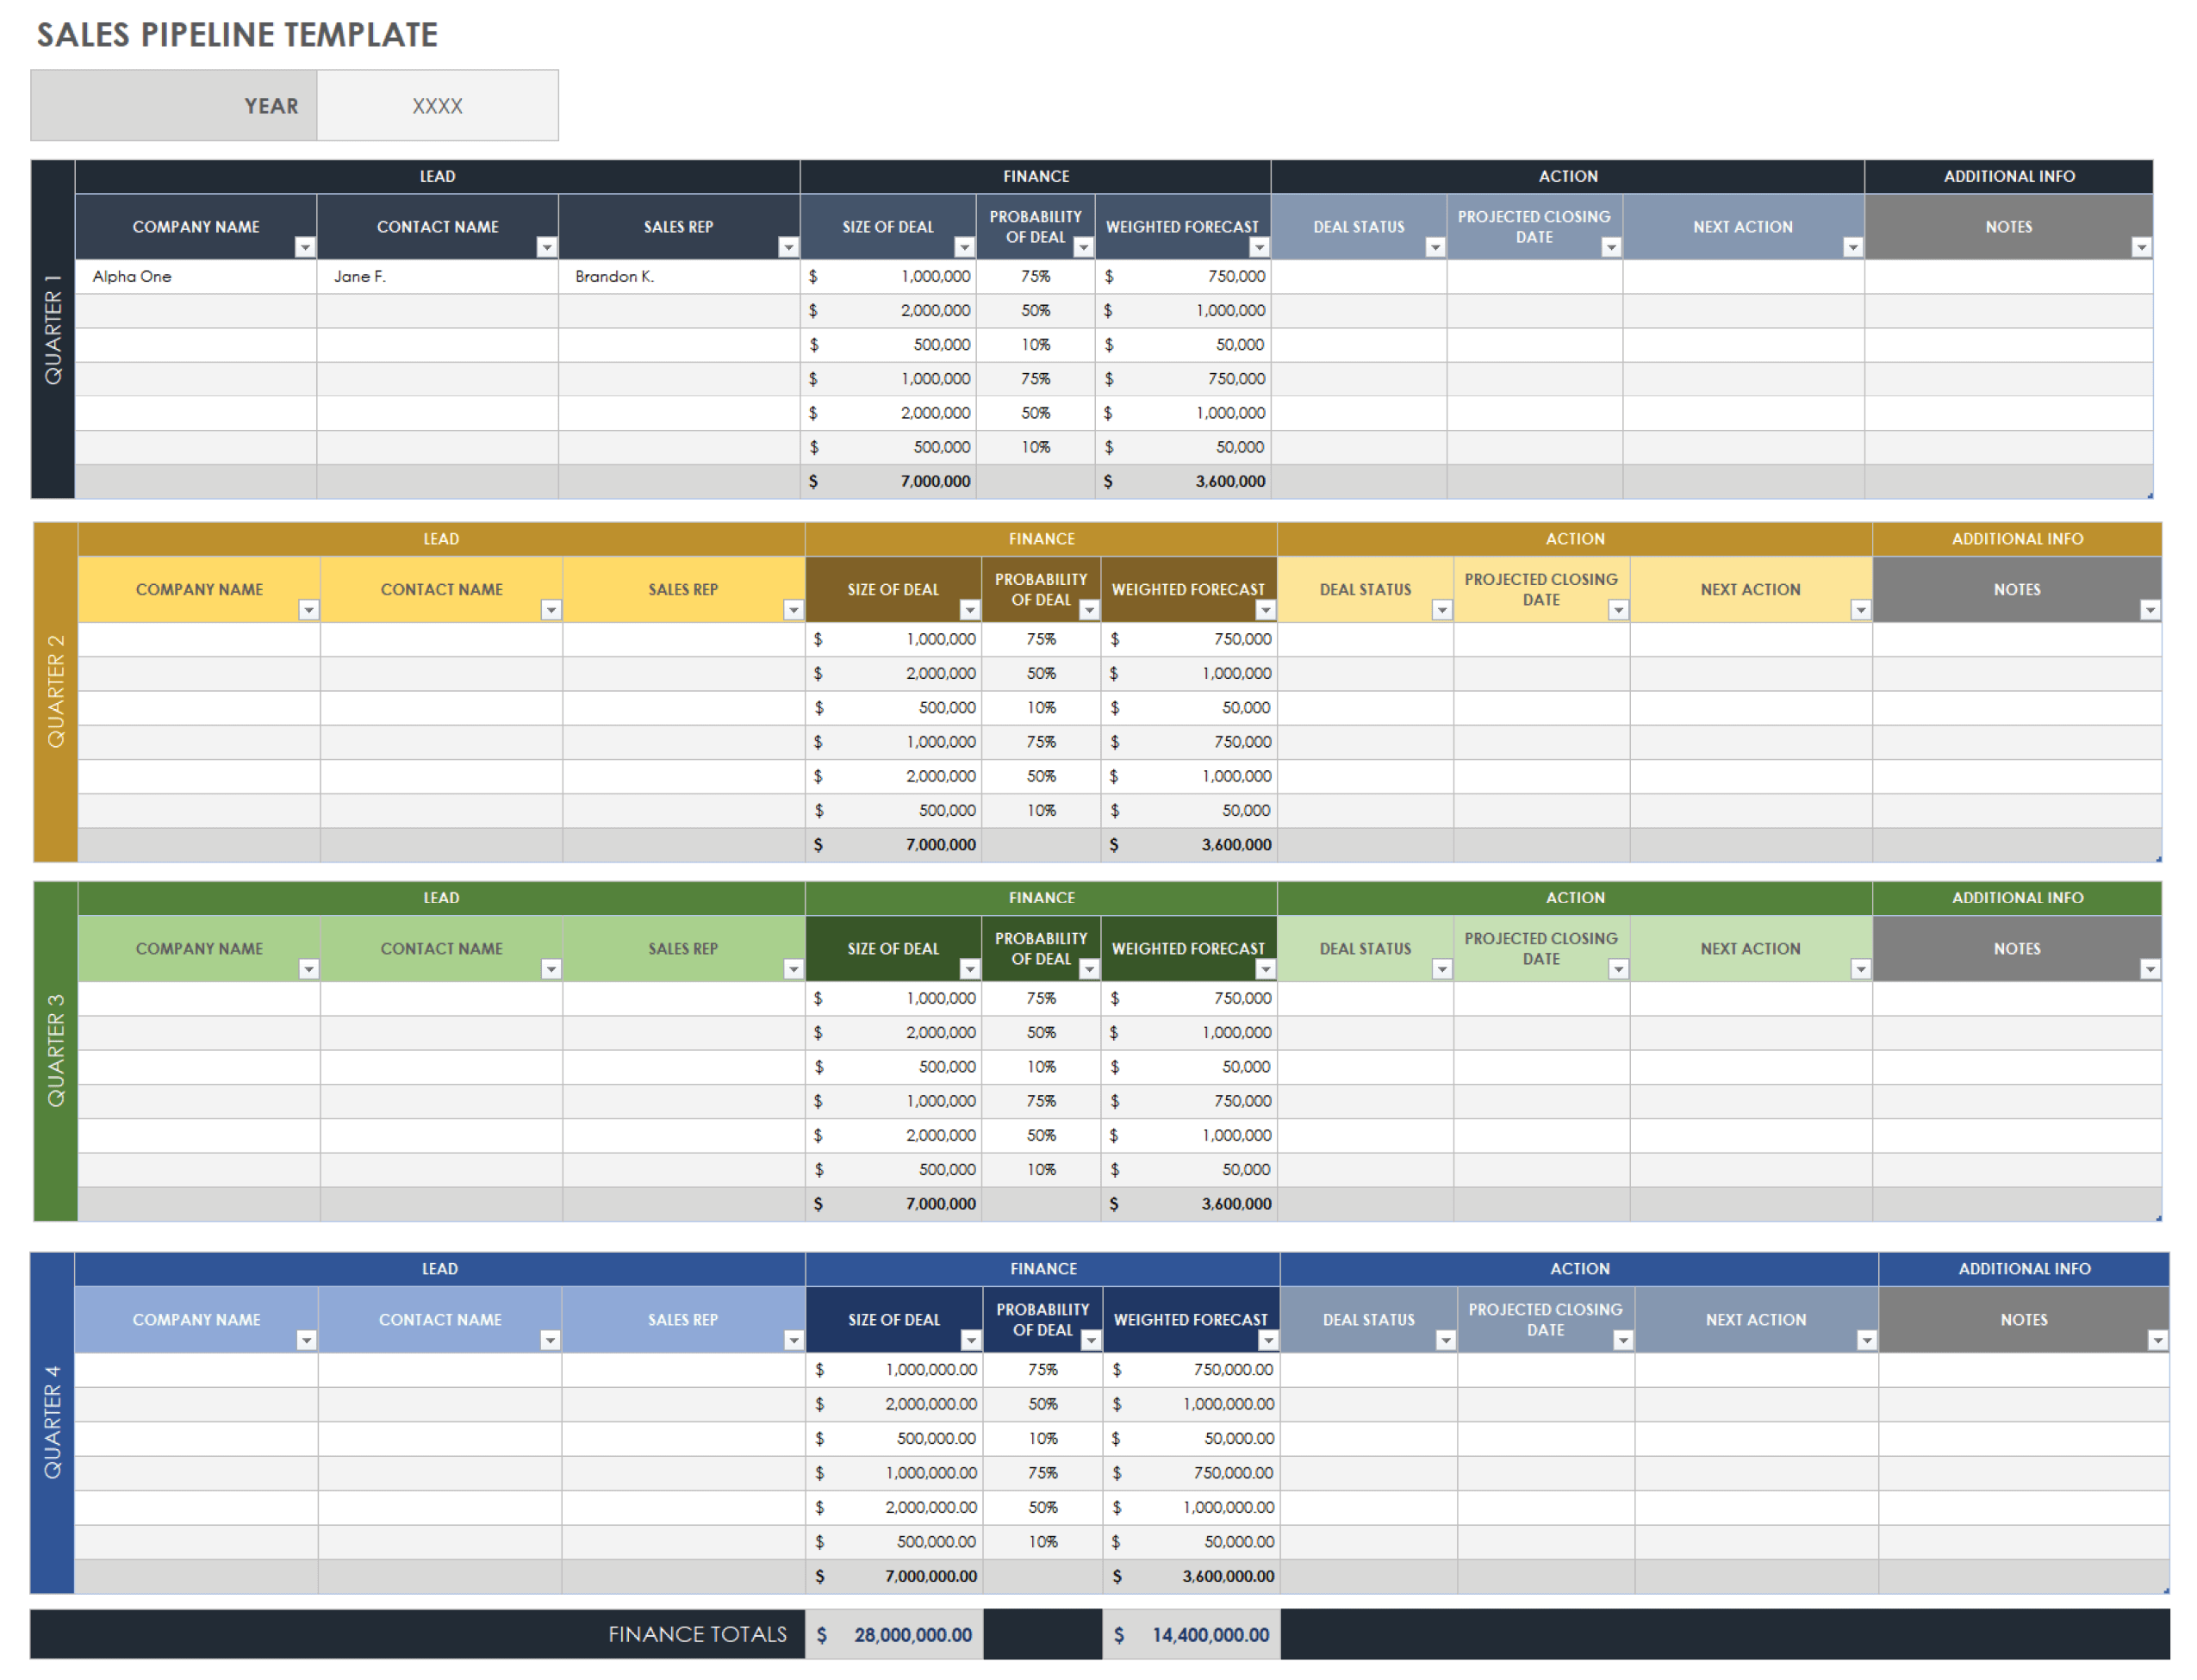
A cluttered table with too many columns can overwhelm readers. Prioritize the most actionable metrics and consider separate appendices for deeper dives.
Ignoring Qualitative Feedback
Numbers tell one side of the story. Incorporate customer testimonials, survey results, and support ticket insights to contextualize quantitative trends.
Static Reports
Hand‑written or static PDFs become outdated quickly. Transition to interactive dashboards that allow users to filter by date, segment, or campaign.
Conclusion

Implementing a meticulously structured Sales Funnel Report Template empowers organizations to move beyond guesswork, uncover hidden inefficiencies, and champion data‑driven decision making. By combining clear metrics, thoughtful design, and automated data flows, marketers and sales leaders can transform raw data into strategic actions that accelerate revenue growth and solidify customer relationships. With the right template in place, every stakeholder—from analysts to executives—has a single, authoritative source of truth that guides the next steps in the customer journey.


Related posts of "Sales Funnel Report Template"
