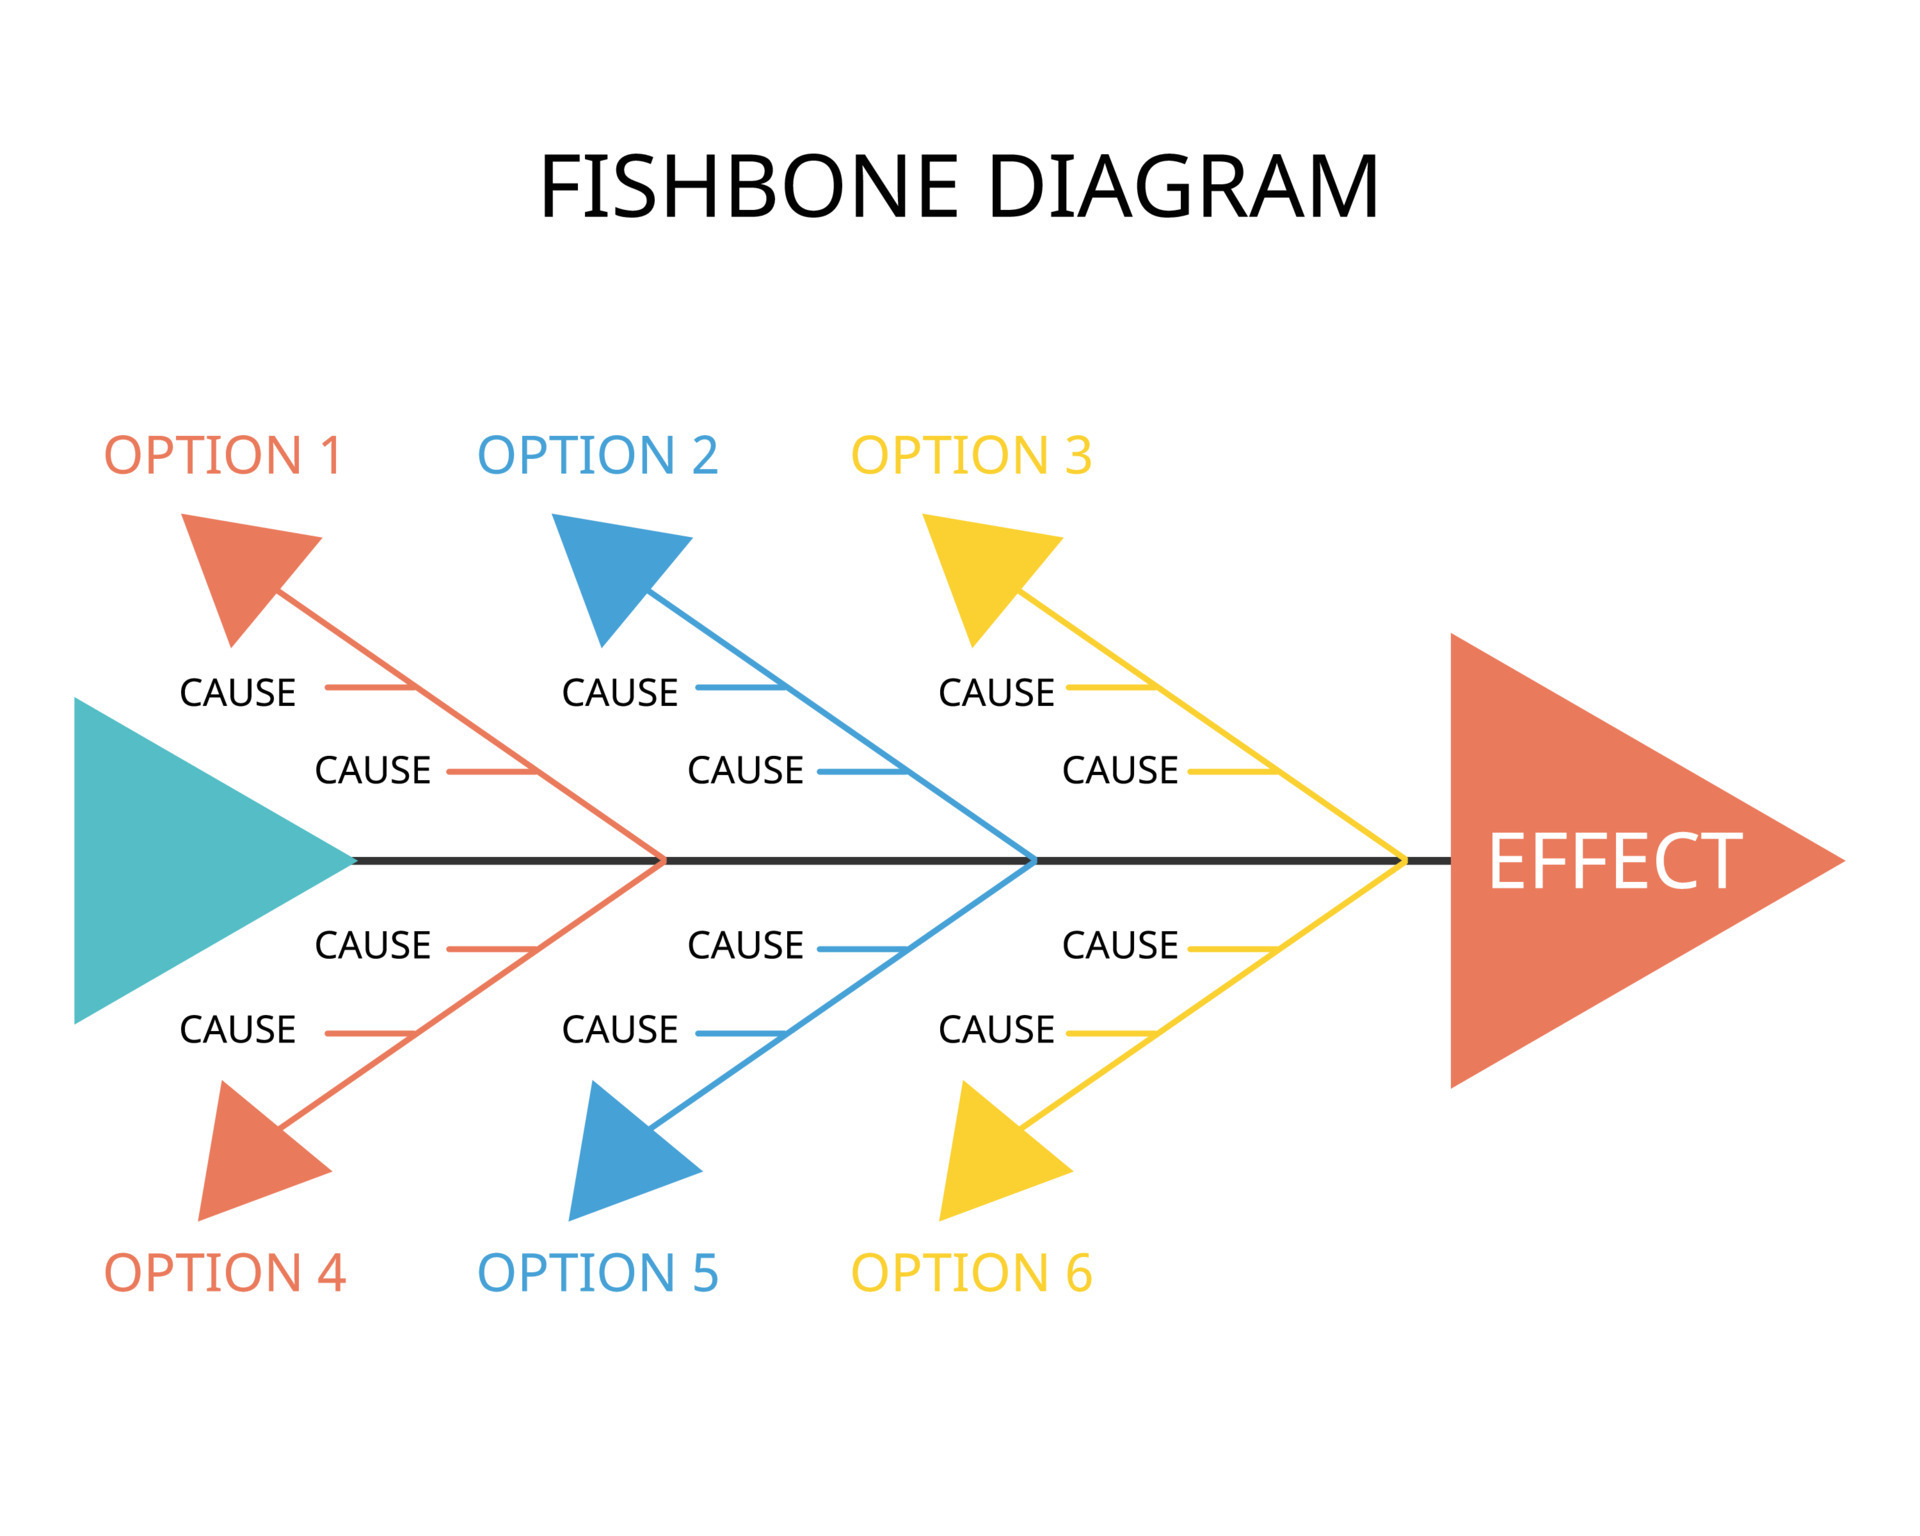
Root Cause Analysis Fishbone Diagram Template is the cornerstone of systematic problem solving in businesses, engineering, healthcare, and beyond. By visualizing the myriad potential causes of a single effect, this template empowers teams to move past surface symptoms and uncover deep-rooted issues that can transform operations, product quality, and customer satisfaction.
What Is a Fishbone Diagram?
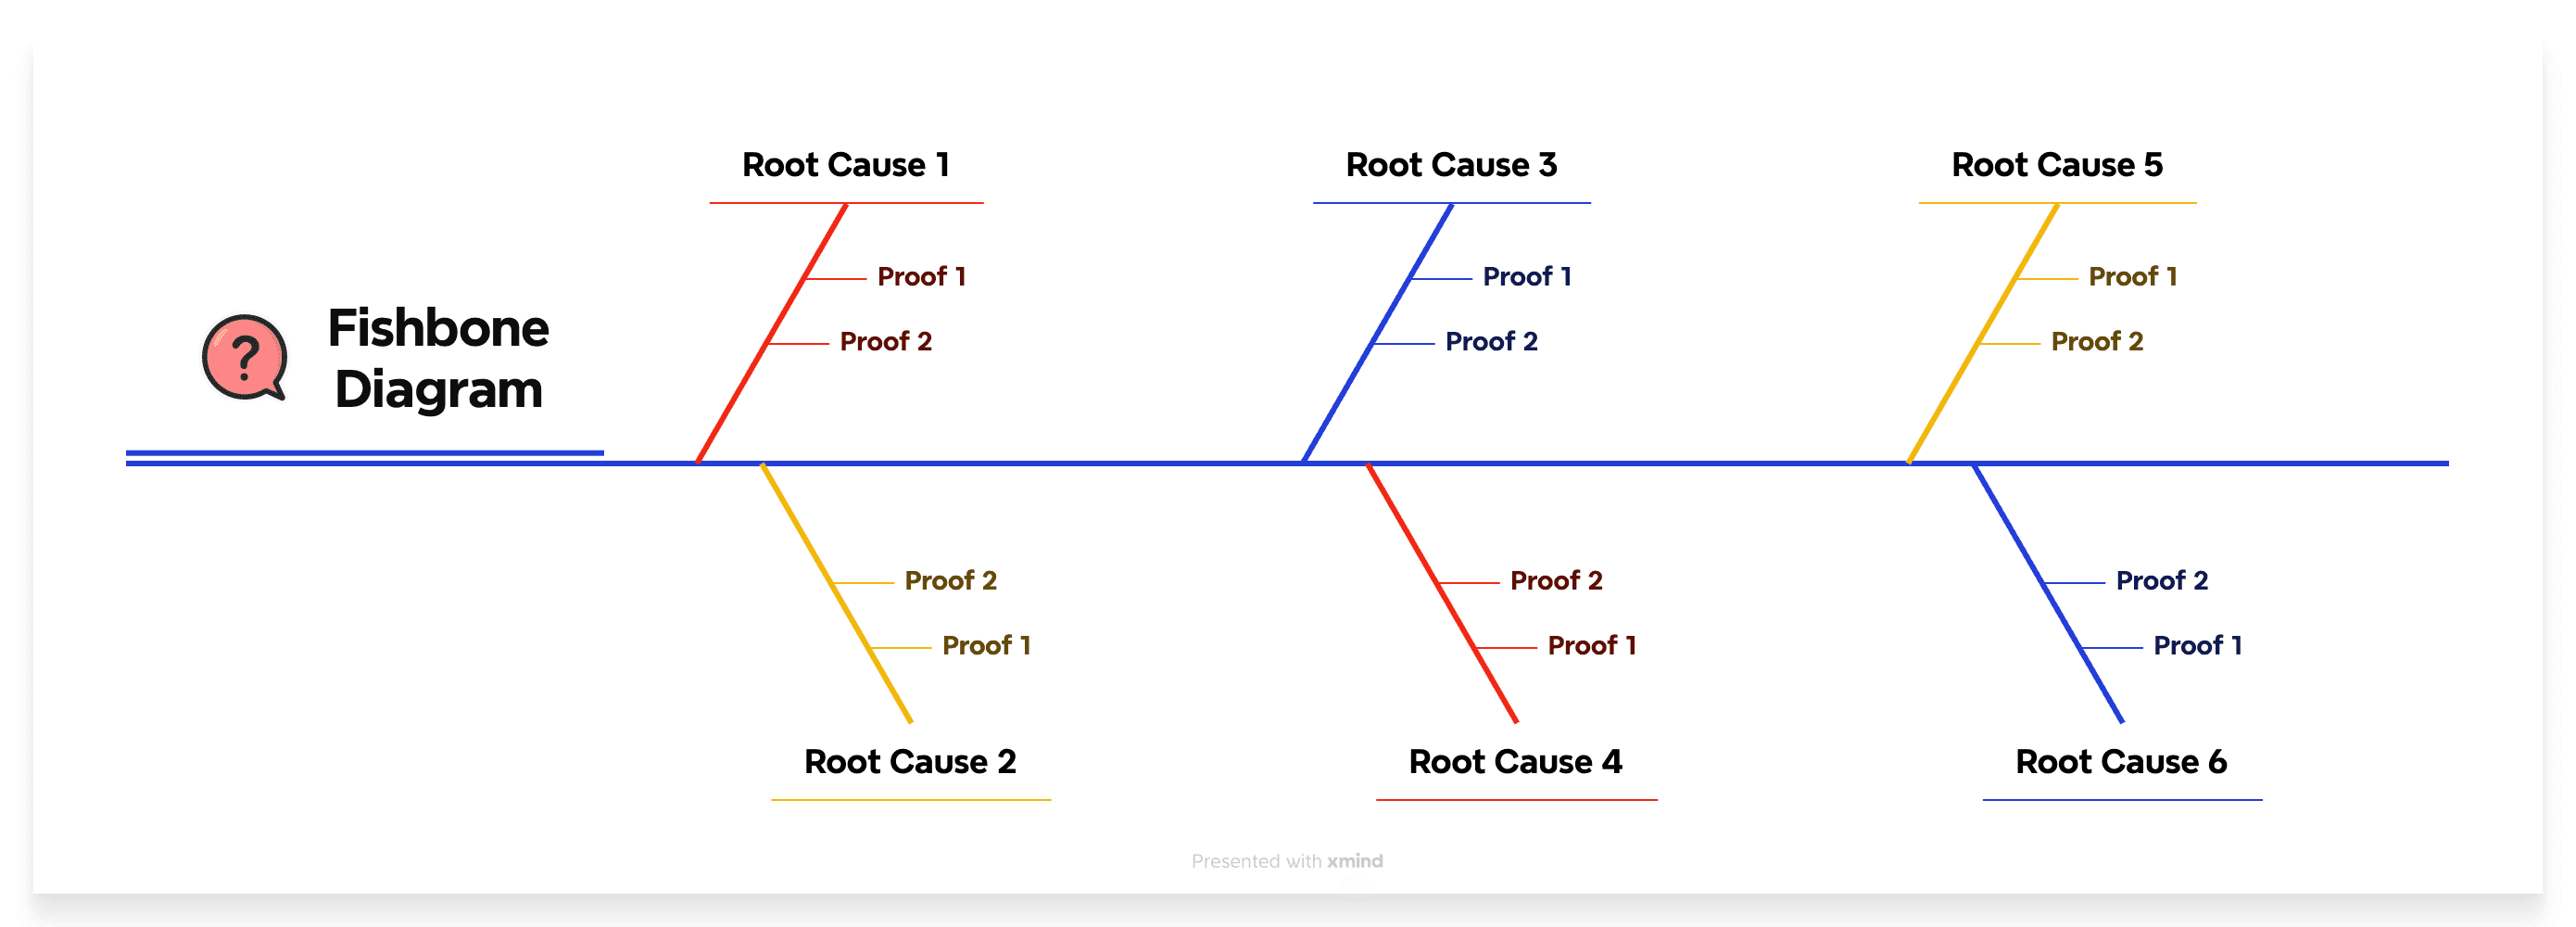
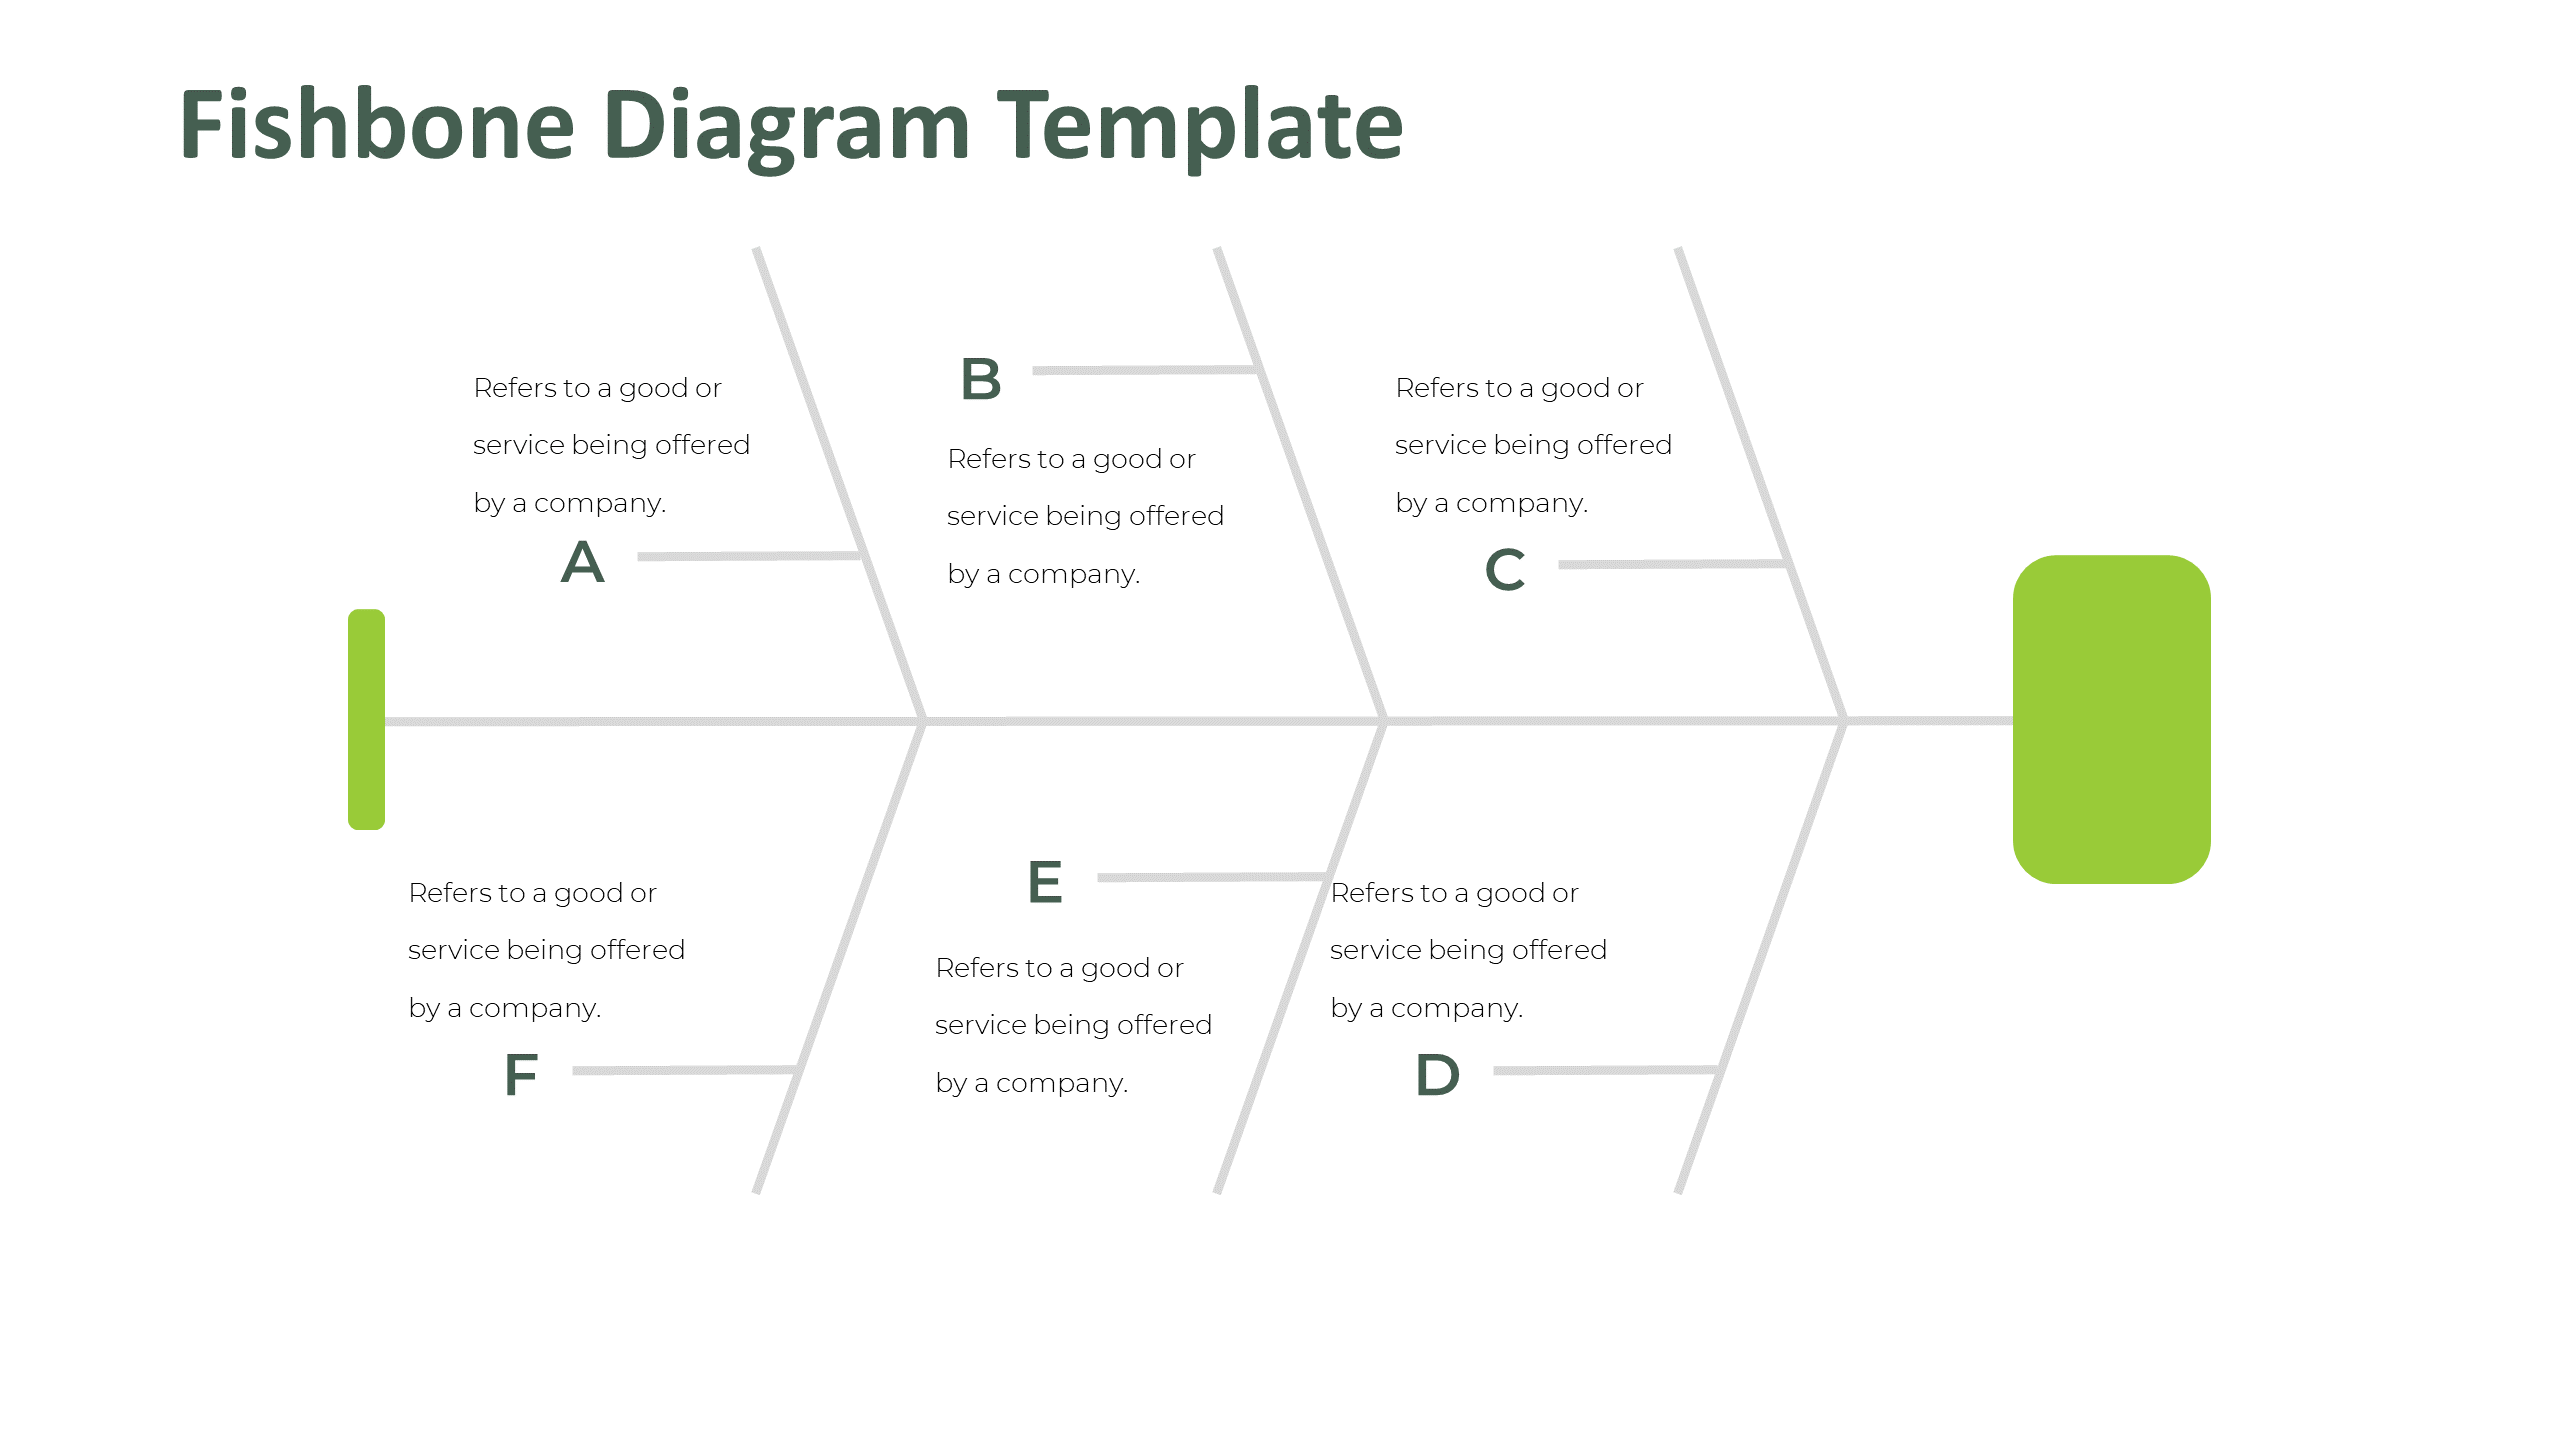
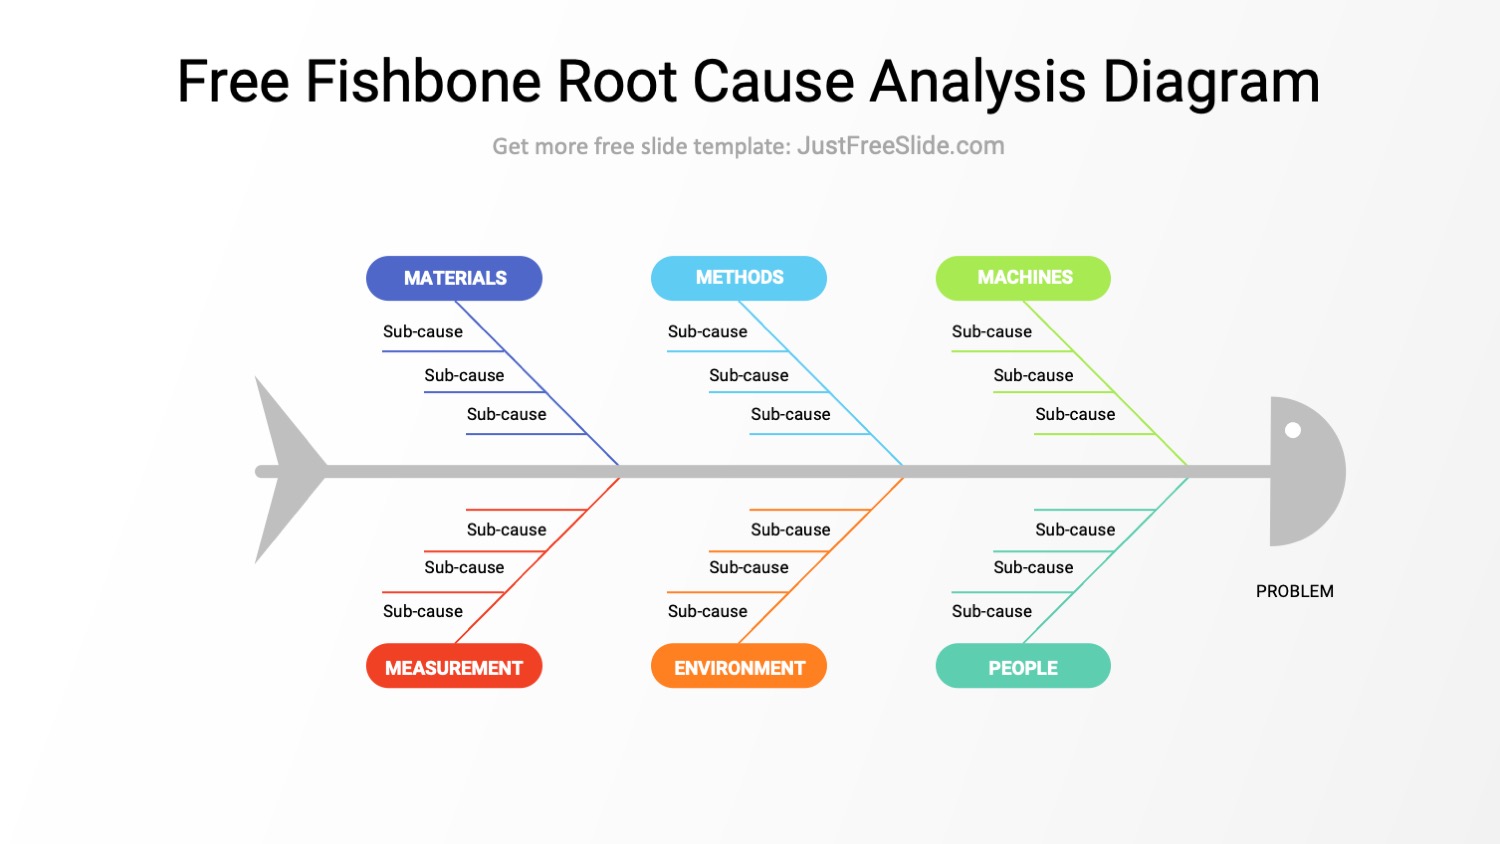
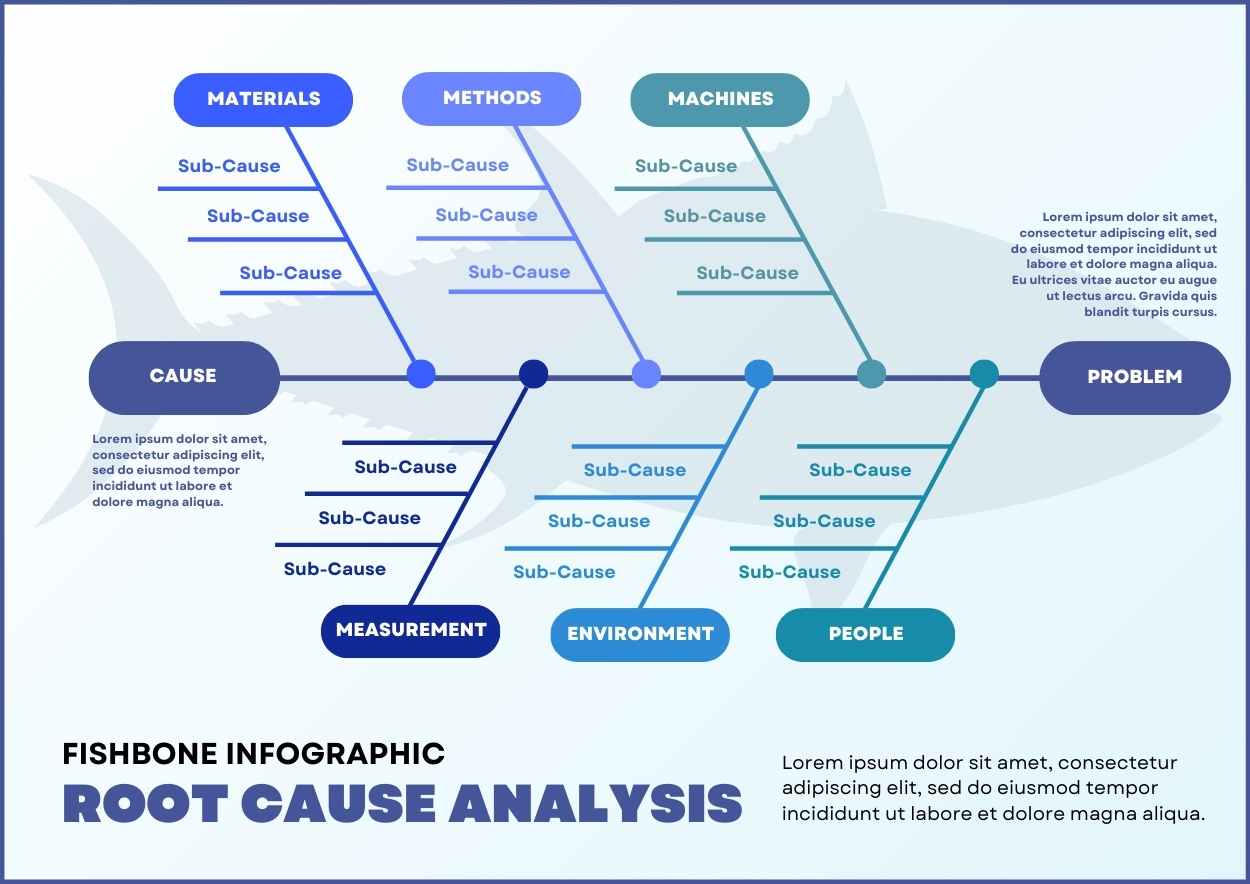
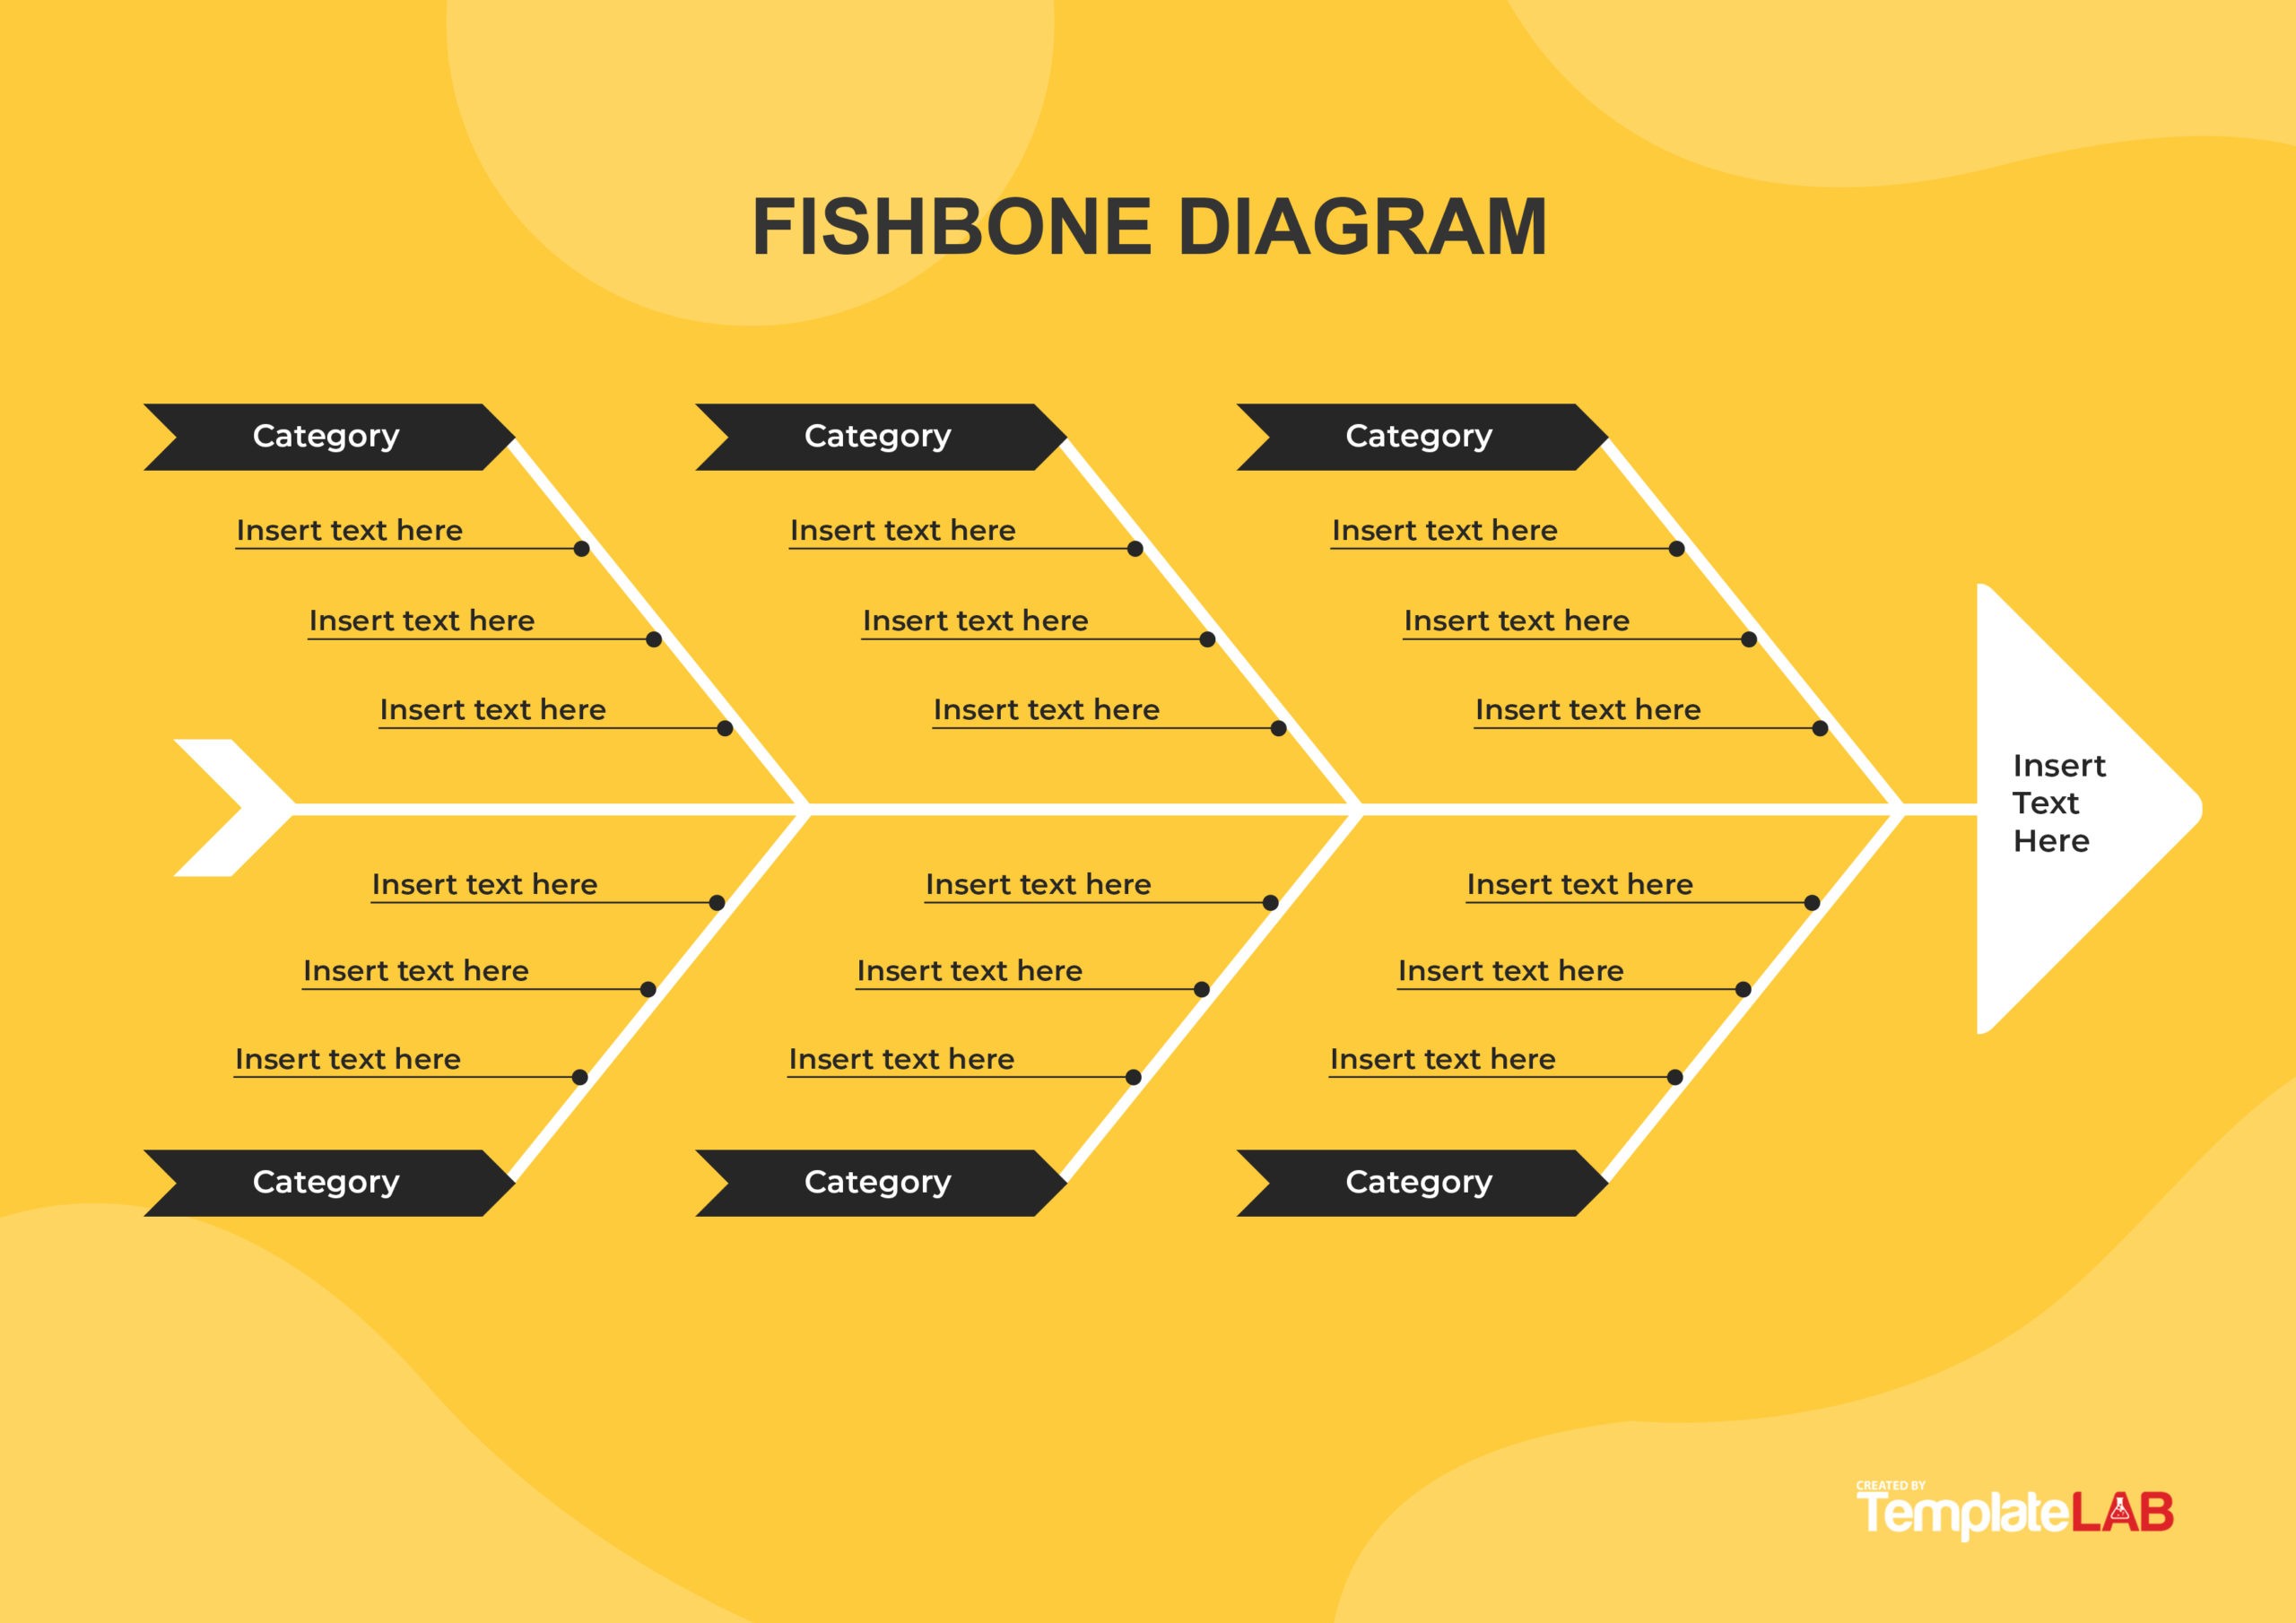
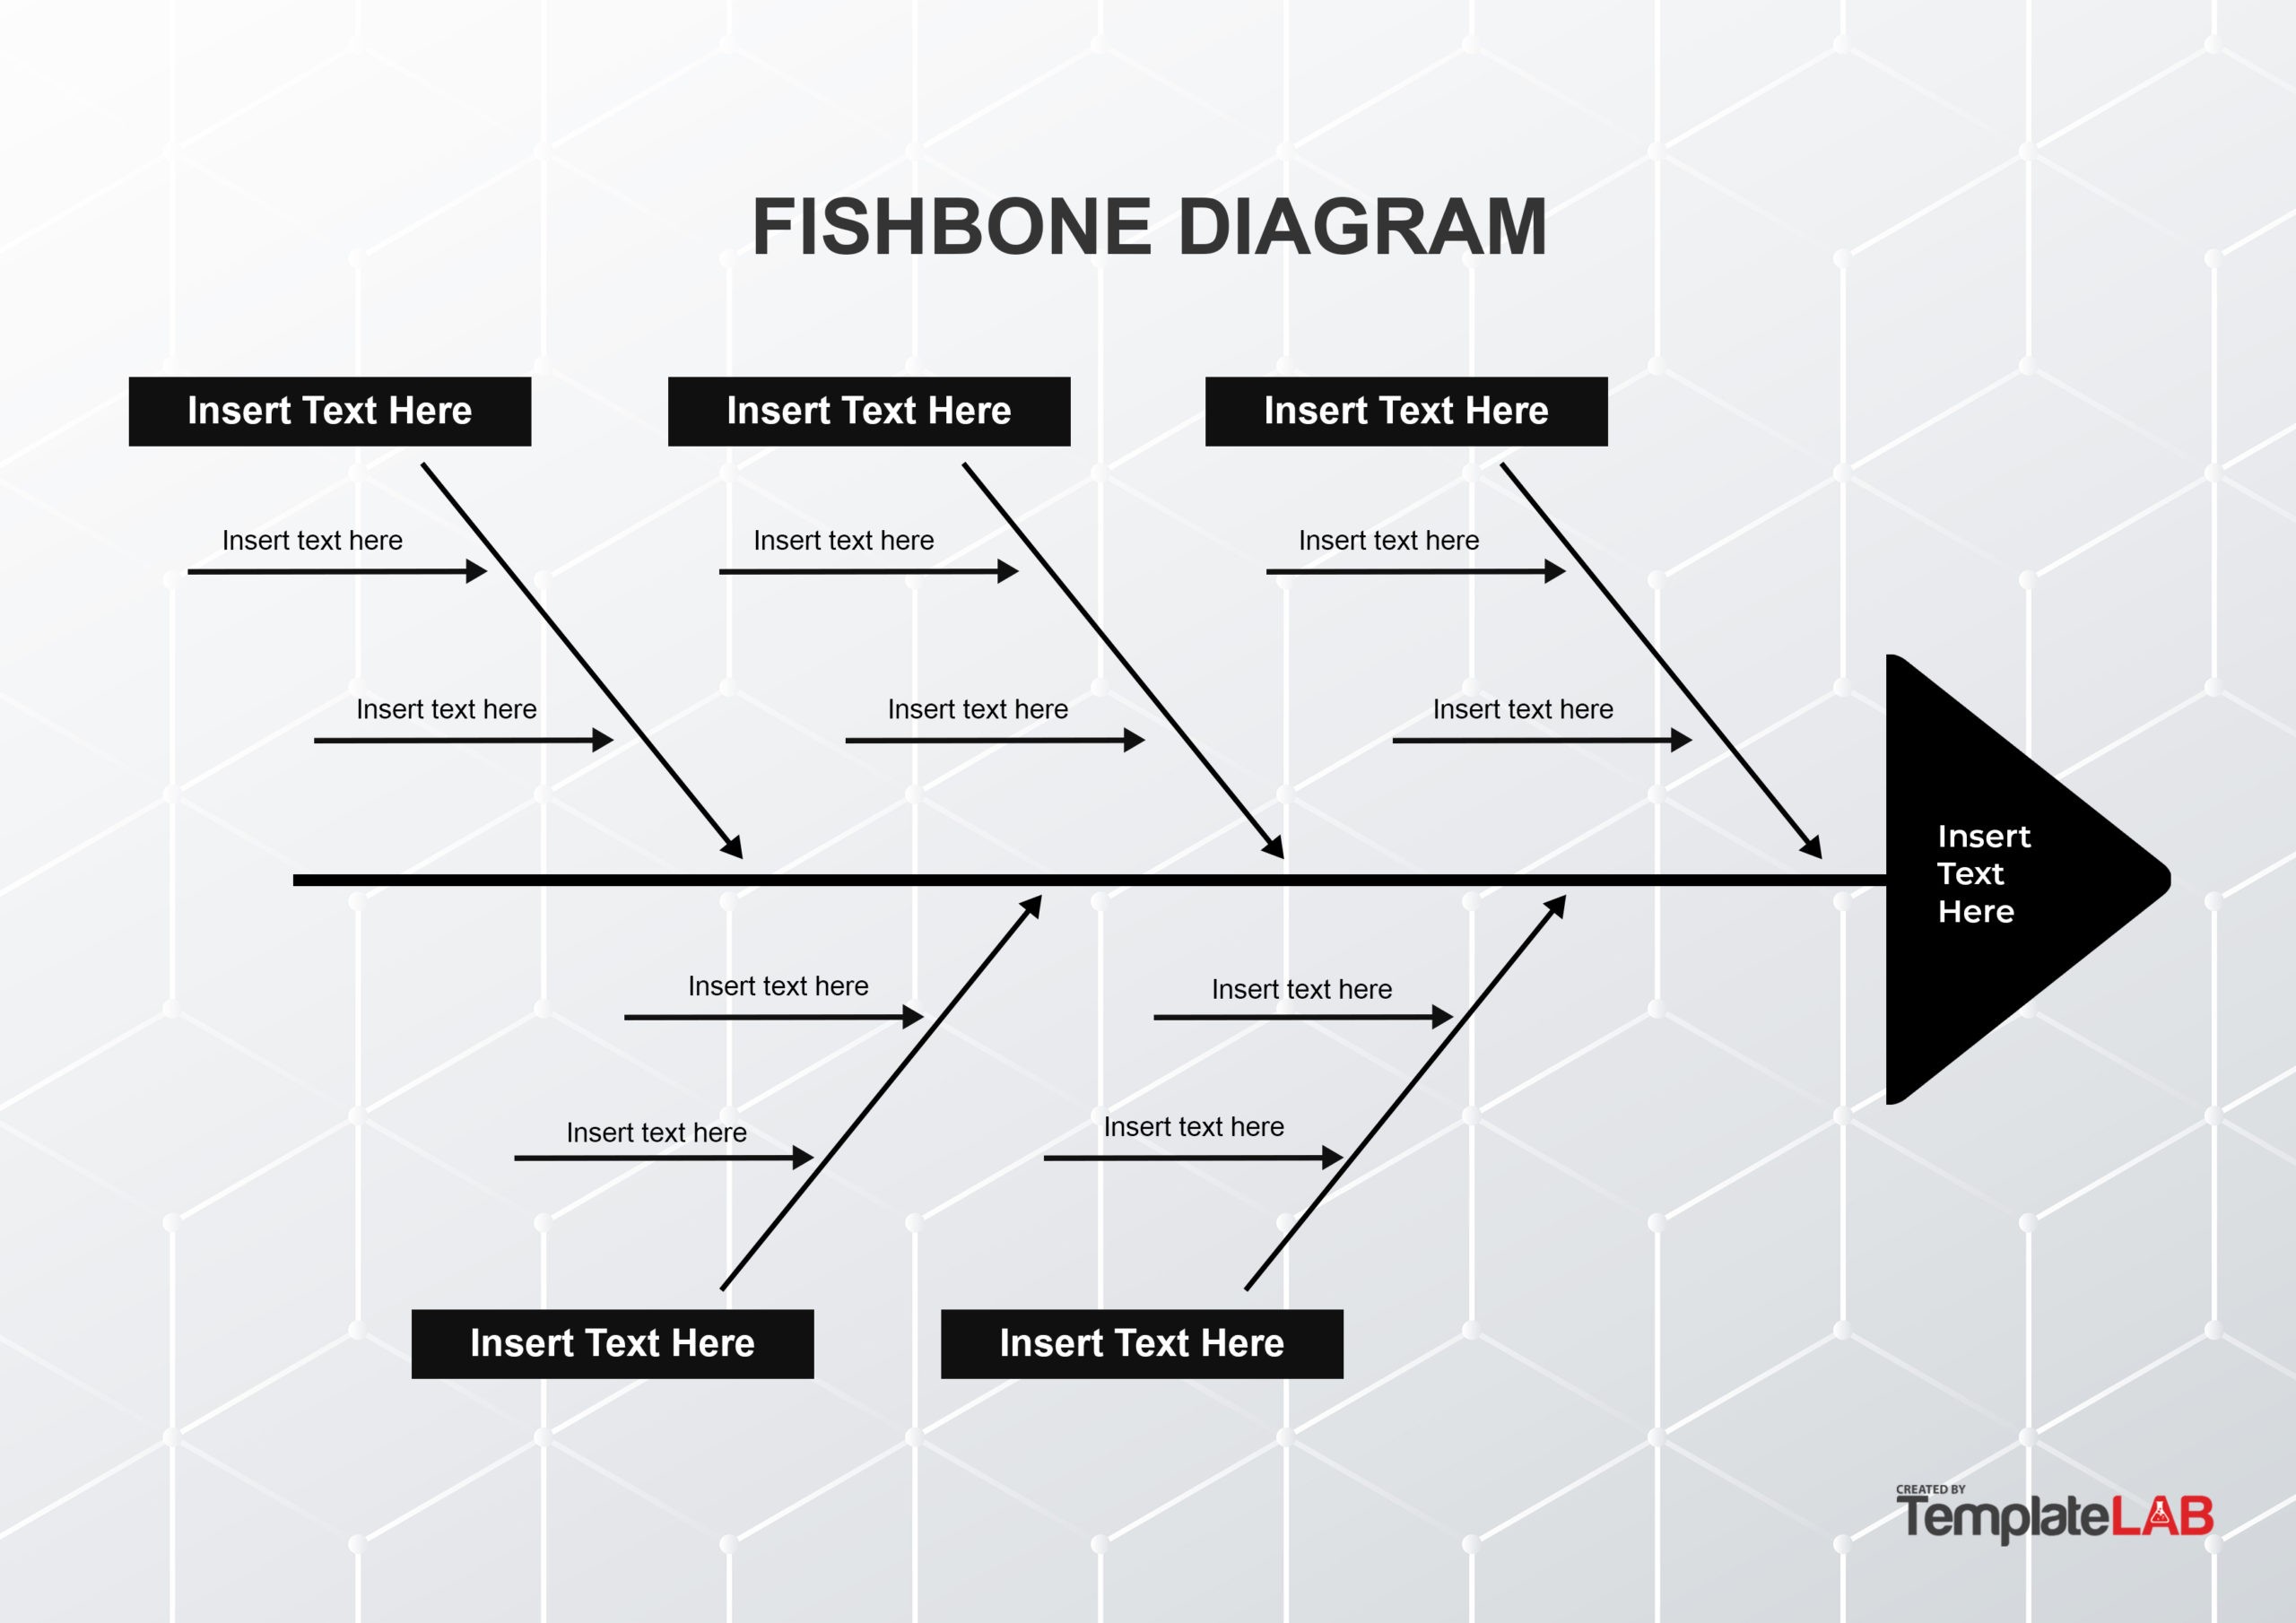
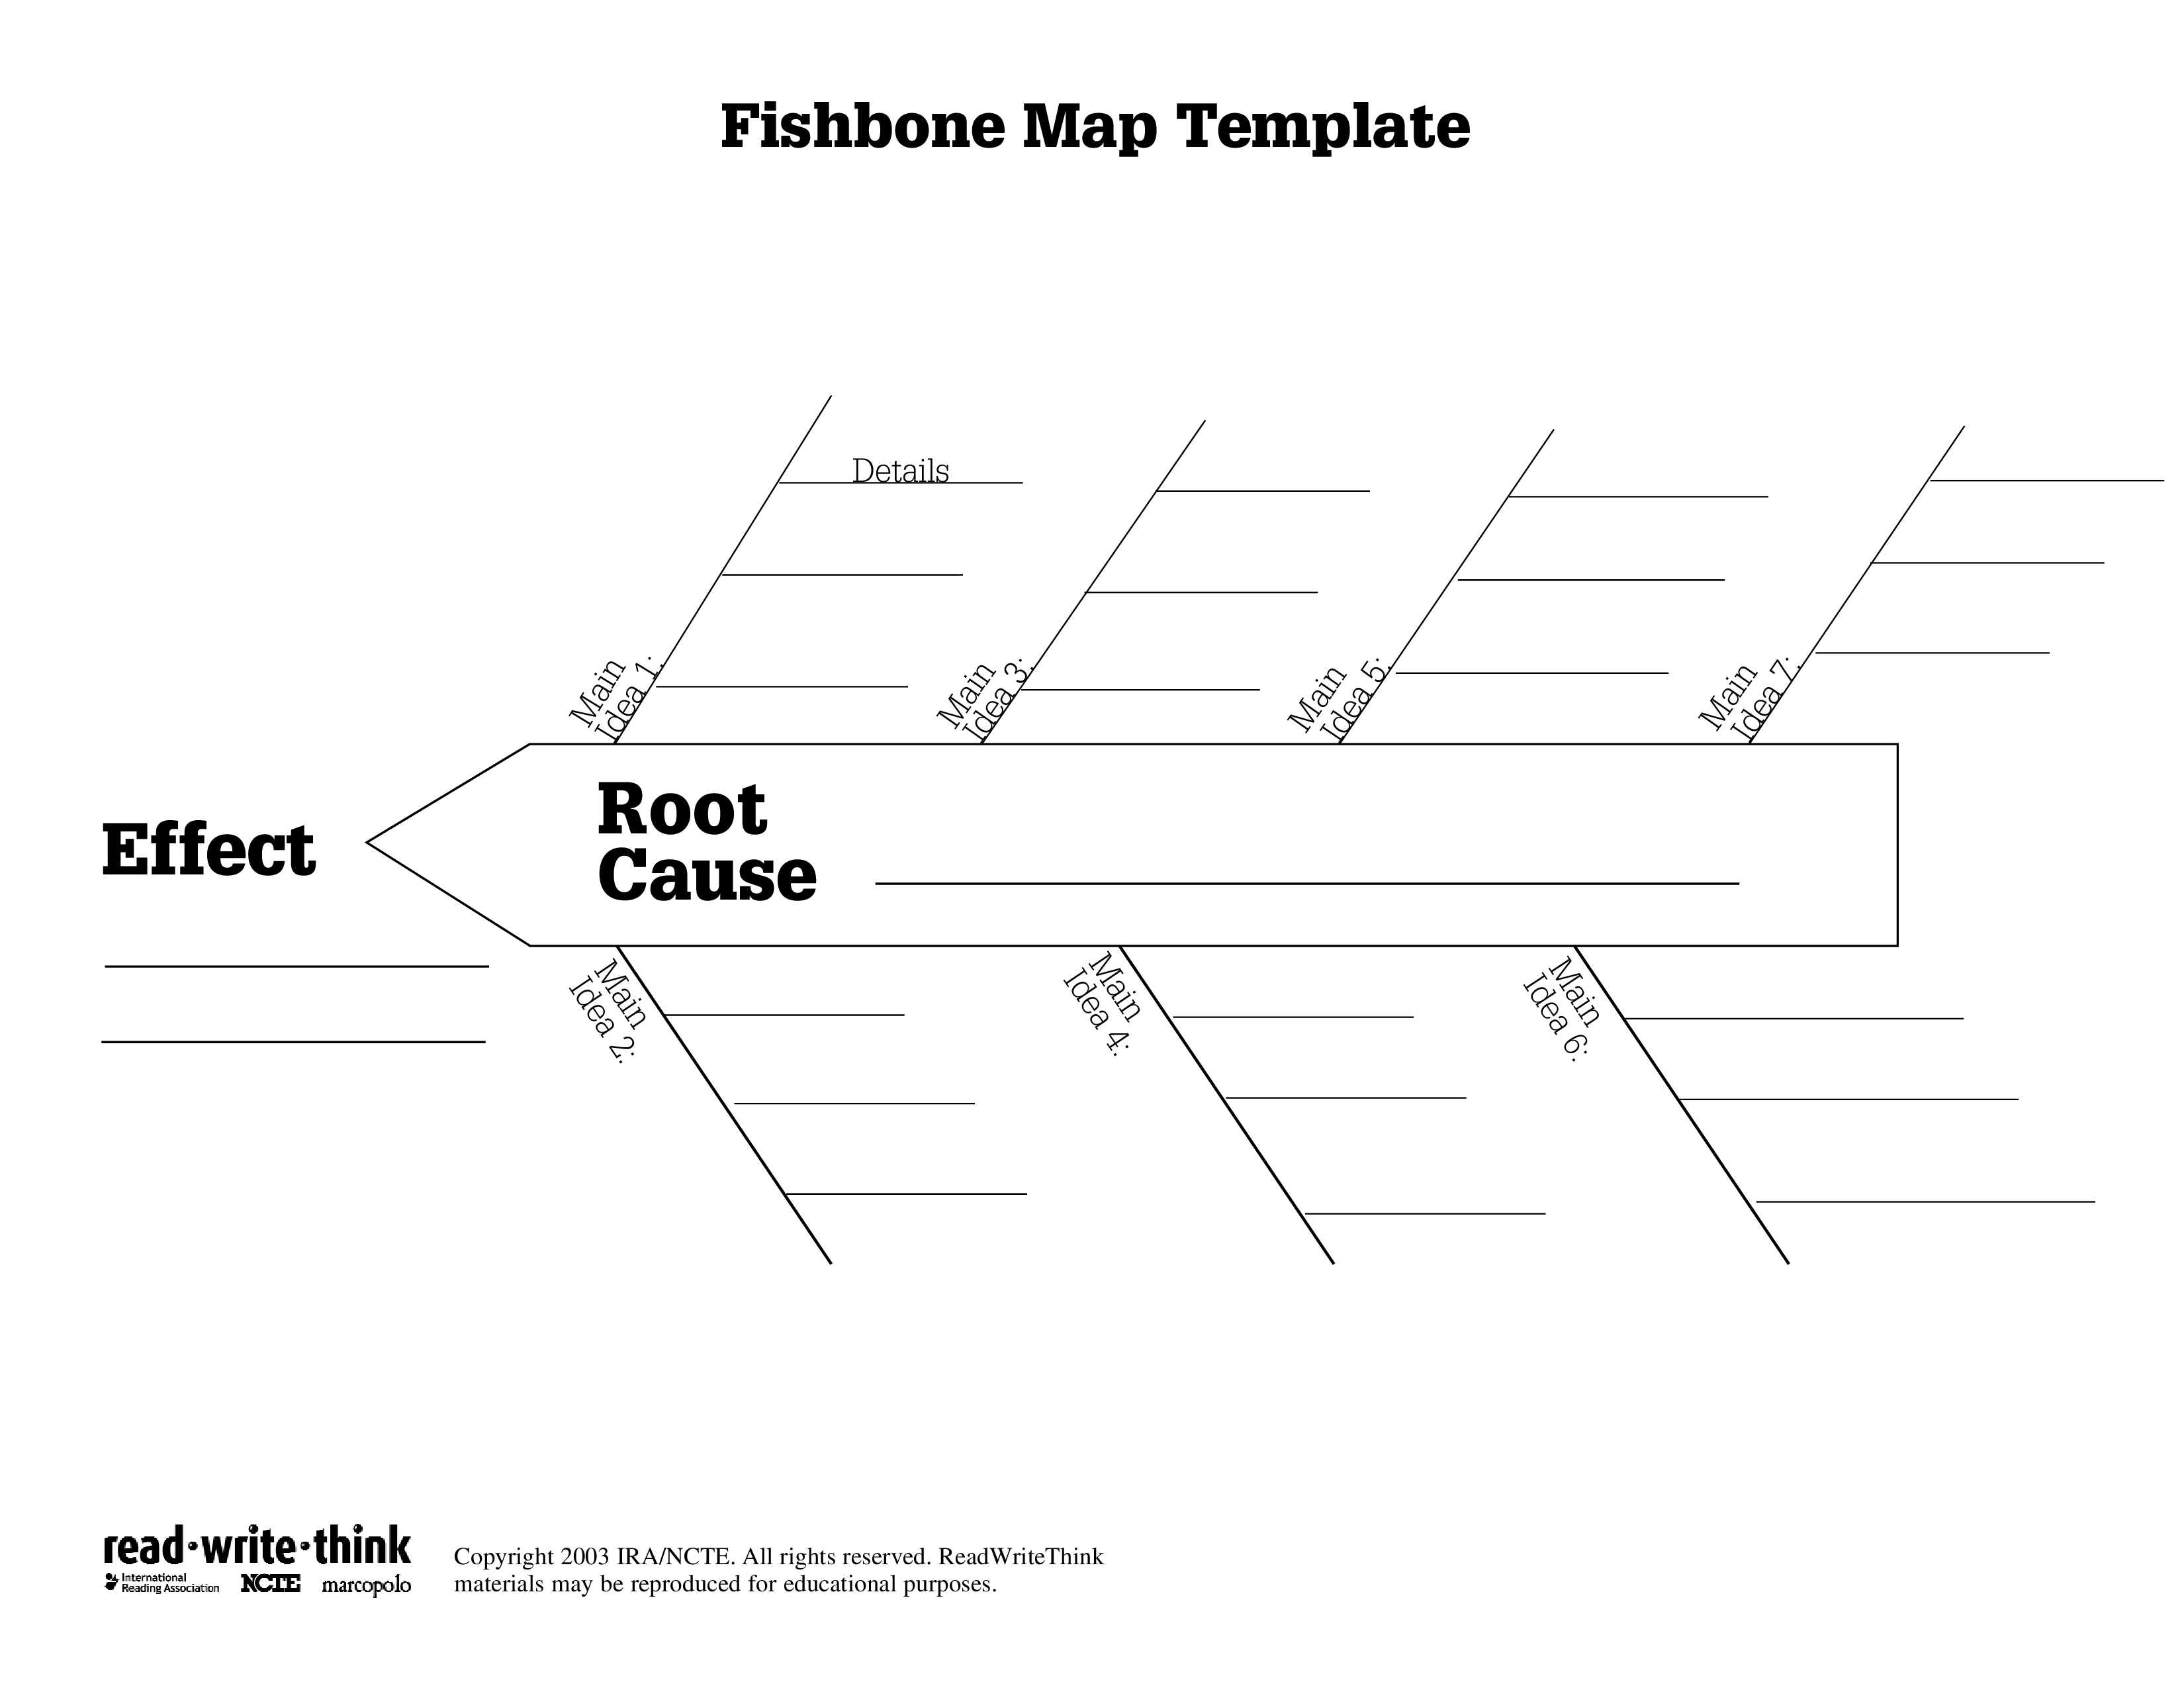
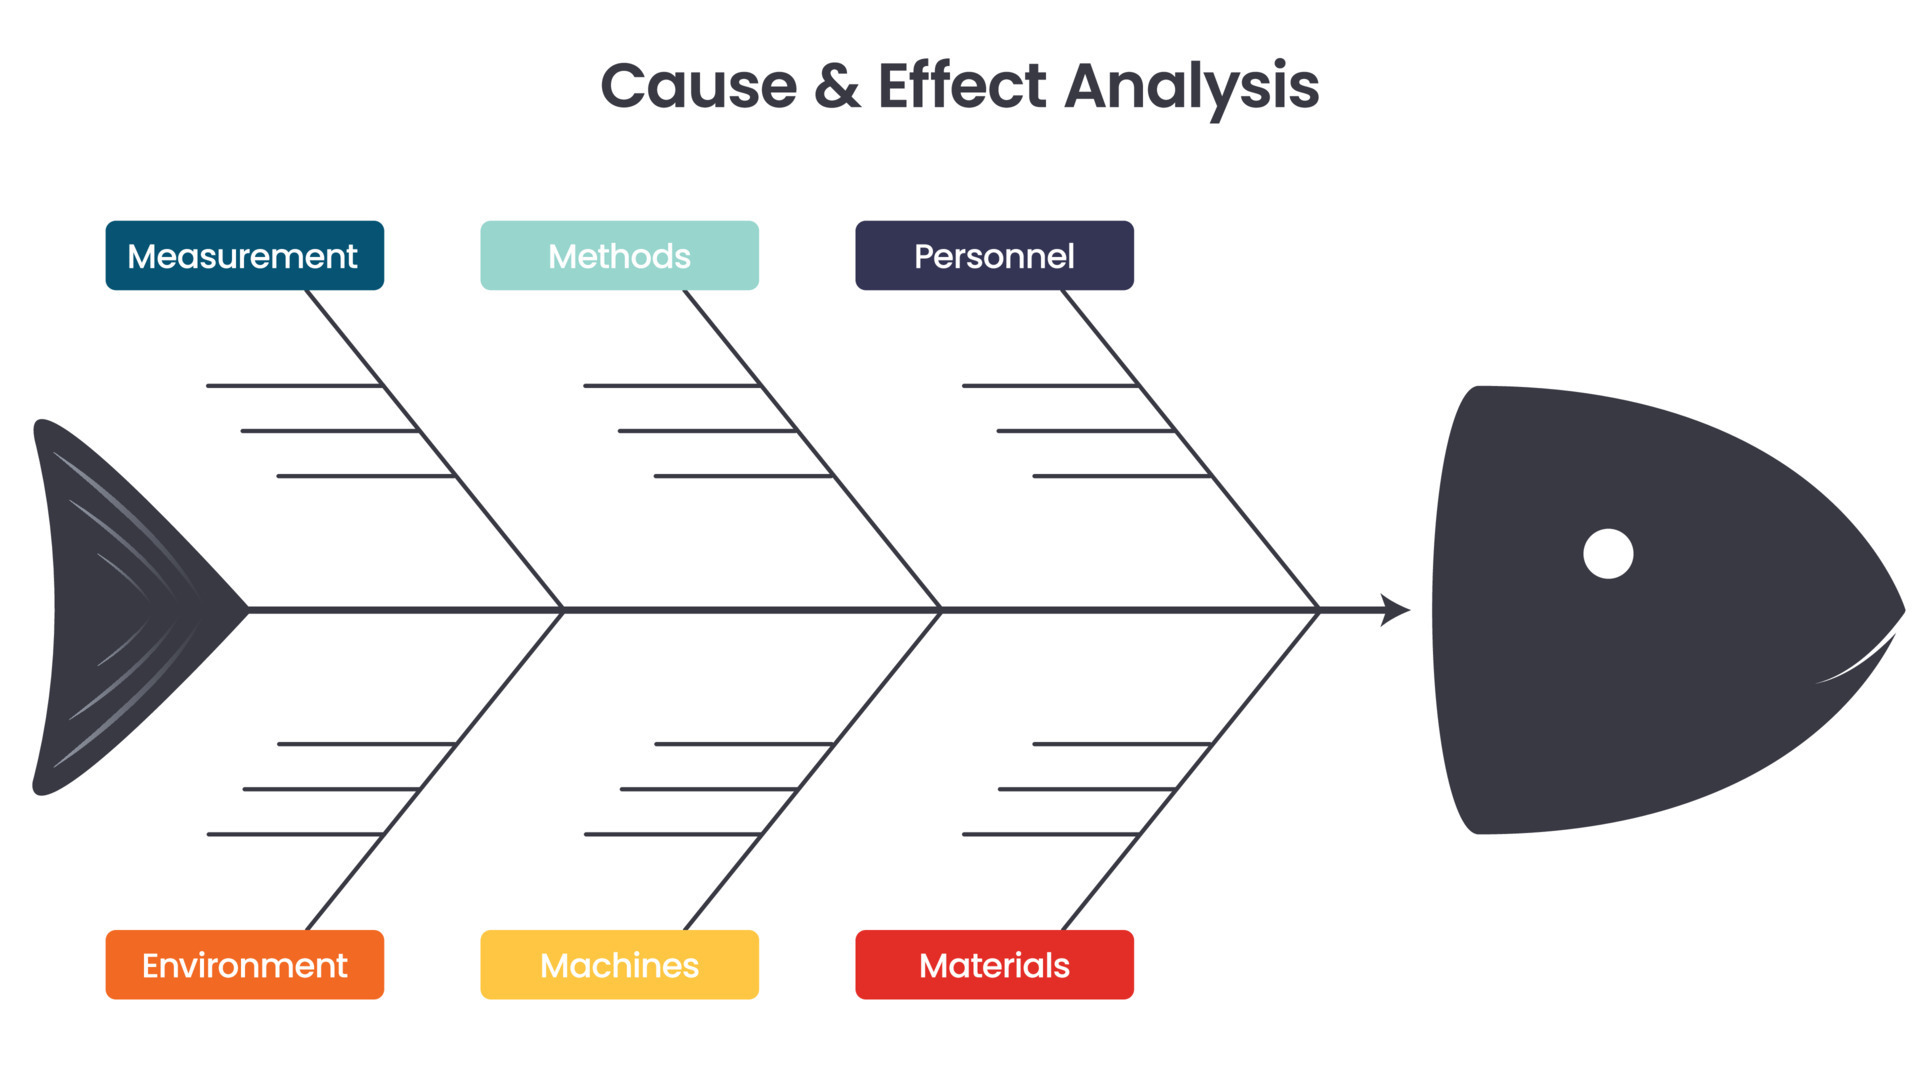
The Fishbone Diagram, also known as an Ishikawa diagram, is a cause‑and‑effect chart that resembles a skeleton with a head (the problem) and ribs (the categories of potential causes). It is called a “fishbone” because the diagram’s shape evokes the outline of a fish. The classic template divides causes into broad groups such as People, Process, Equipment, Materials, Environment, and Management, though variations can be tailored to specific industries.
Why the Template Is Essential for Root Cause Analysis

Root Cause Analysis (RCA) demands more than a list of symptoms; it requires a structured framework to explore every angle of a problem. The Fishbone Diagram Template delivers:
- Visual clarity. Complex relationships become instantly readable.
- Team collaboration. A single canvas invites diverse perspectives.
- Actionable insights. Identified causes translate directly into improvement plans.
When embedded in an RCA process, the template serves as a living document—updating with new evidence and guiding corrective actions until the root cause is sealed.
Step‑by‑Step Construction of the Diagram

Select the Problem Statement
Begin with a clear, concise statement that defines the issue. Place it in the “head” of the fishbone, using a bold box or a contrasting color to make it stand out. For example:
- “Customer complaints spike after the latest software release.”
- “Annual manufacturing defect rate exceeds target by 3%.”
Identify Major Cause Categories
Typical categories include:
- People – skills, training, motivation.
- Process – steps, procedures, documentation.
- Equipment – machinery, software, tools.
- Materials – raw inputs, components, suppliers.
- Environment – physical layout, culture, regulatory context.
- Management – policies, resources, oversight.
Adapt categories to match the organization’s structure and industry specifics.
Brainstorm Sub‑Causes
Within each category, generate detailed sub‑causes that could contribute to the main problem. Encourage “Why? Why?” questioning to drill deeper. Typical sub‑causes:
- People: inadequate training, high turnover, unclear responsibilities.
- Process: missing checklists, outdated SOPs, inefficient workflow.
- Equipment: aging servers, misconfigured devices, lack of maintenance.
- Materials: supplier quality fluctuations, defective components, inconsistent specifications.
- Environment: noisy workspace, poor ergonomics, regulatory changes.
- Management: insufficient budget, unclear objectives, poor communication.
Validate and Prioritize Causes
After populating the diagram, use evidence such as data logs, incident reports, or stakeholder interviews to validate each sub‑cause. Techniques to rank importance include:
- Impact–Effort Matrix. Place causes based on potential impact on the problem and the effort required to address them.
- Pareto Analysis (80/20 rule). Identify the 20% of causes that produce 80% of the effect.
- Fishbone “Cause–Effect” scoring where each sub‑cause receives a numeric rating for likelihood and severity.
Integrating the Template Into Daily Workflows
- Preparation. Gather historical data, previous RCA findings, and relevant metrics.
- Problem Definition. Share the statement and confirm understanding.
- Brainstorming. Assign facilitators for each category to ensure balanced participation.
- Analysis. Use cross‑checking methods to confirm that each sub‑cause has supporting evidence.
- Action Planning. Draft specific tasks, owners, and timelines.
- Follow‑up. Revisit the diagram after corrective actions to verify root cause resolution.
- Drag‑and‑drop nodes for real‑time editing.
- Version control and audit logs for accountability.
- Export options (PNG, PDF, PowerPoint) for stakeholder sharing.
- Integration with project management suites like Jira, Trello, or Asana to auto‑create tickets based on identified causes.
Real‑World Applications and Case Studies
Common Pitfalls and How to Avoid Them
Over‑Fragmentation of Causes
Splitting sub‑causes into too many granular details can cloud the picture. Keep sub‑causes focused on root drivers rather than symptoms.
Ignoring Data Validation
Assumptions can mislead RCA. Pair the diagram with quantitative data: error logs, process metrics, or survey results to substantiate each link.
Failure to Close the Loop
Identifying a root cause is only half the battle; implementing and monitoring corrective actions is crucial. Attach action items directly to the diagram where possible, and schedule review checkpoints.
Resistance to Collaboration
Fishbone Diagrams thrive on diverse input. Ensure that all relevant departments—engineering, QA, operations, procurement—participate to surface hidden causes.
Enhancing the Template With Advanced Techniques

Choosing the Right Template Design
Not all templates are created equal. When selecting a template, consider:
- Flexibility. Ability to add or remove categories on the fly.
- Readability. Clear font, color coding for categories, and adequate spacing.
- Exportability. Compatibility with presentation software for stakeholder meetings.
- Versioning. Keeping track of changes over time to monitor the evolution of problem understanding.
Implementing a Culture of Root Cause Analysis

Tools alone cannot drive improvement; culture does. Embedding the Fishbone Diagram Template into the organization’s standard operating procedures signals that every issue warrants a deeper look. Leaders should champion RCA by:
- Providing training sessions on diagram construction and analysis.
- Recognizing teams that close loops effectively.
- Integrating RCA metrics into performance dashboards.
- Encouraging a blame‑free environment where data, not individuals, drives decisions.
Conclusion
The Root Cause Analysis Fishbone Diagram Template is more than a chart; it is a strategic instrument that aligns teams around a shared visual narrative of problems and solutions. By systematically categorizing potential causes, validating them with evidence, and translating findings into concrete actions, organizations can move from reactive firefighting to proactive, sustainable improvement. Whether you’re troubleshooting a production defect, untangling a complex service outage, or refining a patient flow process, the template equips you to ask the right questions, find the true root causes, and implement lasting fixes. Embrace the diagram as part of a disciplined, collaborative RCA framework, and watch your organization shift from surface-level fixes to deep, enduring excellence.



Related posts of "Root Cause Analysis Fishbone Diagram Template"
