
The Rental Property Analysis Spreadsheet Template is the most powerful tool a real estate investor can add to their toolkit, allowing you to quantify every cost, income stream, and potential return with precision. By harnessing the structured logic of a well‑designed spreadsheet, you can instantly compare dozens of properties, evaluate long‑term profitability, and present clear, data‑driven proposals to lenders or partners.
Why a Rental Property Analysis Spreadsheet Is Essential
When you’re evaluating a property, the sheer volume of variables—purchase price, renovation costs, operating expenses, tax implications, and financing terms—can quickly become overwhelming. A dedicated spreadsheet forces each element into a consistent framework, eliminating guesswork and reducing the risk of costly oversights.
Key benefits include:
- Transparency: Every number is visible, traceable, and easily adjustable.
- Scenario Planning: Test “what if” situations, such as rent hikes, vacancy spikes, or interest rate changes.
- Performance Tracking: Record actual results versus projections to refine future deals.
- Credibility: Provide lenders, investors, or partners with a professional, audit‑ready document.
Core Components of a Winning Template
Acquisition Data
Begin by cataloguing all purchase‑related figures:
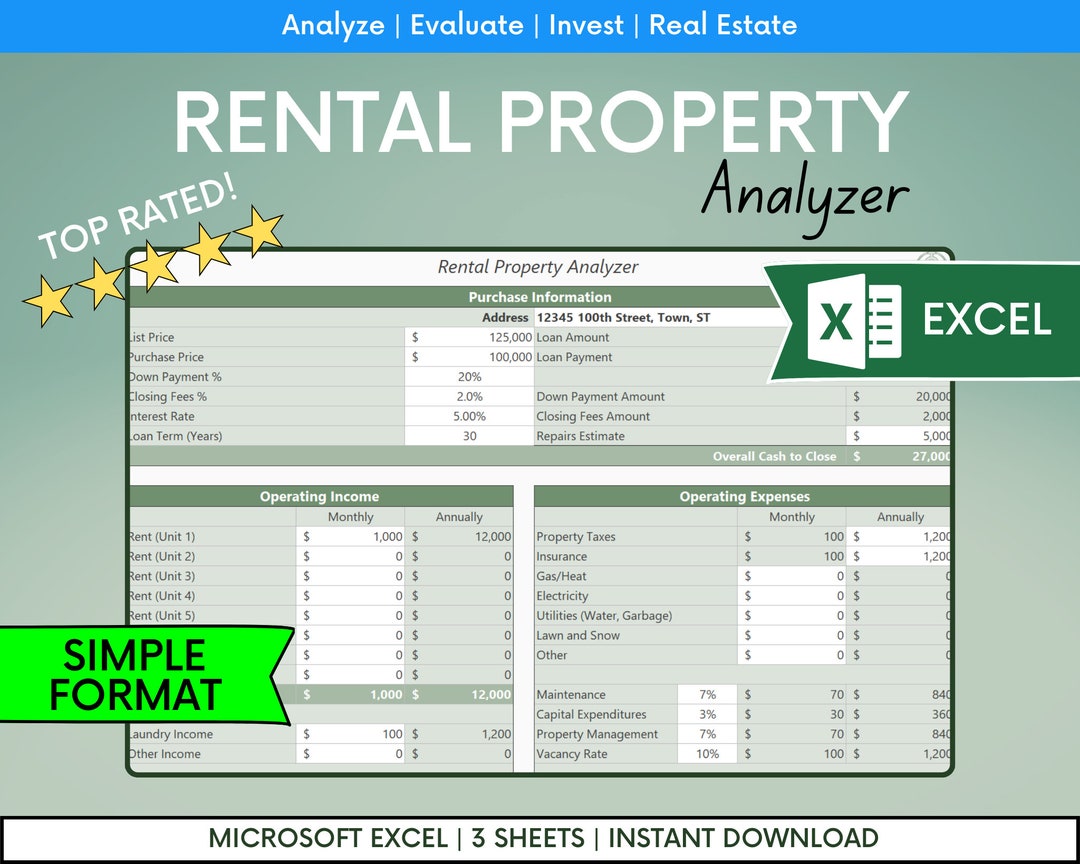
- Listing price and closing costs.
- Estimated renovation or repair budgets.
- Professional fees (appraisal, inspection, attorney).
- Financing details: loan amount, interest rate, amortization, down payment.
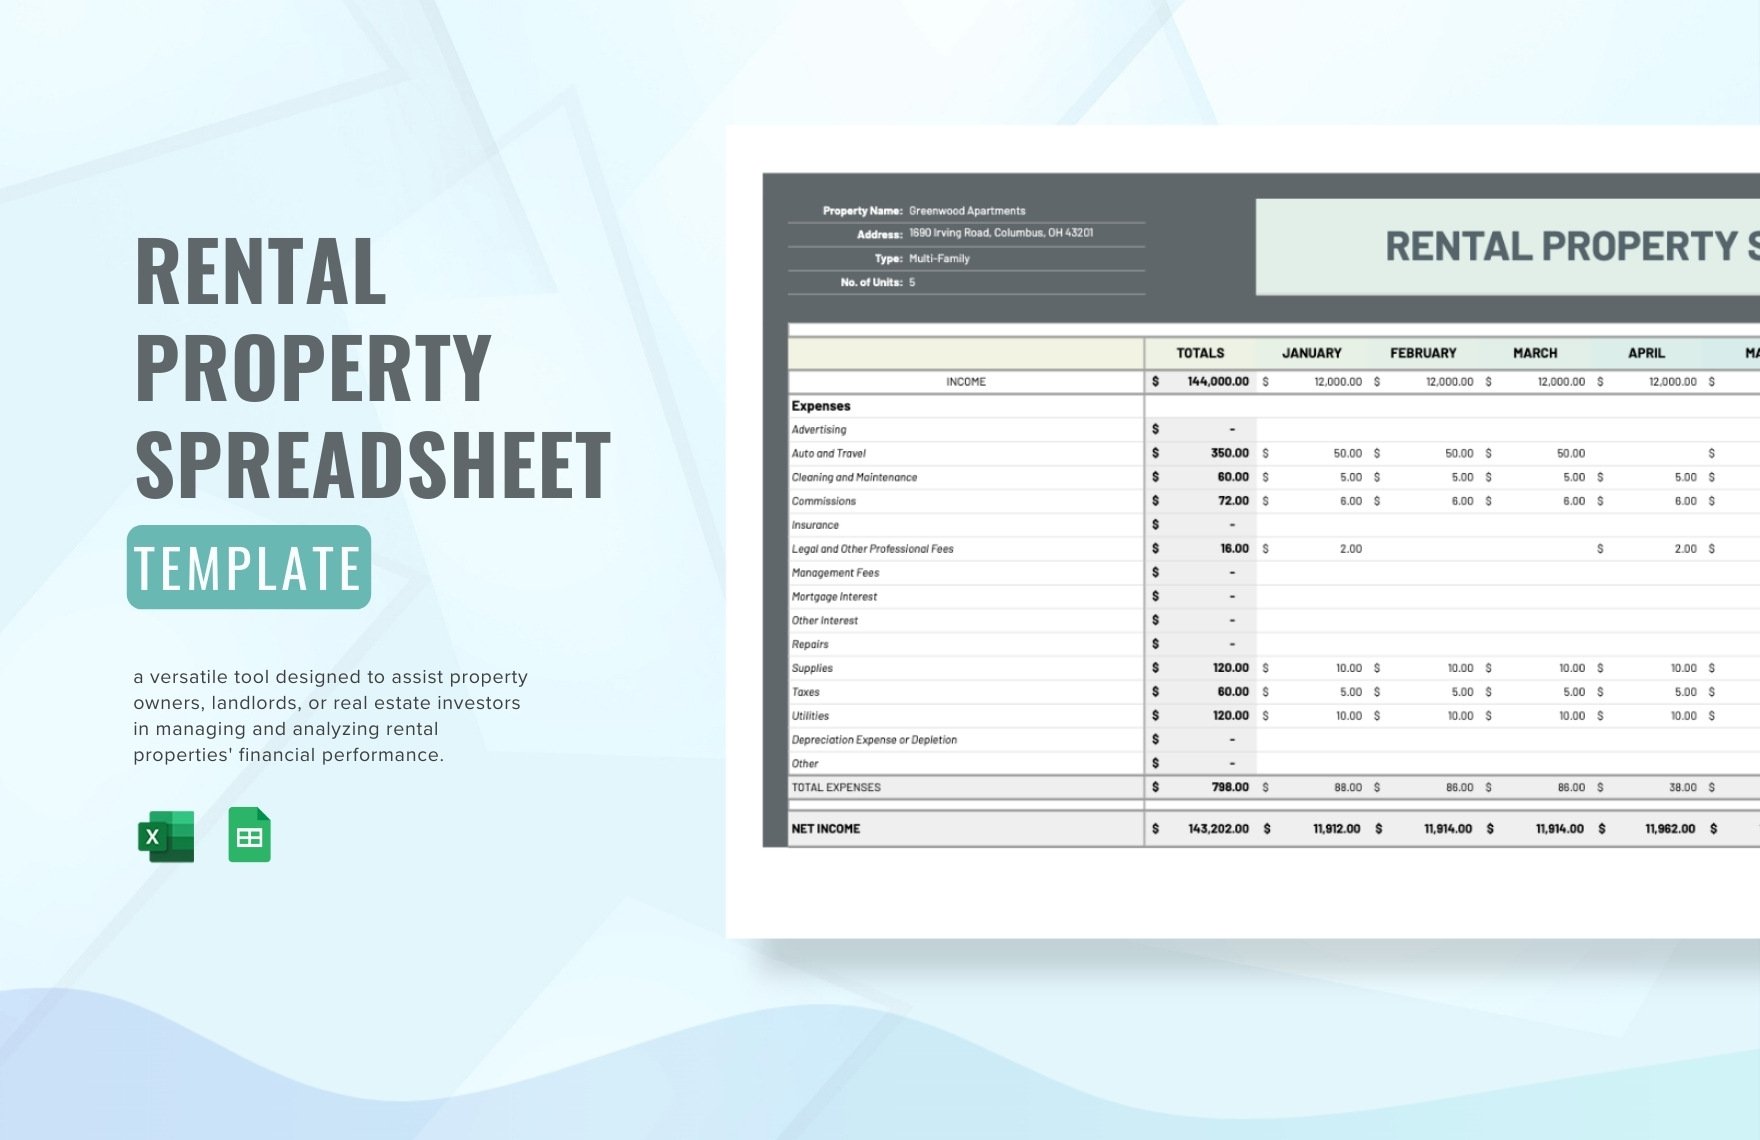
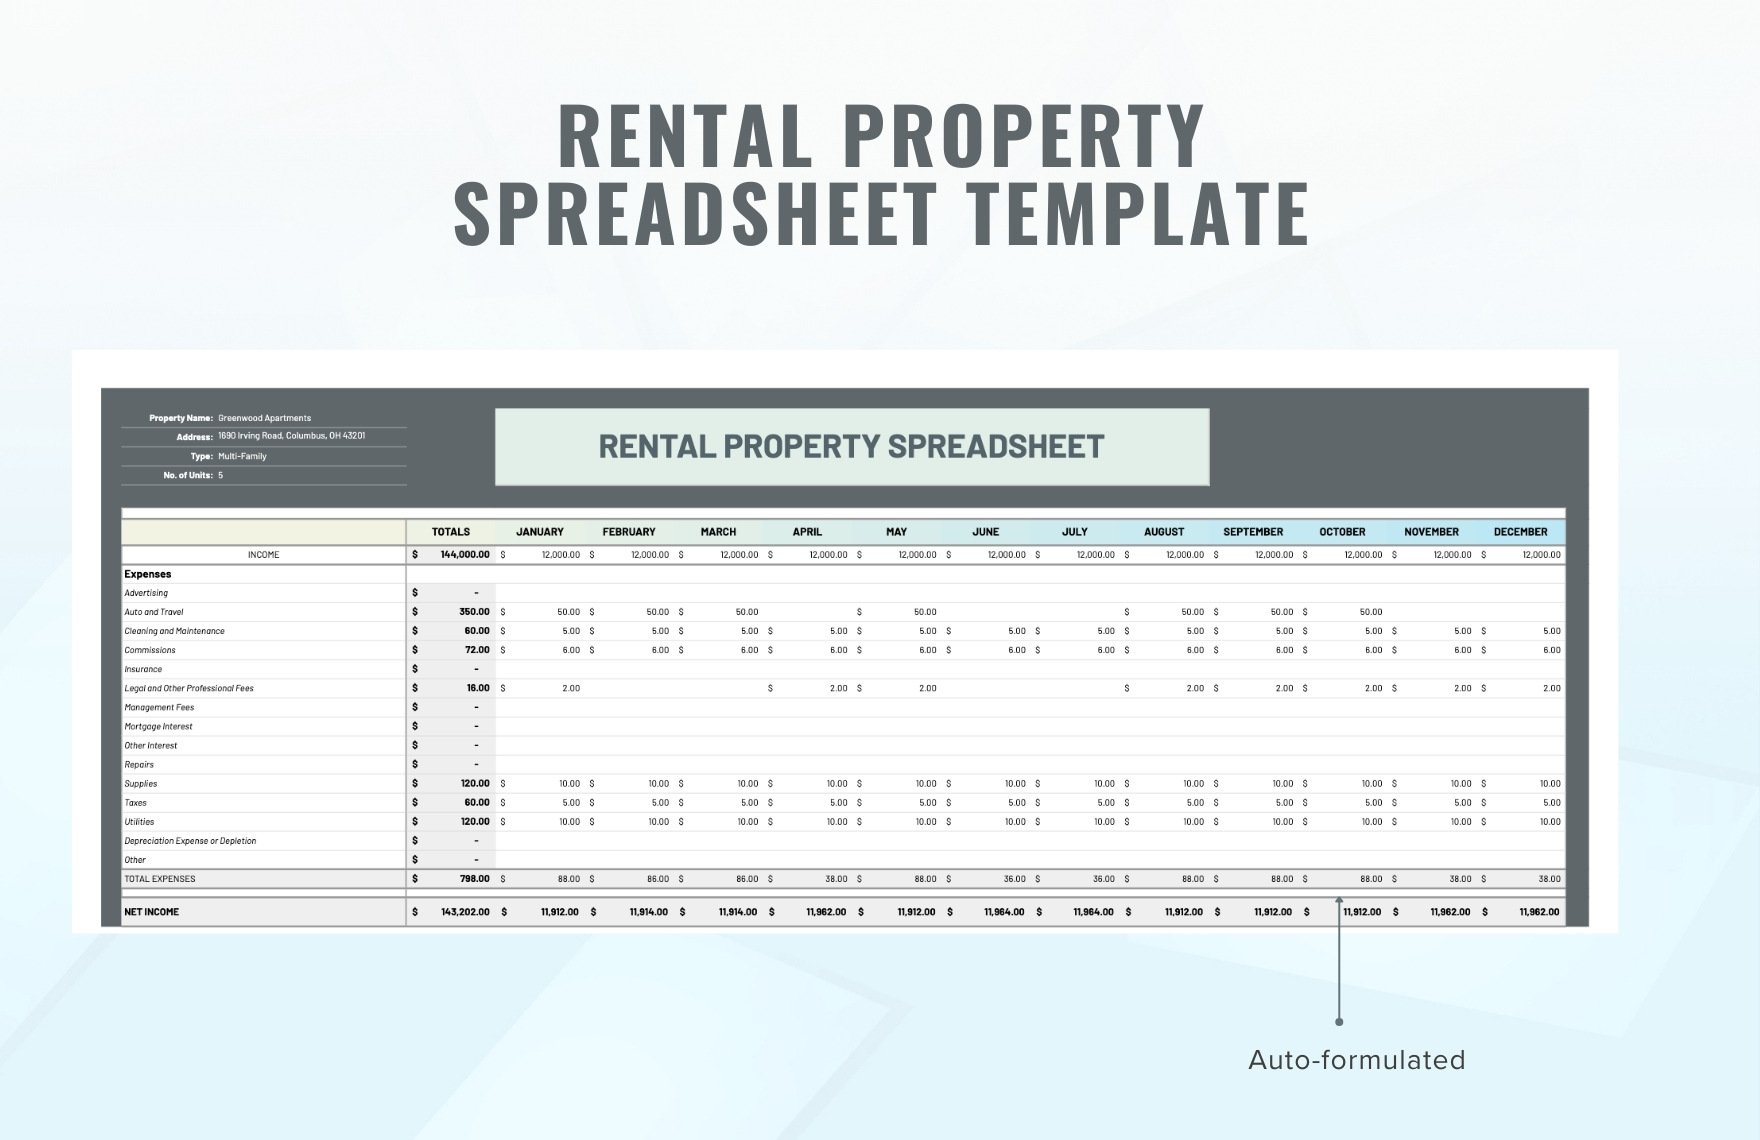
Operating Expenses
Separate fixed and variable costs to keep projections realistic:
- Property taxes, insurance, and HOA fees.
- Maintenance and repairs, usually modeled as a percentage of rent.
- Utilities if paid by the owner, property management fees, and vacancy allowance.
- Capital improvements and reserves for replacement assets.
Income Projections
Project rental income based on market rents and potential appreciation:
- Base rent per unit, rent growth assumptions.
- Occupancy rate and average days vacant.
- Additional income streams: laundry, parking, storage, or service fees.
Cash Flow Calculations
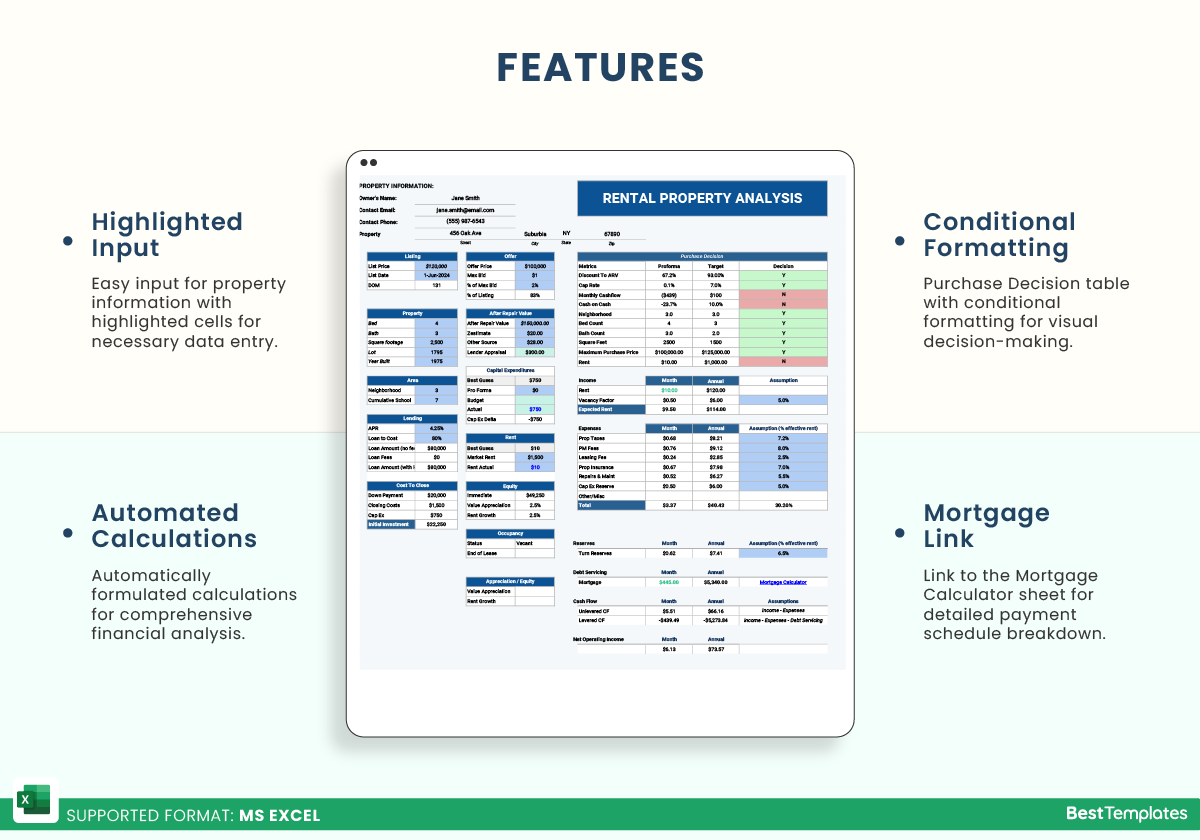
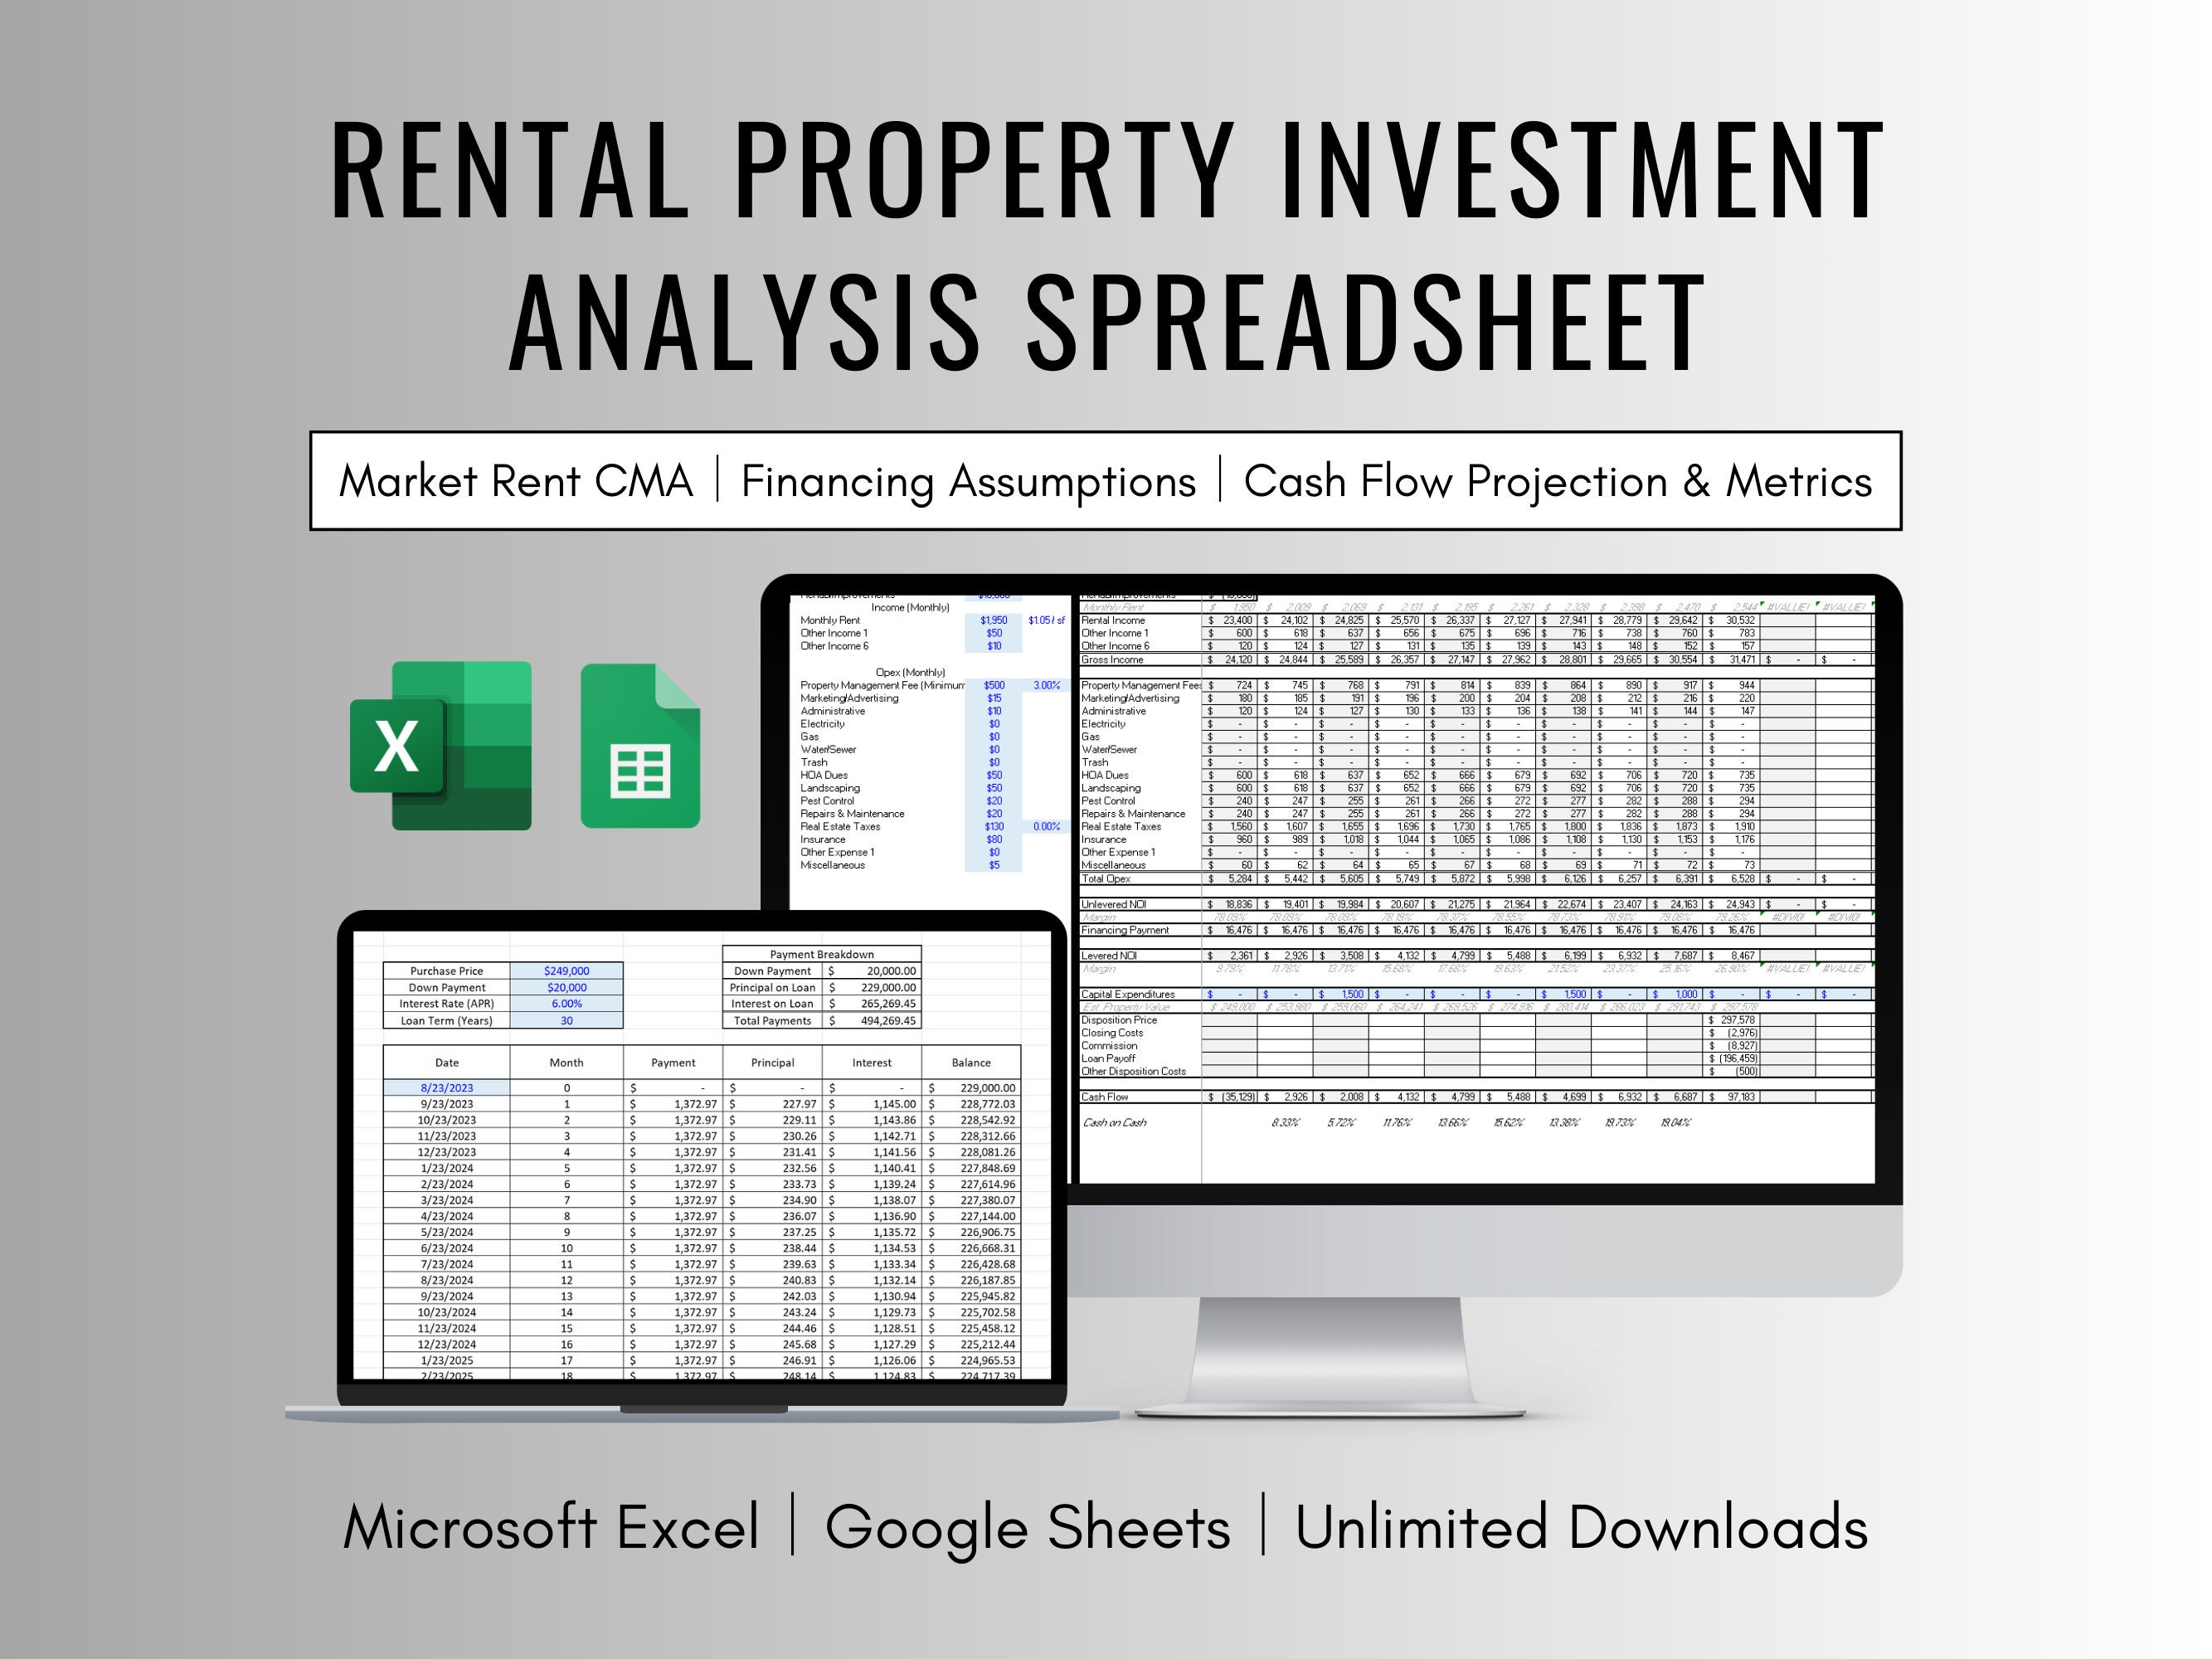
From gross income subtract operating expenses to arrive at net operating income (NOI). Then, deduct debt service to determine cash flow before taxes (CFBT). Finally, add tax benefits to compute after‑tax cash flow.
Return Metrics
Provide investors with quick, decisive numbers:
- Cash on Cash Return: (Annual CFBT ÷ Total Cash Invested) × 100.
- Internal Rate of Return (IRR): Uses projected cash flows over the holding period.
- Capitalization Rate: NOI ÷ Purchase Price.
- Equity Build‑Up: Track how much equity grows each year through amortization and appreciation.
Step‑by‑Step Setup of Your Spreadsheet
1. Create a Master Sheet
List all property details in a single sheet—address, purchase price, loan terms, and key dates. Use cell comments or a dedicated “Notes” column to document assumptions or source data.
2. Build the Income Section
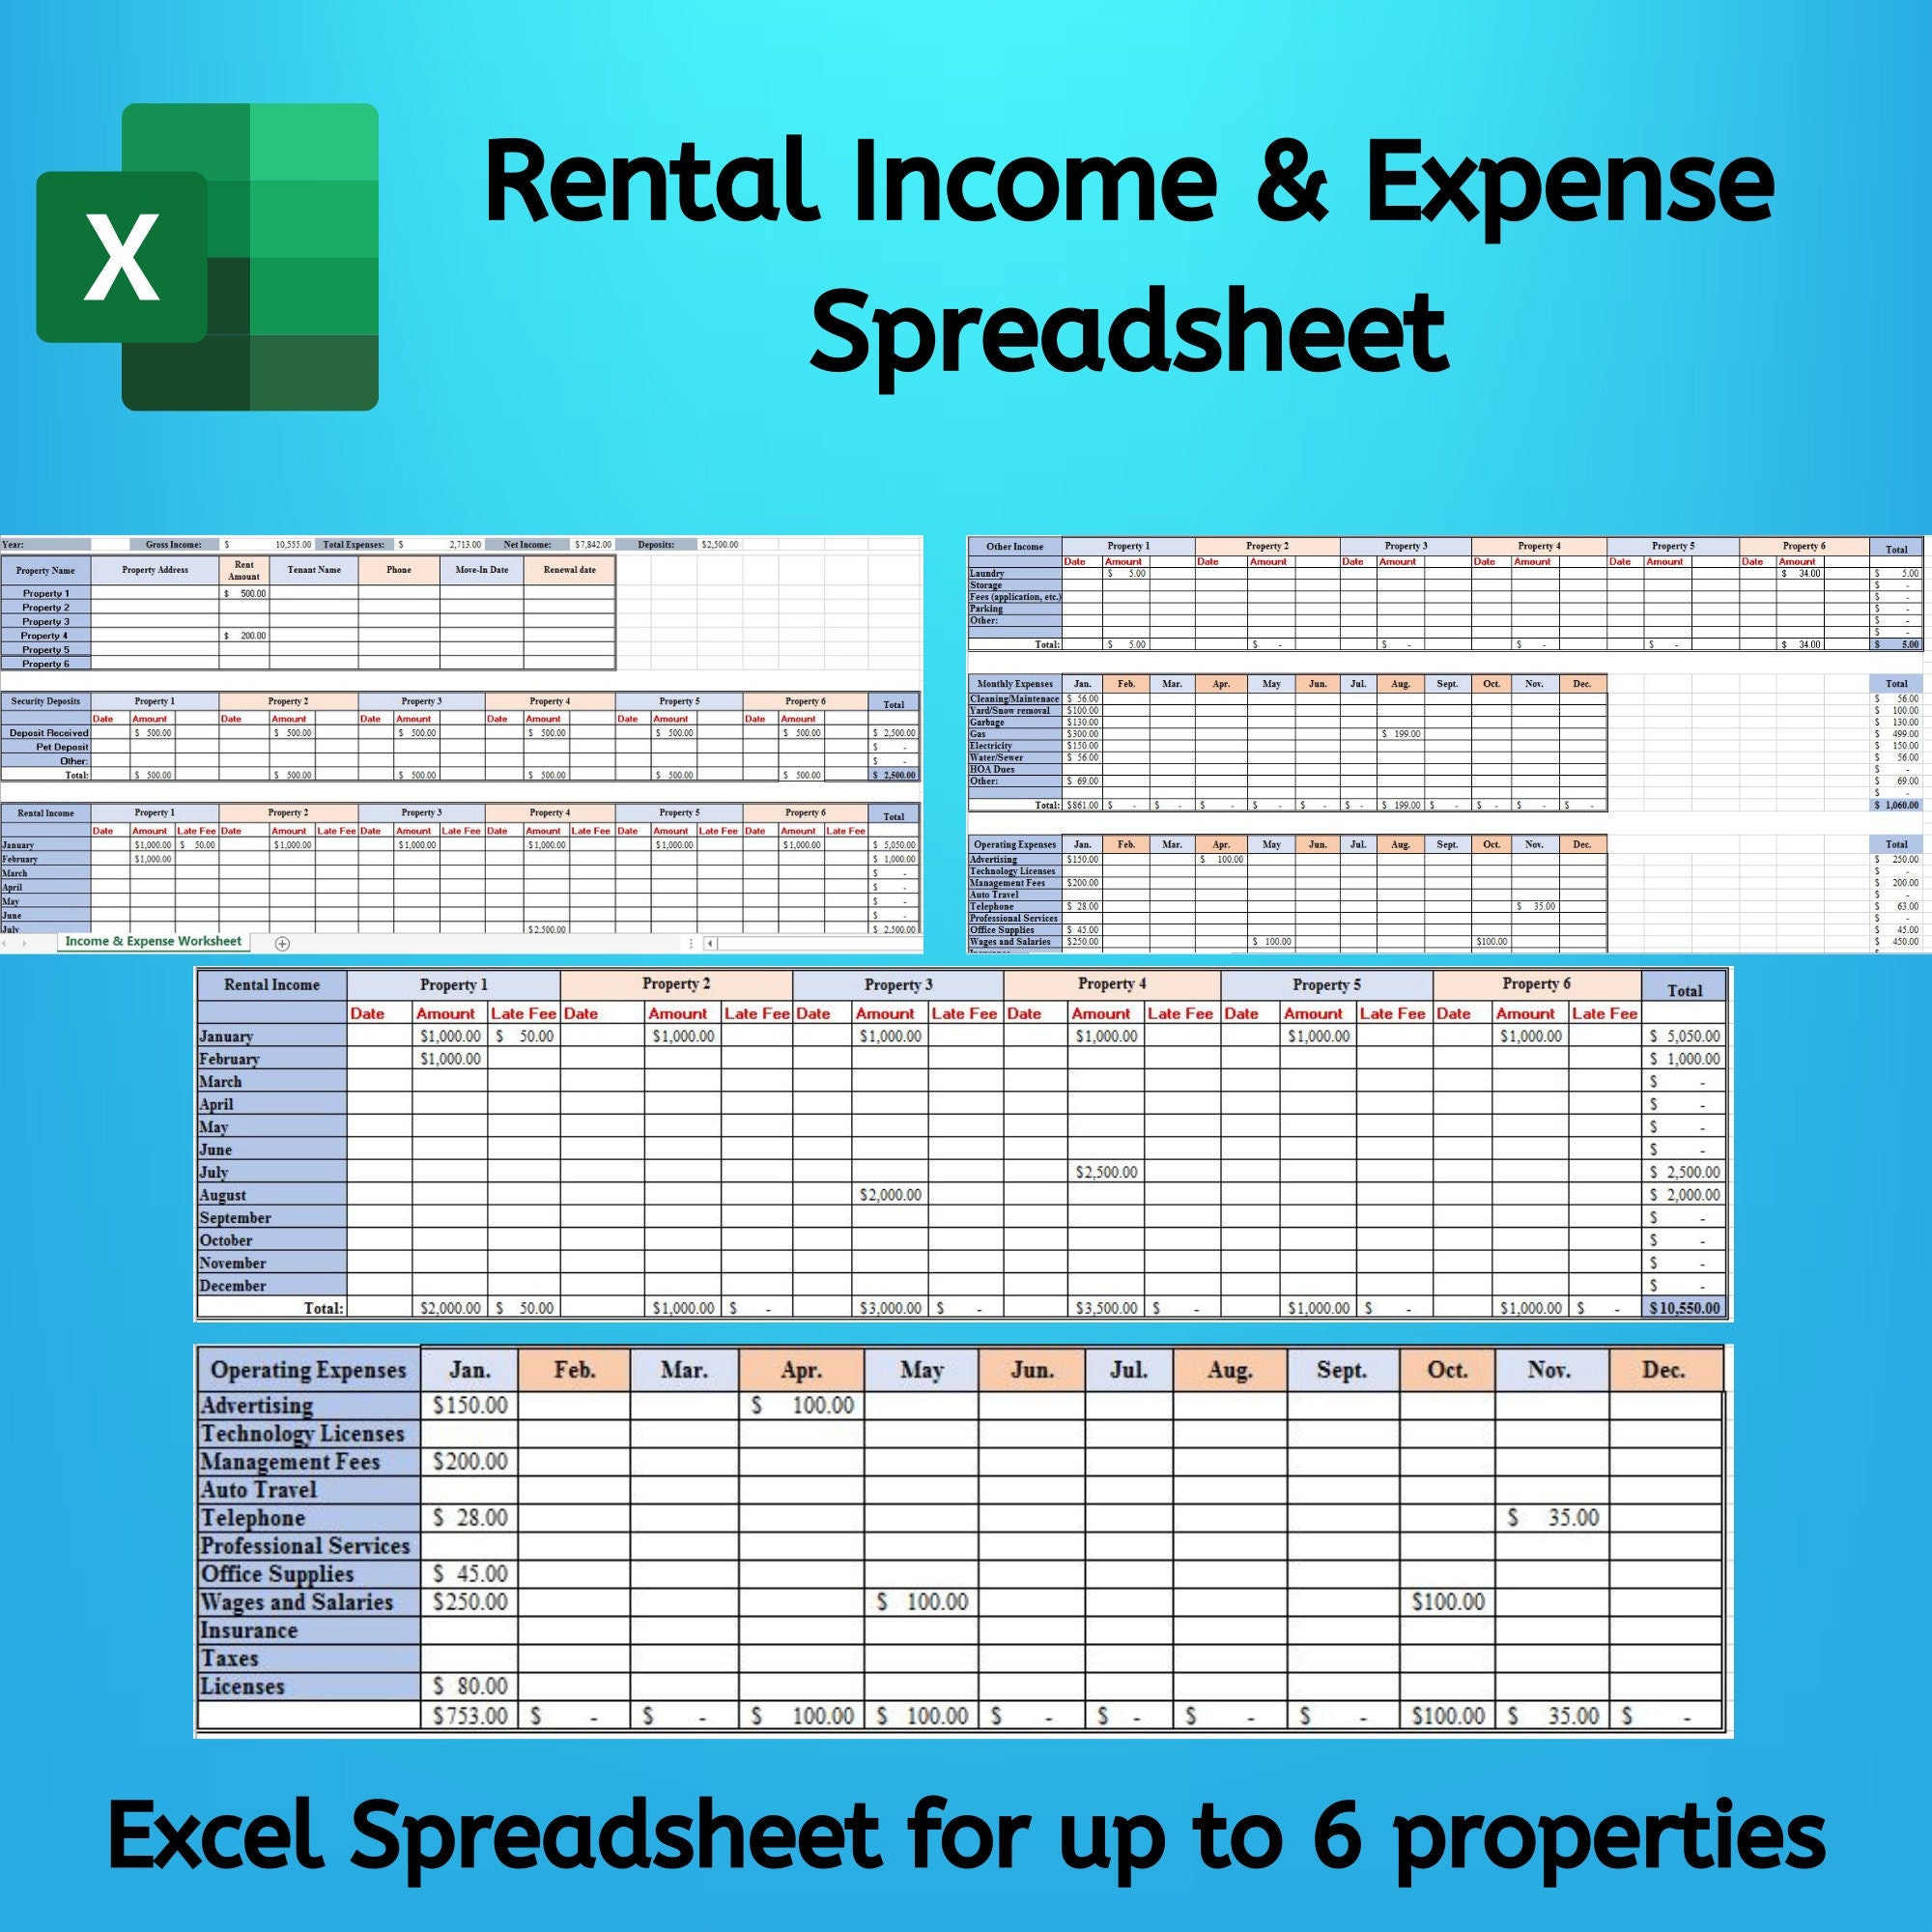
Set up a tab where you can enter monthly rents for each unit. Add formulas that calculate gross potential rent, adjust for vacancy, and produce the annual rent roll. Keep a separate column for rent growth assumptions to allow easy scenario analysis.
3. Add the Expense Tab
Here, input all recurring costs. Use drop‑down lists for items that may change (e.g., utilities). Add a “Reserves for Replacement” row that scales with the property’s size or age.
4. Debt Service Worksheet
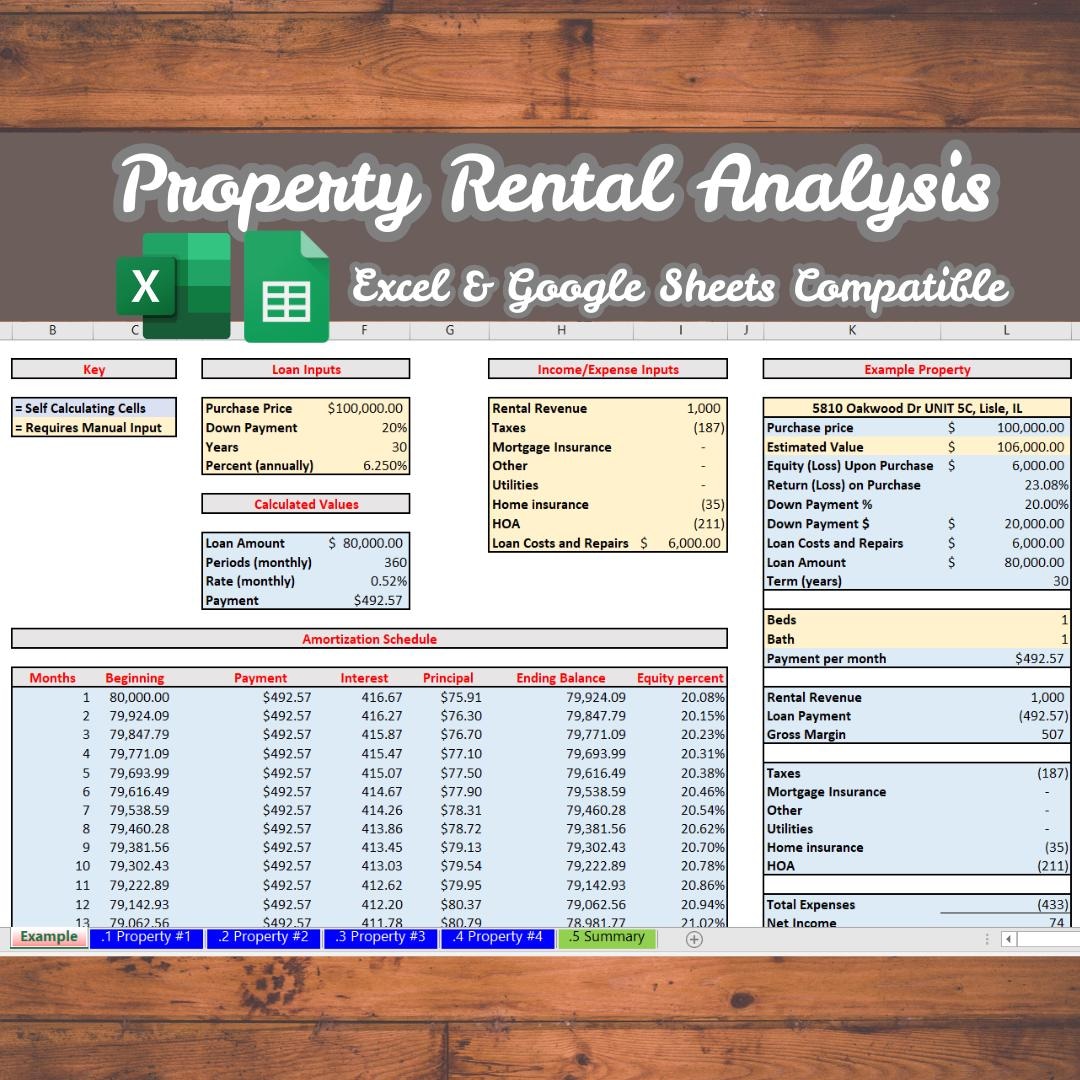
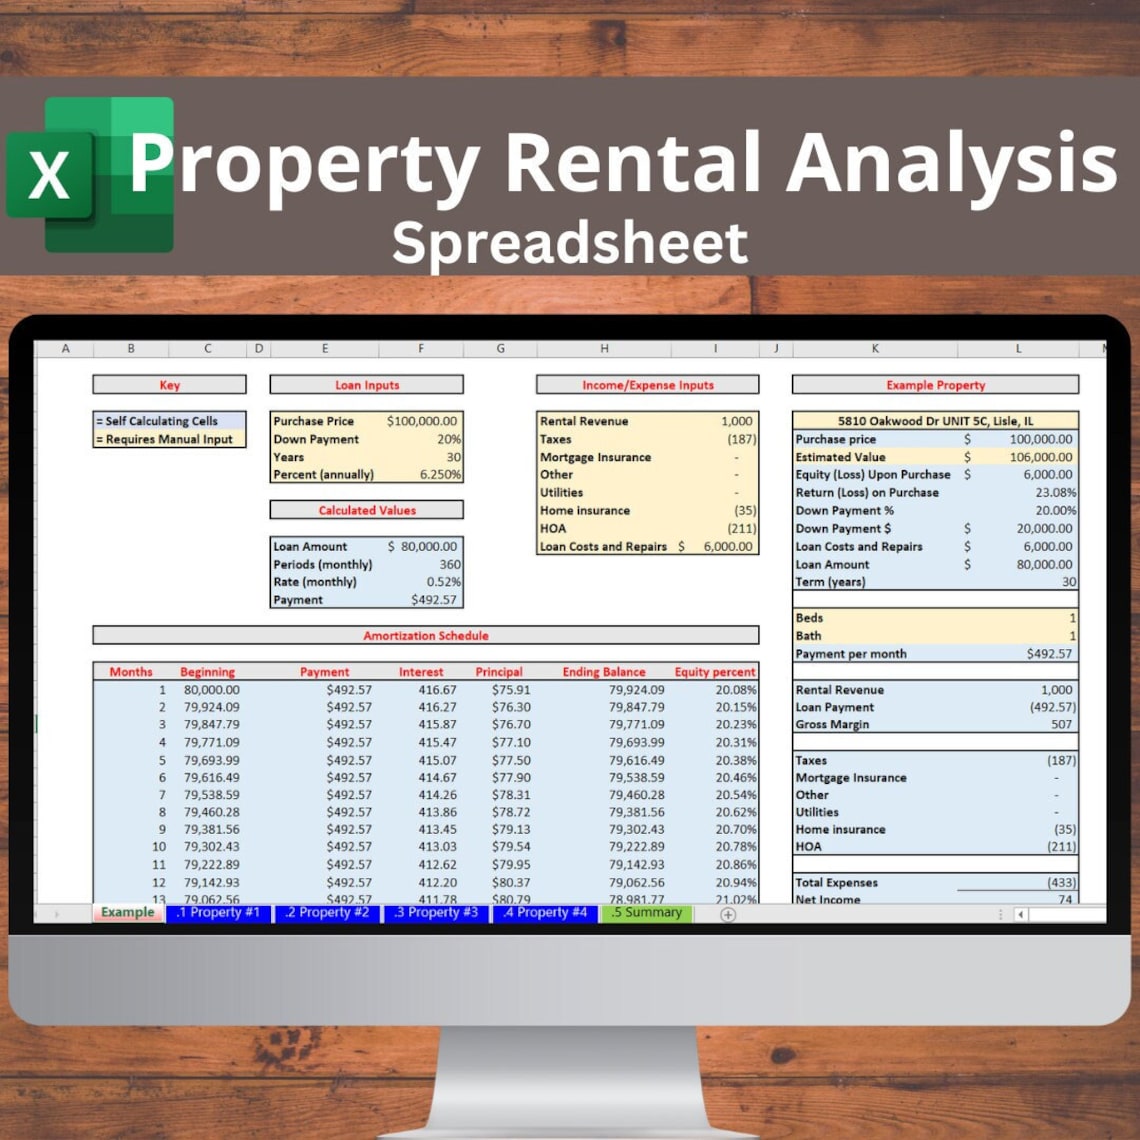
Enter loan details and use the PMT function to compute monthly payments. Include a section for balloon payments or refinance scenarios. Link this output to the cash flow calculation.
5. Calculate Cash Flow and Returns
Using simple arithmetic, subtract operating expenses and debt service from gross income. Add tax deductions—property depreciation, mortgage interest—and calculate net profit. Link the results to a “Summary” sheet that displays all key metrics.
6. Design a Dashboard
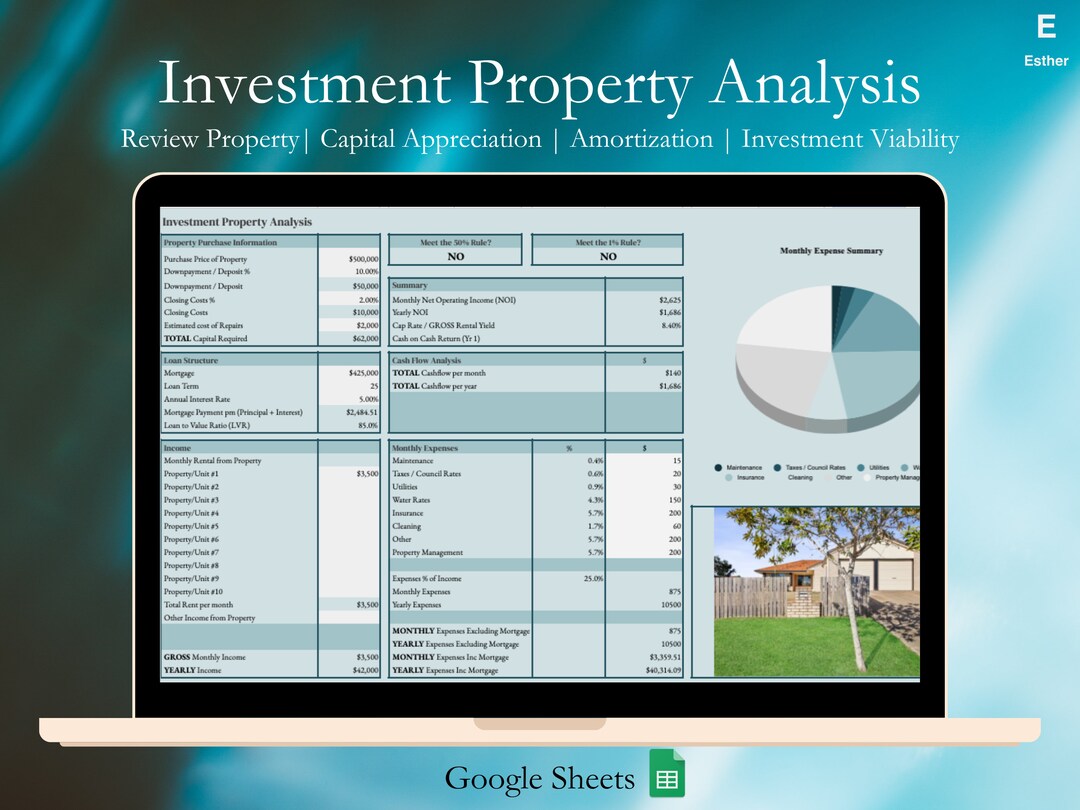
For quick reference, build a visual dashboard with charts: a bar graph of annual cash flows, a line chart of equity build‑up, and a pie chart of expense distribution. Conditional formatting can highlight red‑flag items, such as negative cash flow or low cash‑on‑cash return.
Common Mistakes to Avoid
Ignoring Vacancy and Turnover Costs
Assume 95% occupancy and underestimate the expense of tenant turnover. A realistic vacancy allowance of 3-5% protects cash flow projections.
Overlooking Capital Expenditure Reserves
Large assets like HVAC or roof replacements require dedicated reserves. Failing to account for these can wipe out apparent profitability.
Using Static Rent Assumptions
Rental markets evolve. Incorporate an annual rent growth rate, but test multiple scenarios (3%, 5%, 7%) to gauge sensitivity.
Neglecting Tax Implications
Depreciation schedules and tax brackets alter after‑tax returns dramatically. Make sure your template calculates taxes or includes a “Tax Impact” placeholder for professional review.
Real‑World Example: Single‑Family Home

Imagine a $300,000 house purchased with a 20% down payment and a 5% interest mortgage. The spreadsheet would look like this:
- Purchase price: $300,000.
- Down payment: $60,000.
- Loan amount: $240,000.
- Monthly mortgage payment: $1,364 (using a 30‑year amortization).
- Annual gross rent: $24,000 (assuming $2,000 per month).
- Vacancy allowance: 5% ($1,200).
- Operating expenses: $6,000 (taxes, insurance, maintenance).
- NOI: $16,800.
- Cash on Cash Return: 9% (($12,800 ÷ $60,000) × 100).
By plugging these numbers into the template, you instantly see that the property yields healthy cash flow and a strong cash‑on‑cash return, while the dashboard highlights that the debt service consumes a sizable portion of the cash flow.
Advanced Features for Multi‑Unit Investments

Unit‑Level Breakdown
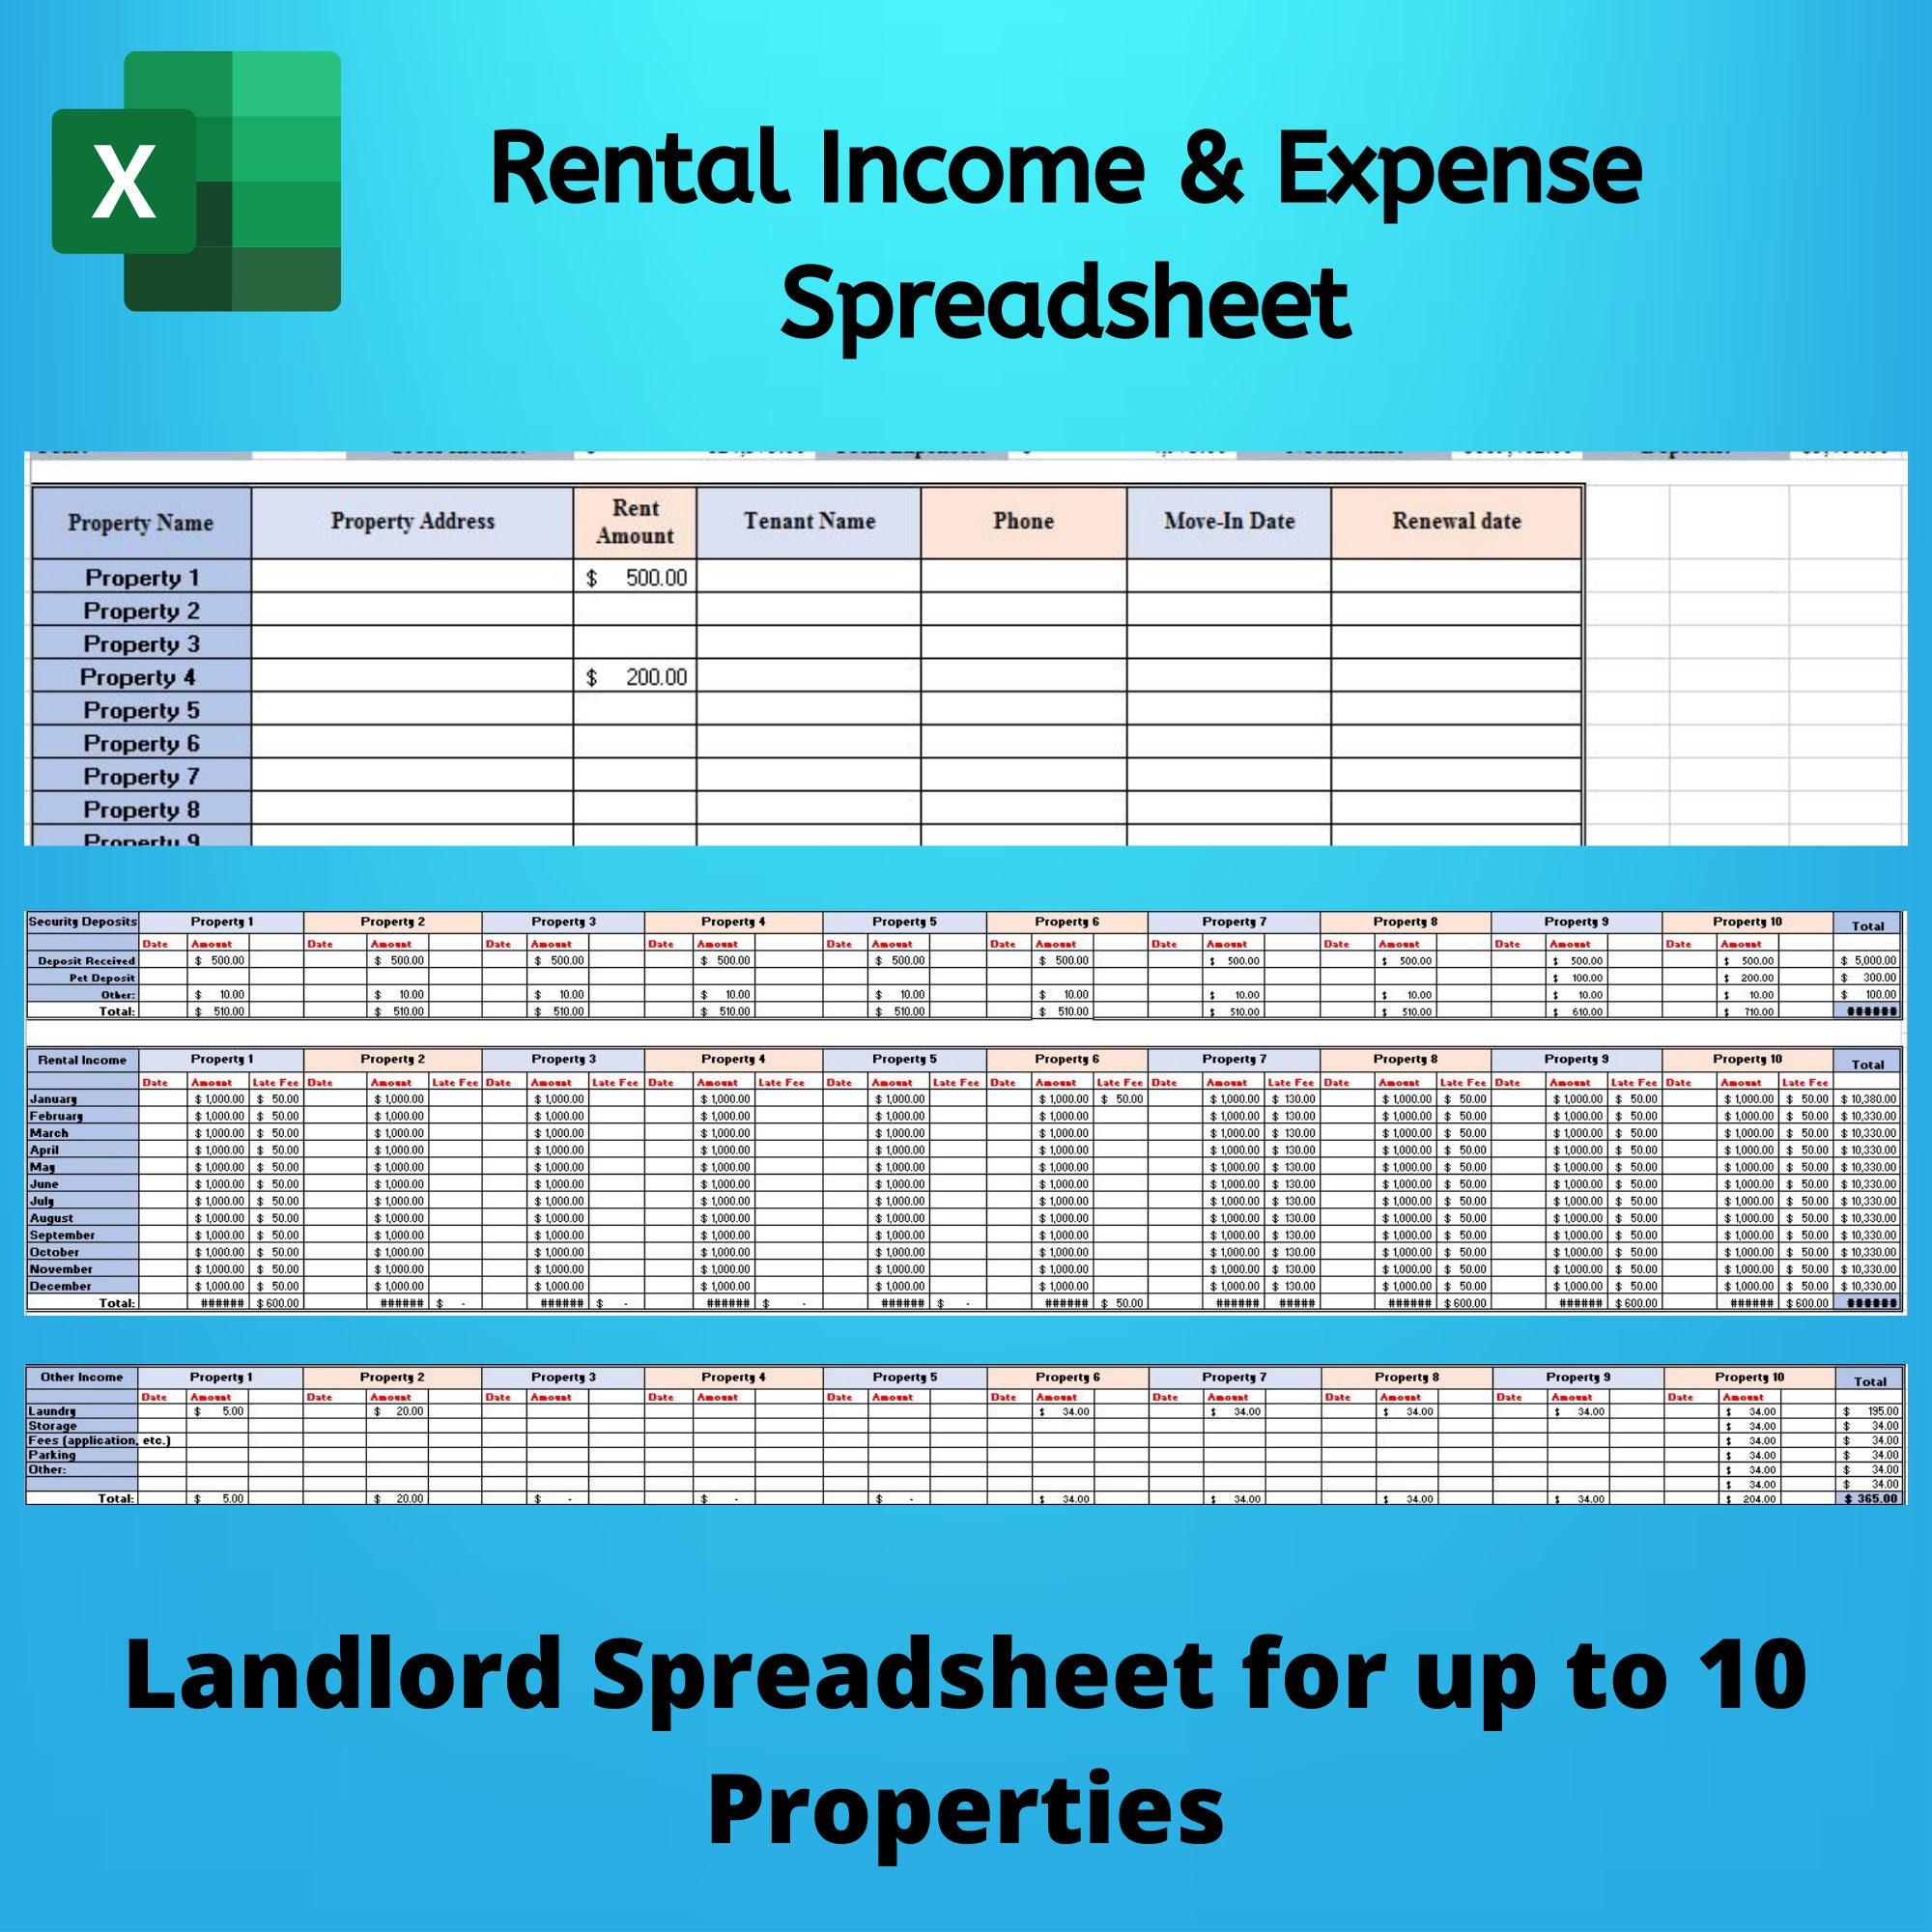
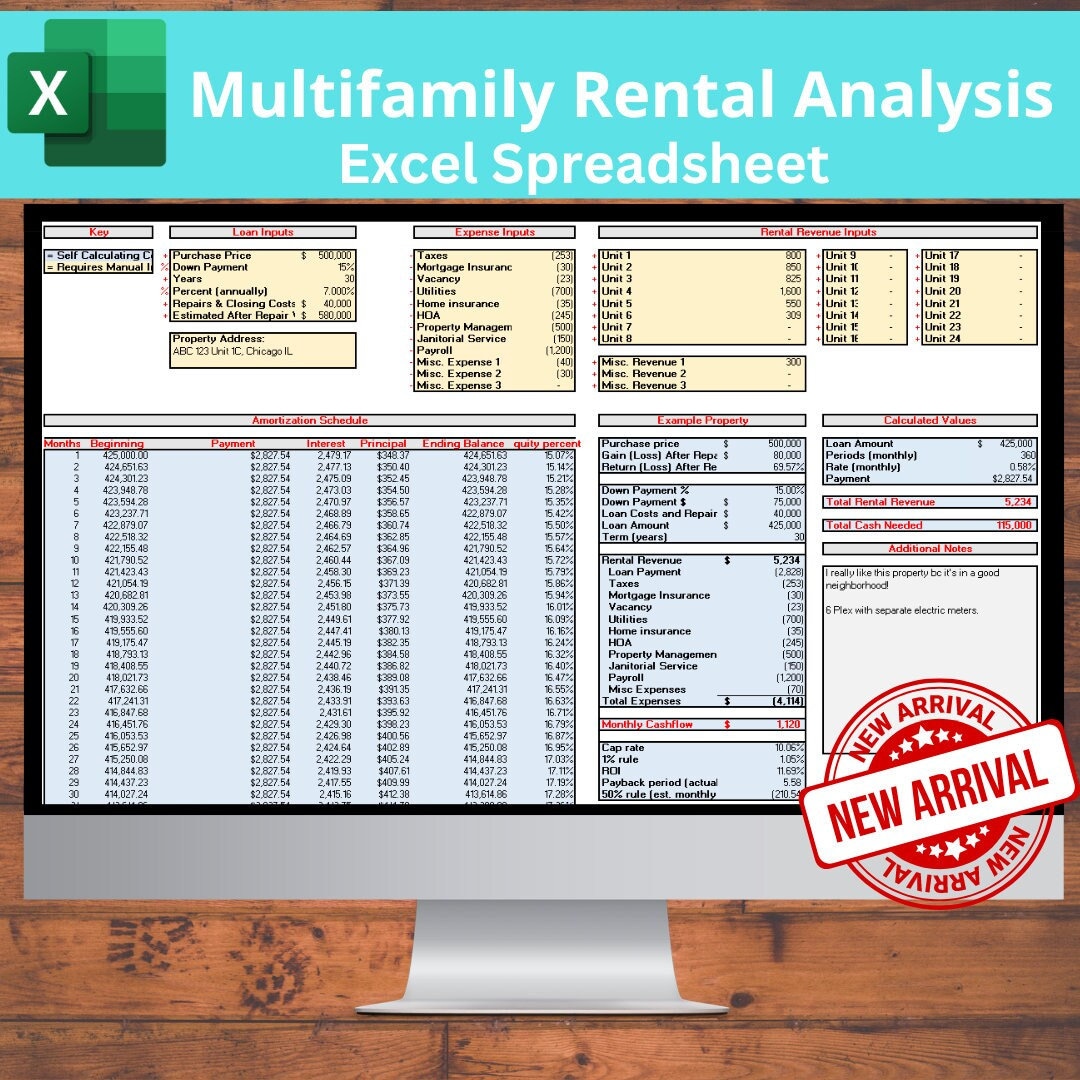
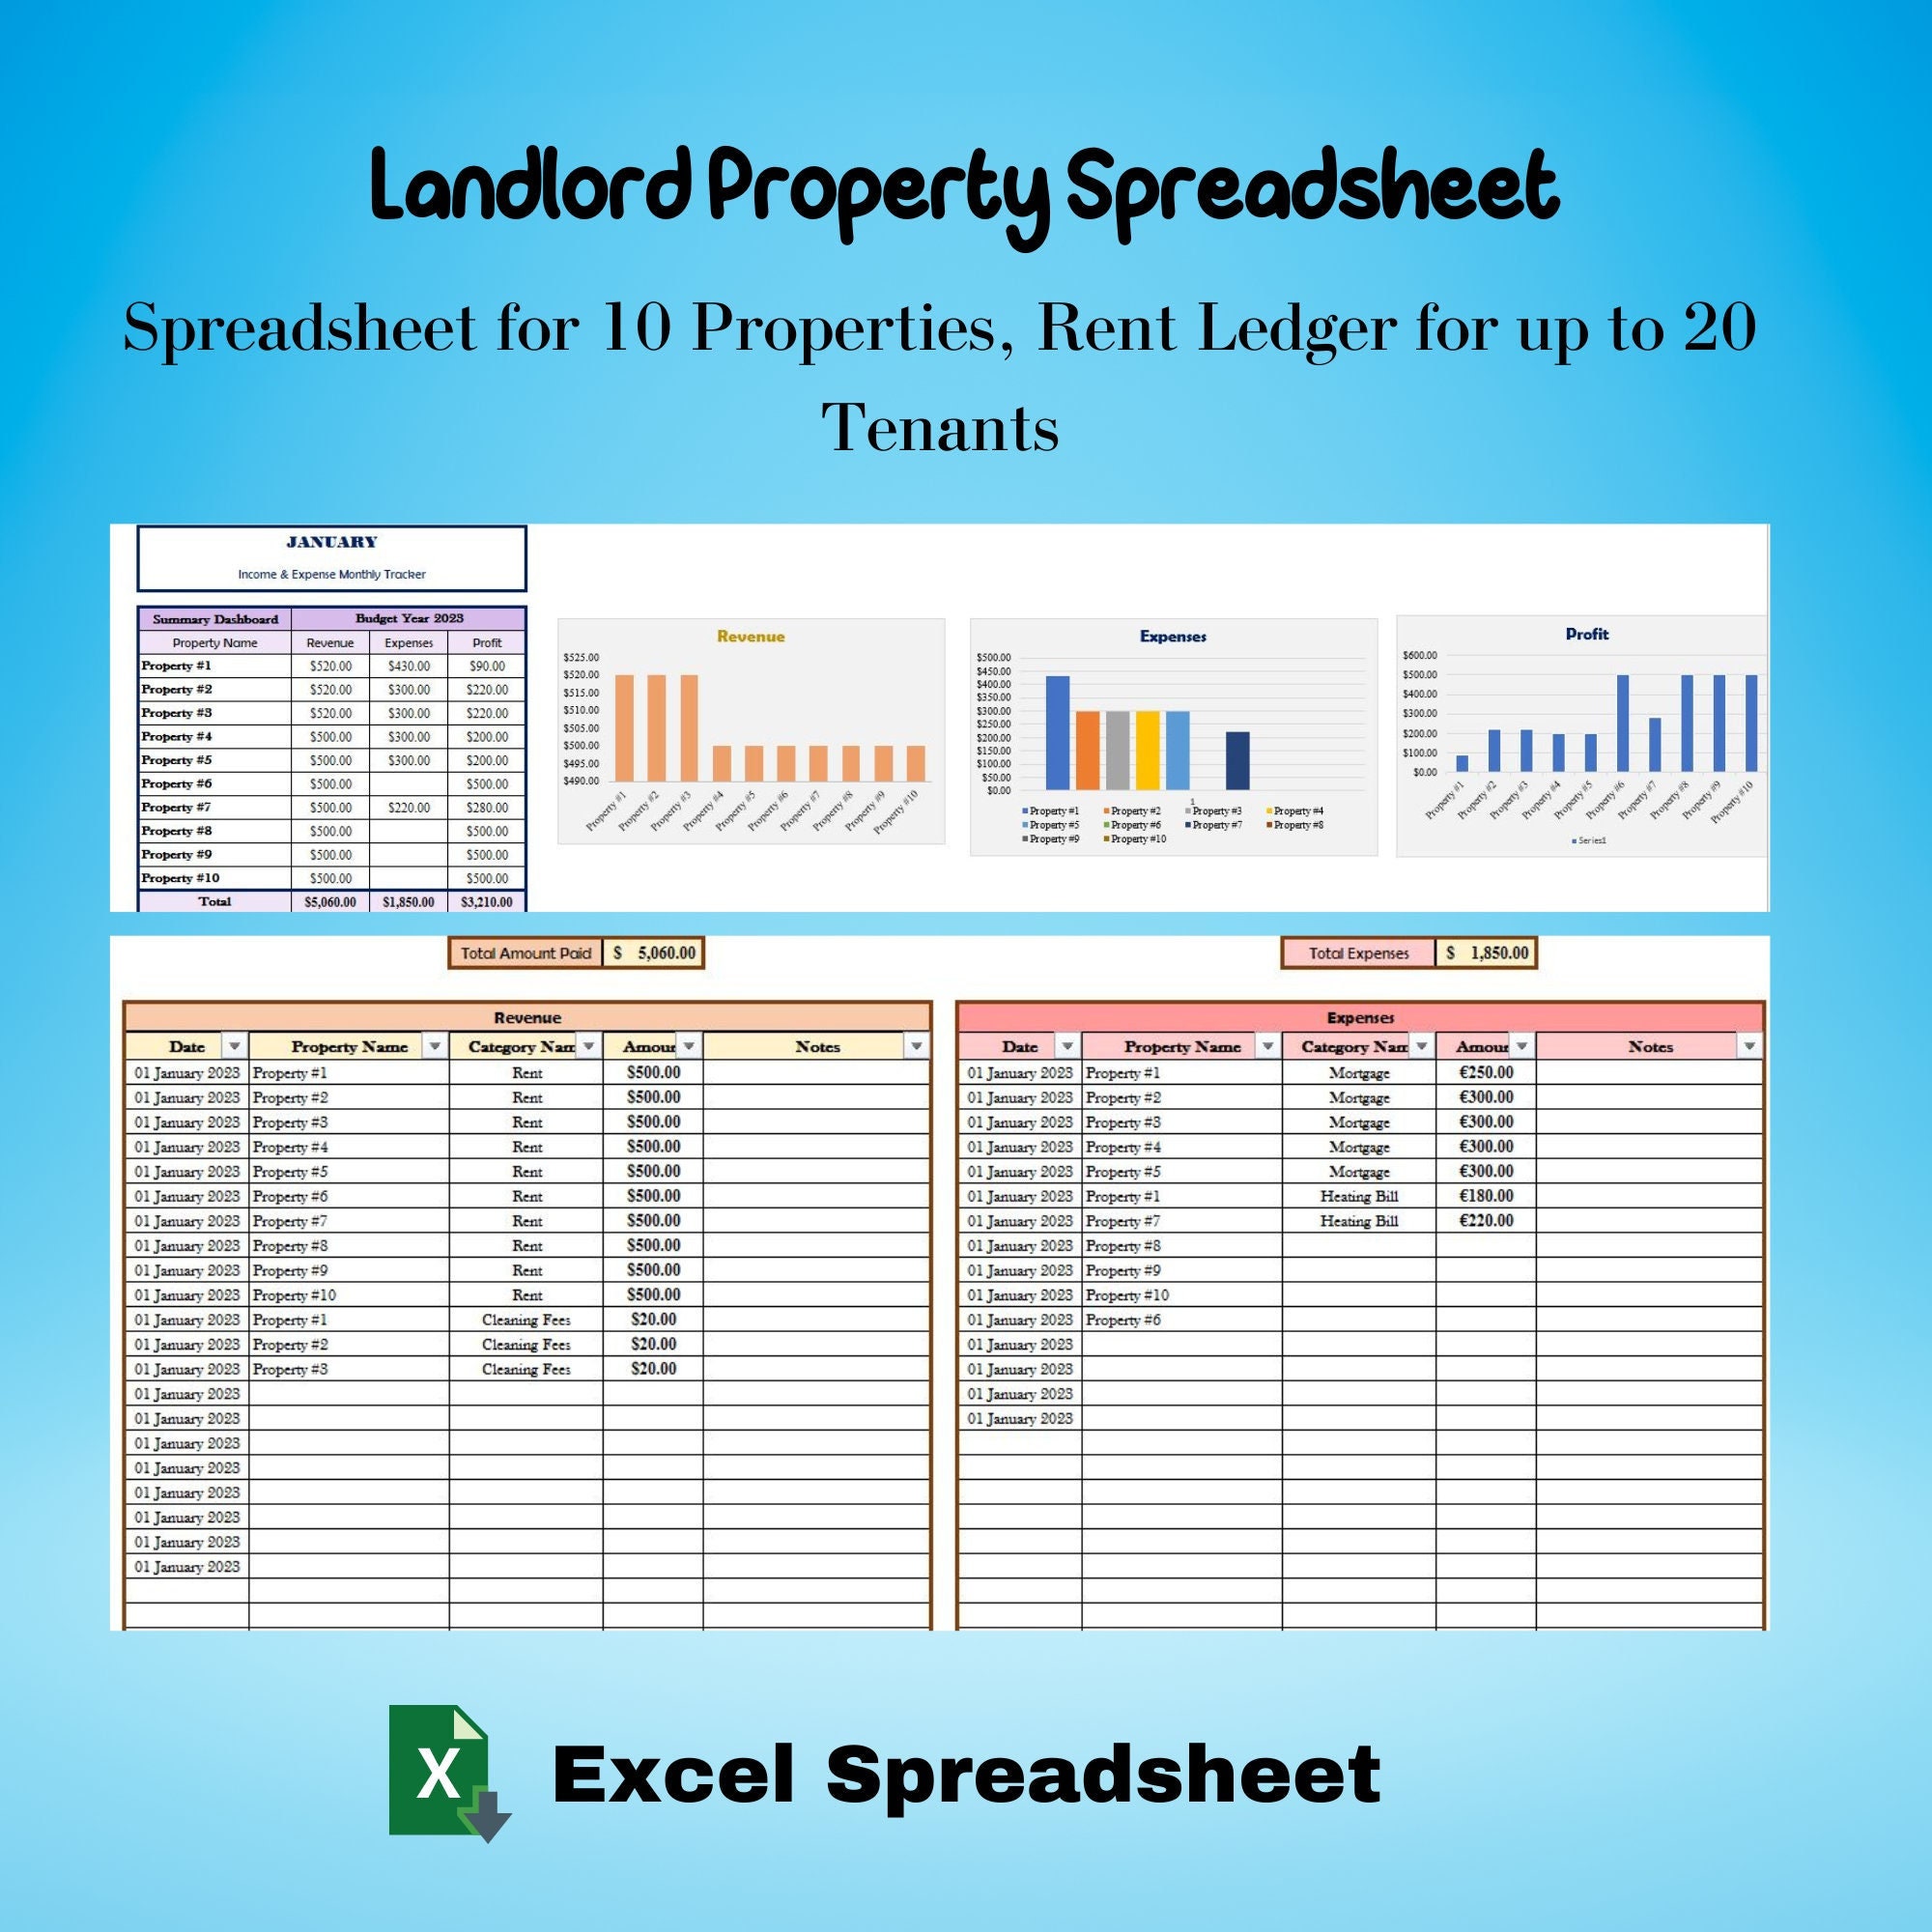
For apartment complexes, create a row for each unit. Include unit size, rent, occupancy rate, and amenities. This granularity allows you to identify underperforming units quickly.
Lease Term Tracking
Automate lease expiration alerts by linking dates to a calendar. This helps in budgeting for rent renewals or vacancy periods.
Tax Lien and Deferred Tax Modeling
Large multi‑unit properties can benefit from tax incentive programs. Incorporate these into a separate “Tax Credits” tab to evaluate their impact on cash flow.
Scenario Matrix
Build a matrix where you vary vacancy, rent growth, and operating expenses simultaneously. Use a pivot table to see how each scenario changes the IRR and equity build‑up.
Integrating the Template with Your Financial Goals
Use the spreadsheet as part of a larger investment strategy:
- Define your target cash‑on‑cash return before you begin.
- Set a maximum acceptable debt ratio.
- Use the equity build‑up graph to plan future acquisitions or refinance points.
- Incorporate a “Portfolio View” where each property’s metrics aggregate for a high‑level snapshot.
Tips for Keeping Your Spreadsheet Updated
Automate Data Entry
Link external data sources—rent rolls, utility bills, or property management reports—using Excel’s Power Query. This reduces manual input errors and ensures real‑time accuracy.
Version Control
Save each significant update with a date stamp. Maintain a backup in the cloud to avoid data loss.
Regular Review Cadence
Schedule quarterly reviews to compare projected vs. actual figures. Adjust assumptions based on market shifts or property performance.
Teach Your Team
Provide a brief training session on the template’s functions. A shared understanding ensures consistency across reports and reduces misinterpretation.
Conclusion

In the competitive world of real estate investment, a well‑crafted Rental Property Analysis Spreadsheet Template is more than a spreadsheet—it is a strategic decision‑making engine. By systematically capturing every variable—from acquisition costs to future cash flow projections—you gain clarity, reduce risk, and unlock the potential of each investment. Whether you’re a seasoned investor or just starting, implementing a robust template today will streamline your analysis, empower you to negotiate better deals, and ultimately help you achieve your long‑term financial goals.




Related posts of "Rental Property Analysis Spreadsheet Template"
