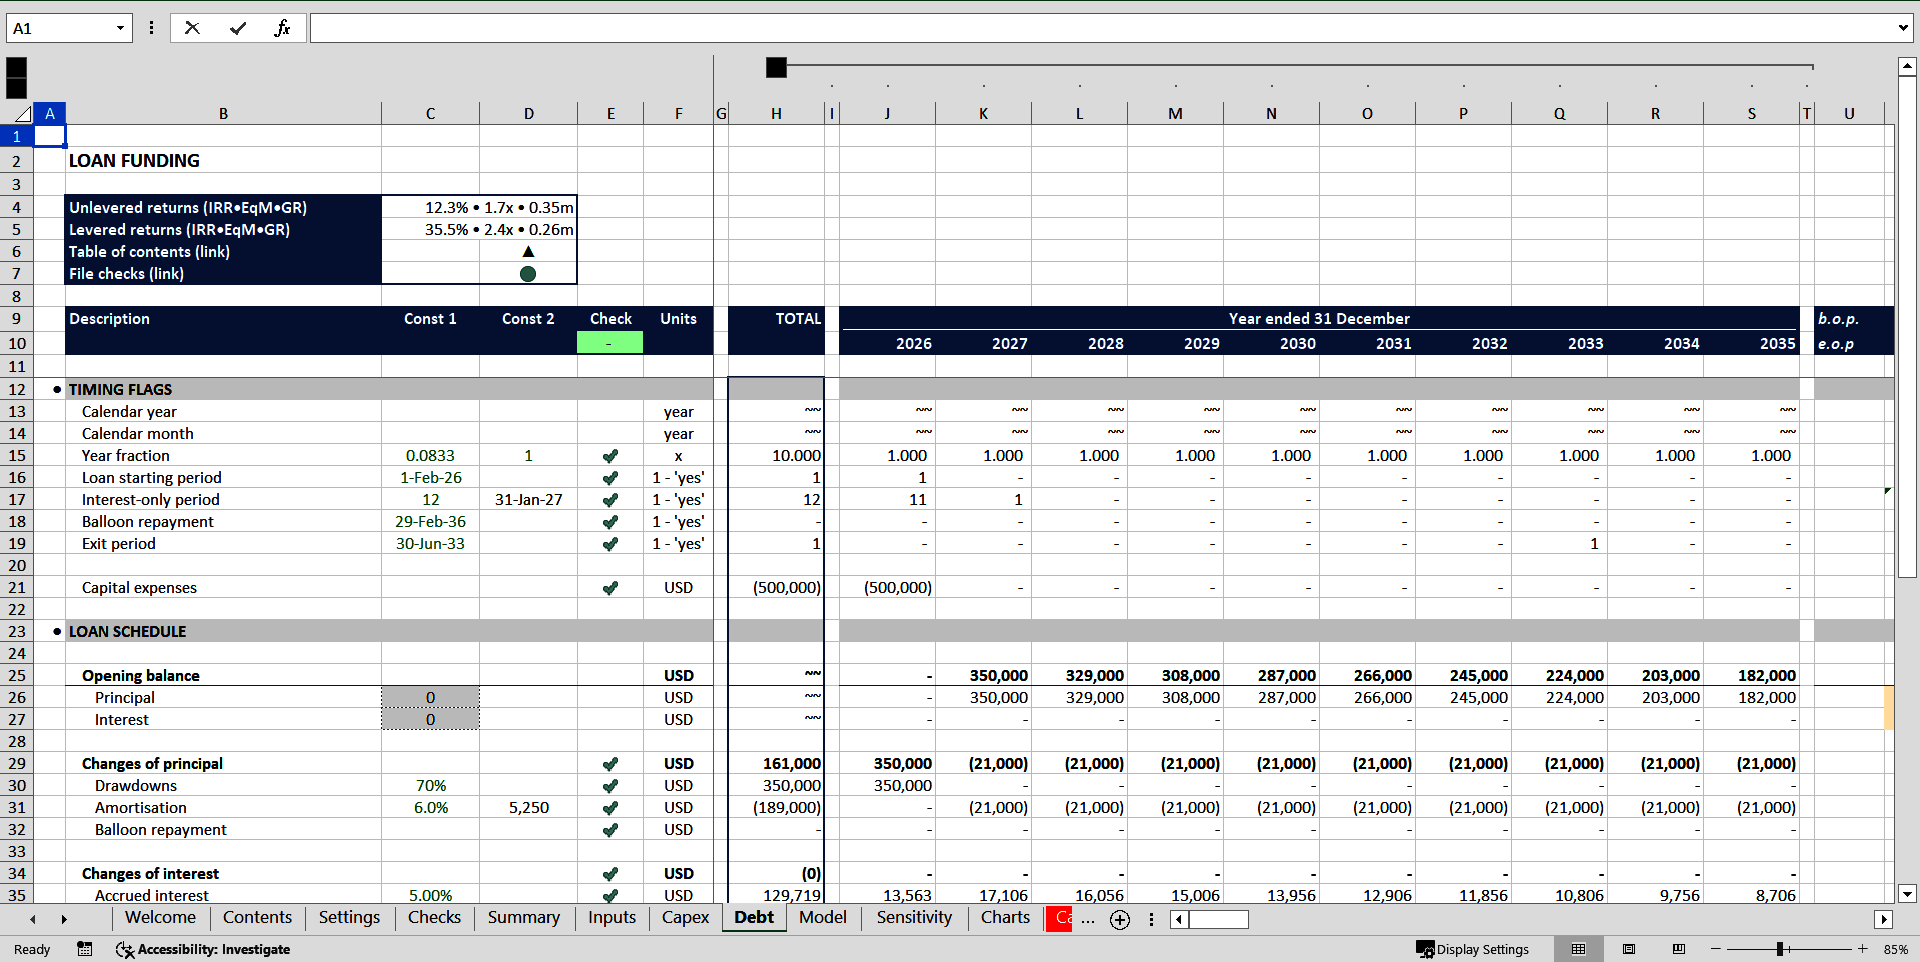
Lease Vs Buy Analysis Corporate Finance Excel Template is the Swiss Army knife of financial decision‑making for companies that wrestle with whether to keep their assets on the balance sheet or keep them off it. Think of it as a spreadsheet superhero that swoops in, saves the day, and tells you whether you’re better off buying a shiny new piece of equipment or just paying someone else to keep it in the shop. Buckle up, because we’re about to dive into the fun, the facts, and the spreadsheet wizardry that makes this template a must‑have in every CFO’s toolkit.
Why the Lease Vs Buy Debate Is Like Choosing Between Coffee and Tea
Picture this: you’re in a bustling office, the aroma of freshly brewed coffee wafting through the air. Your CFO friend shouts, “We need that new server!” Your accountant whispers, “Do we buy it or lease it?” Suddenly, you’re stuck in a caffeine‑fueled version of the classic “coffee or tea” debate. The choice seems simple, but the implications ripple across balance sheets, tax codes, and even your company’s future brand image. The Lease Vs Buy Analysis Corporate Finance Excel Template is the guide that takes you from caffeine confusion to crystal‑clear clarity.
Crunching Numbers: The Core Mechanics of the Template
What the Spreadsheet Actually Does
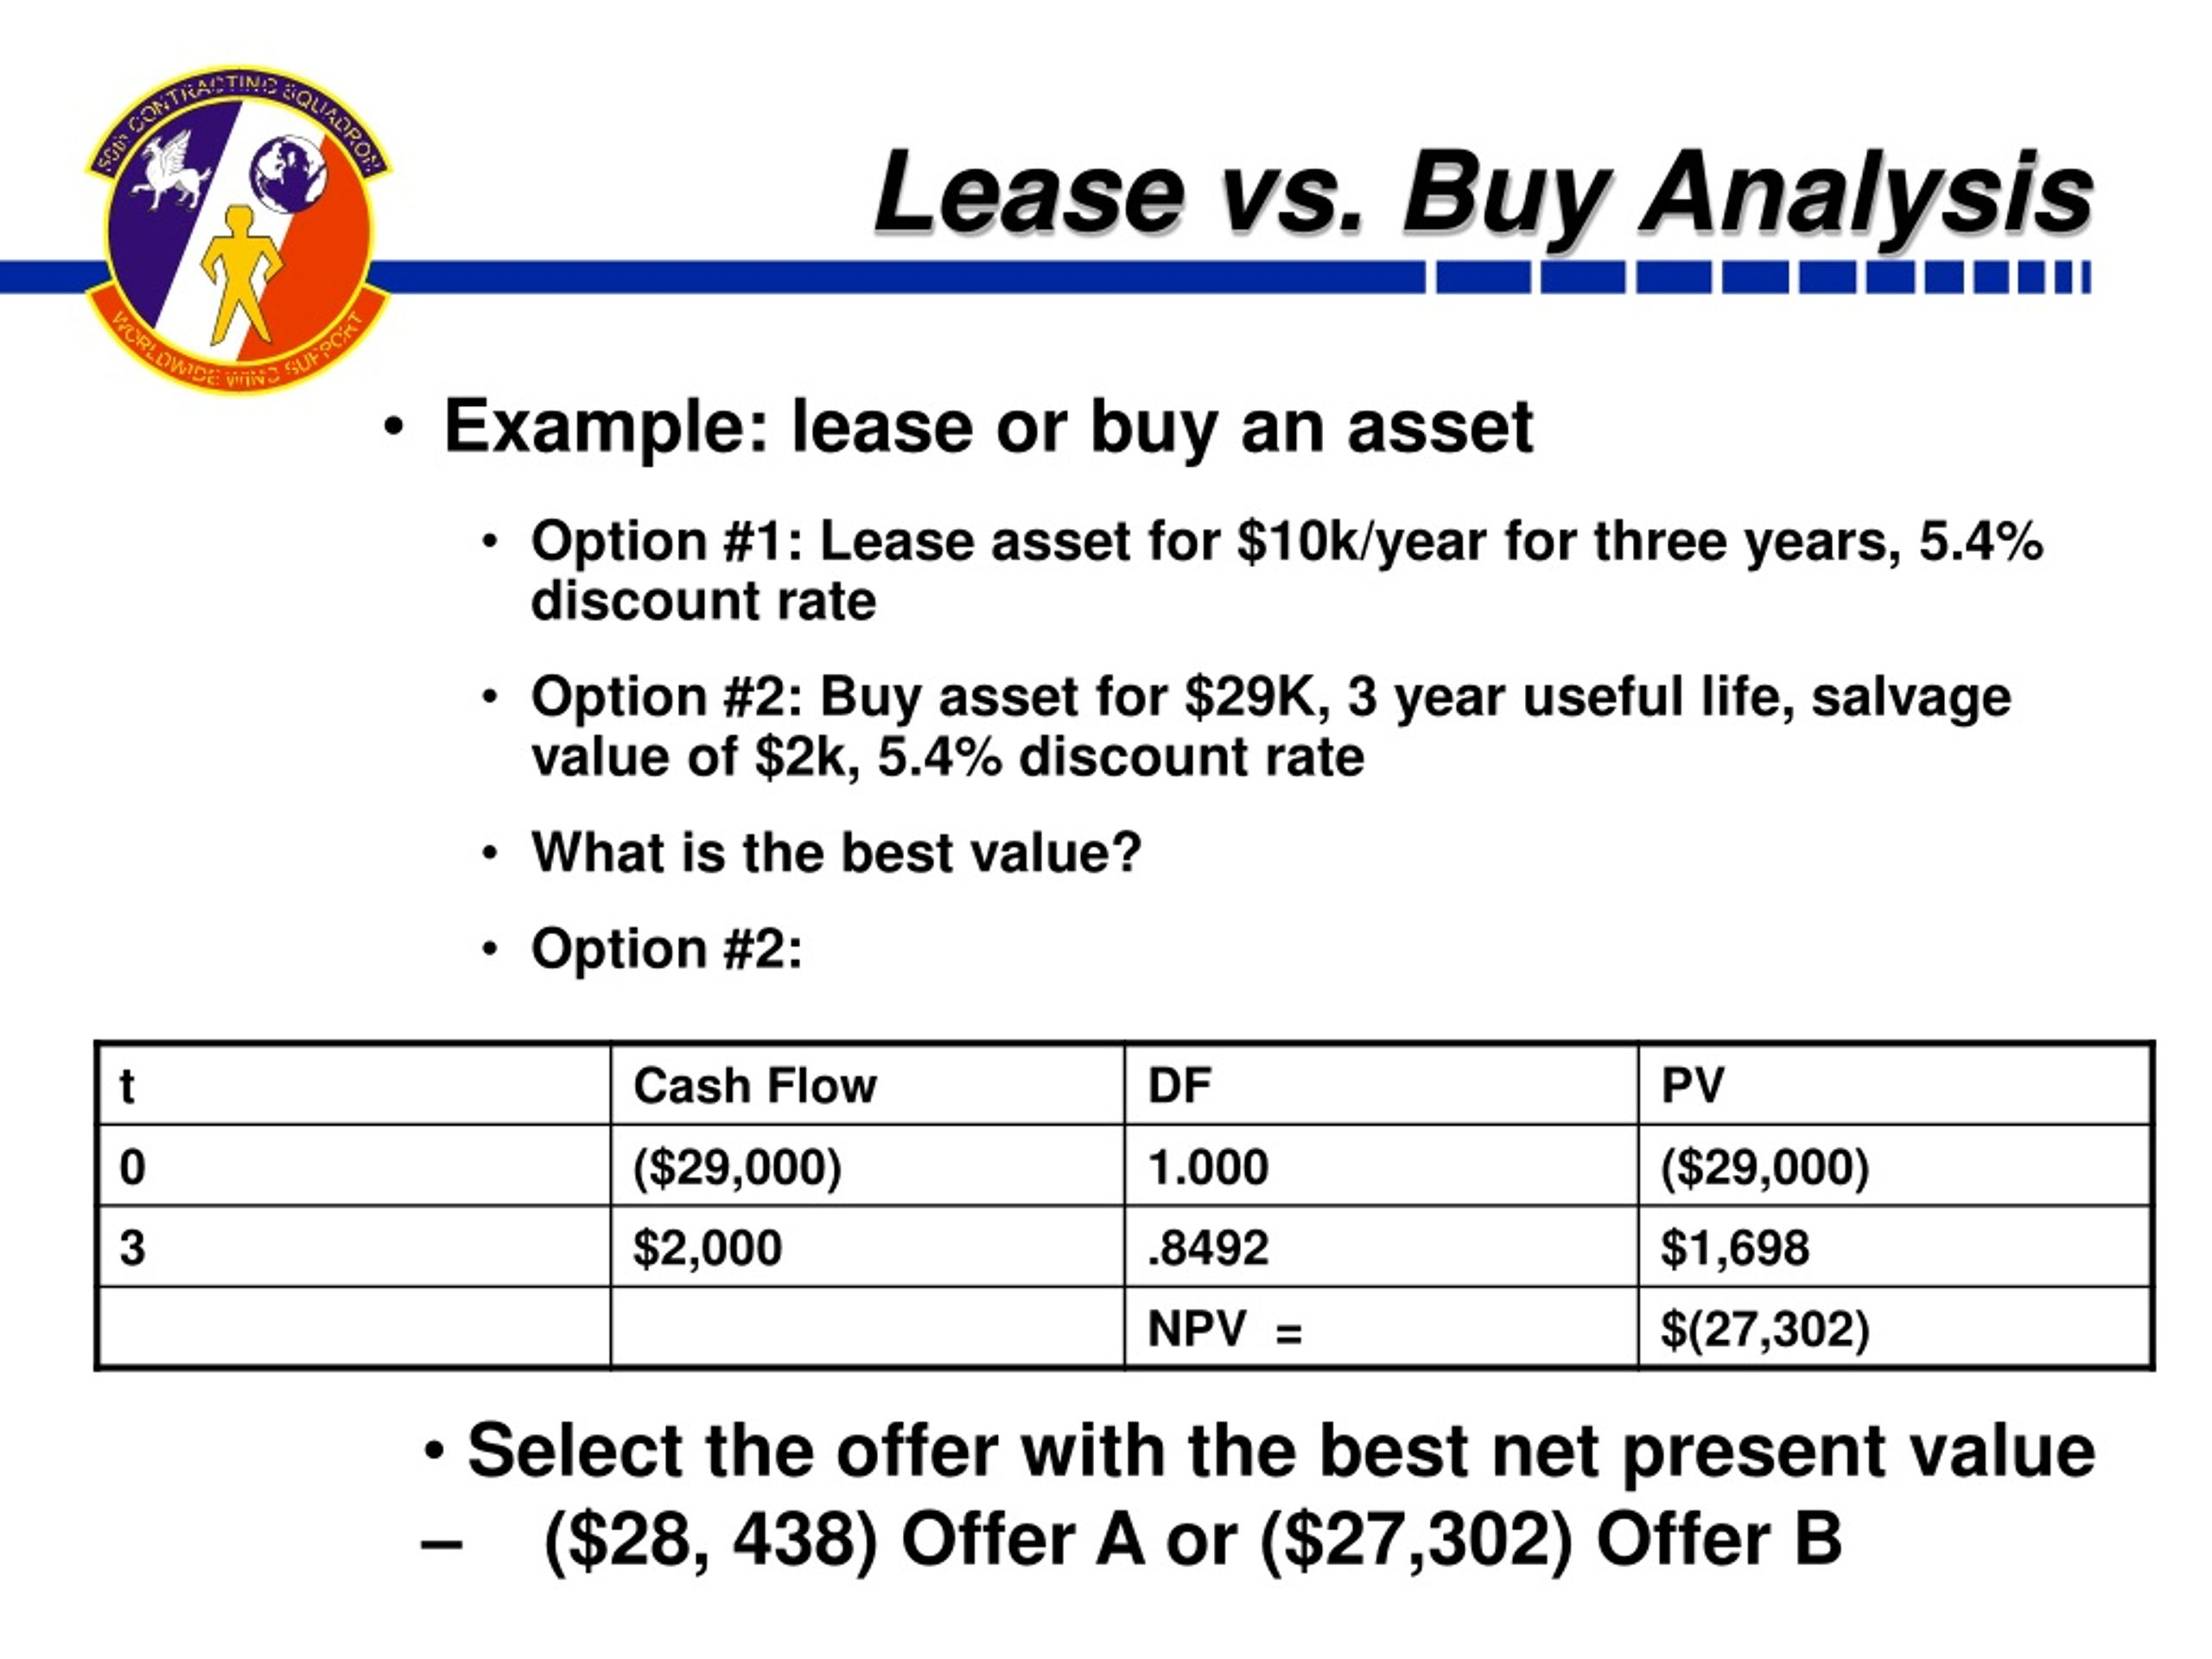
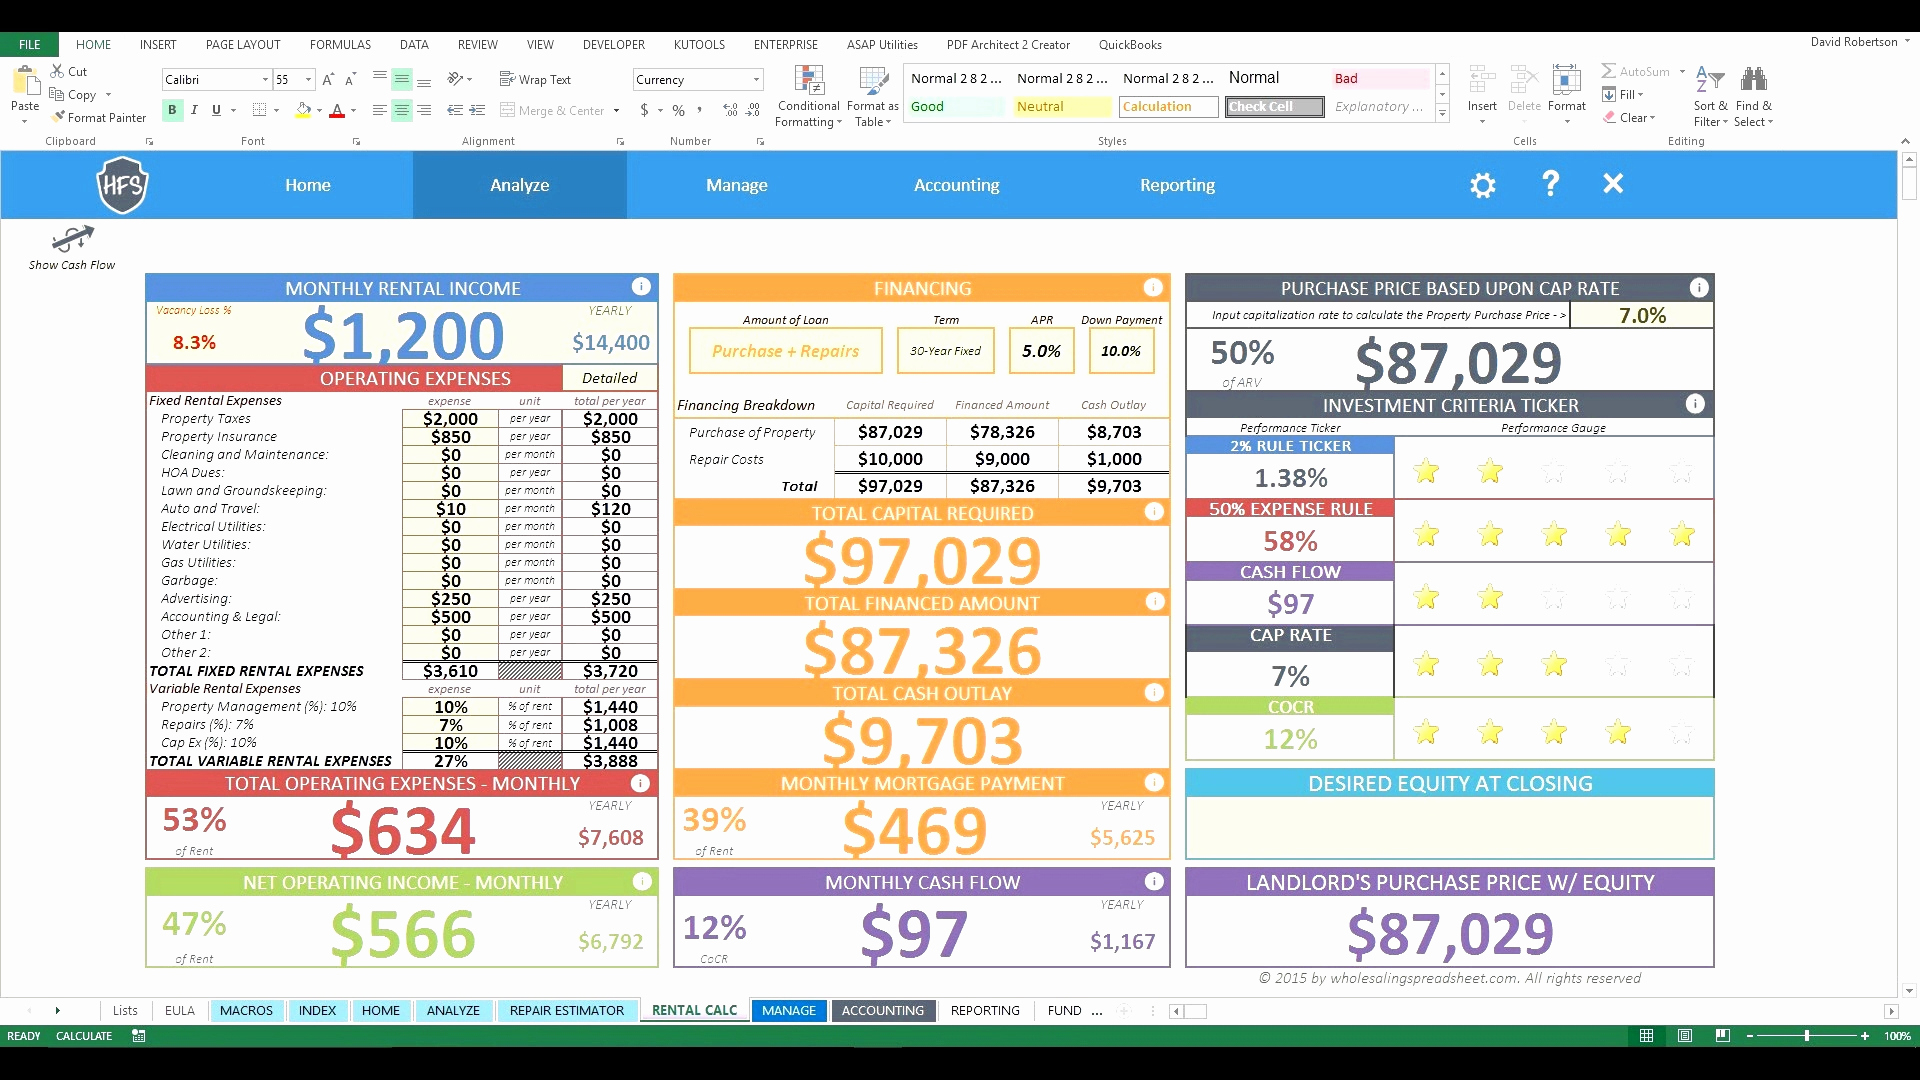
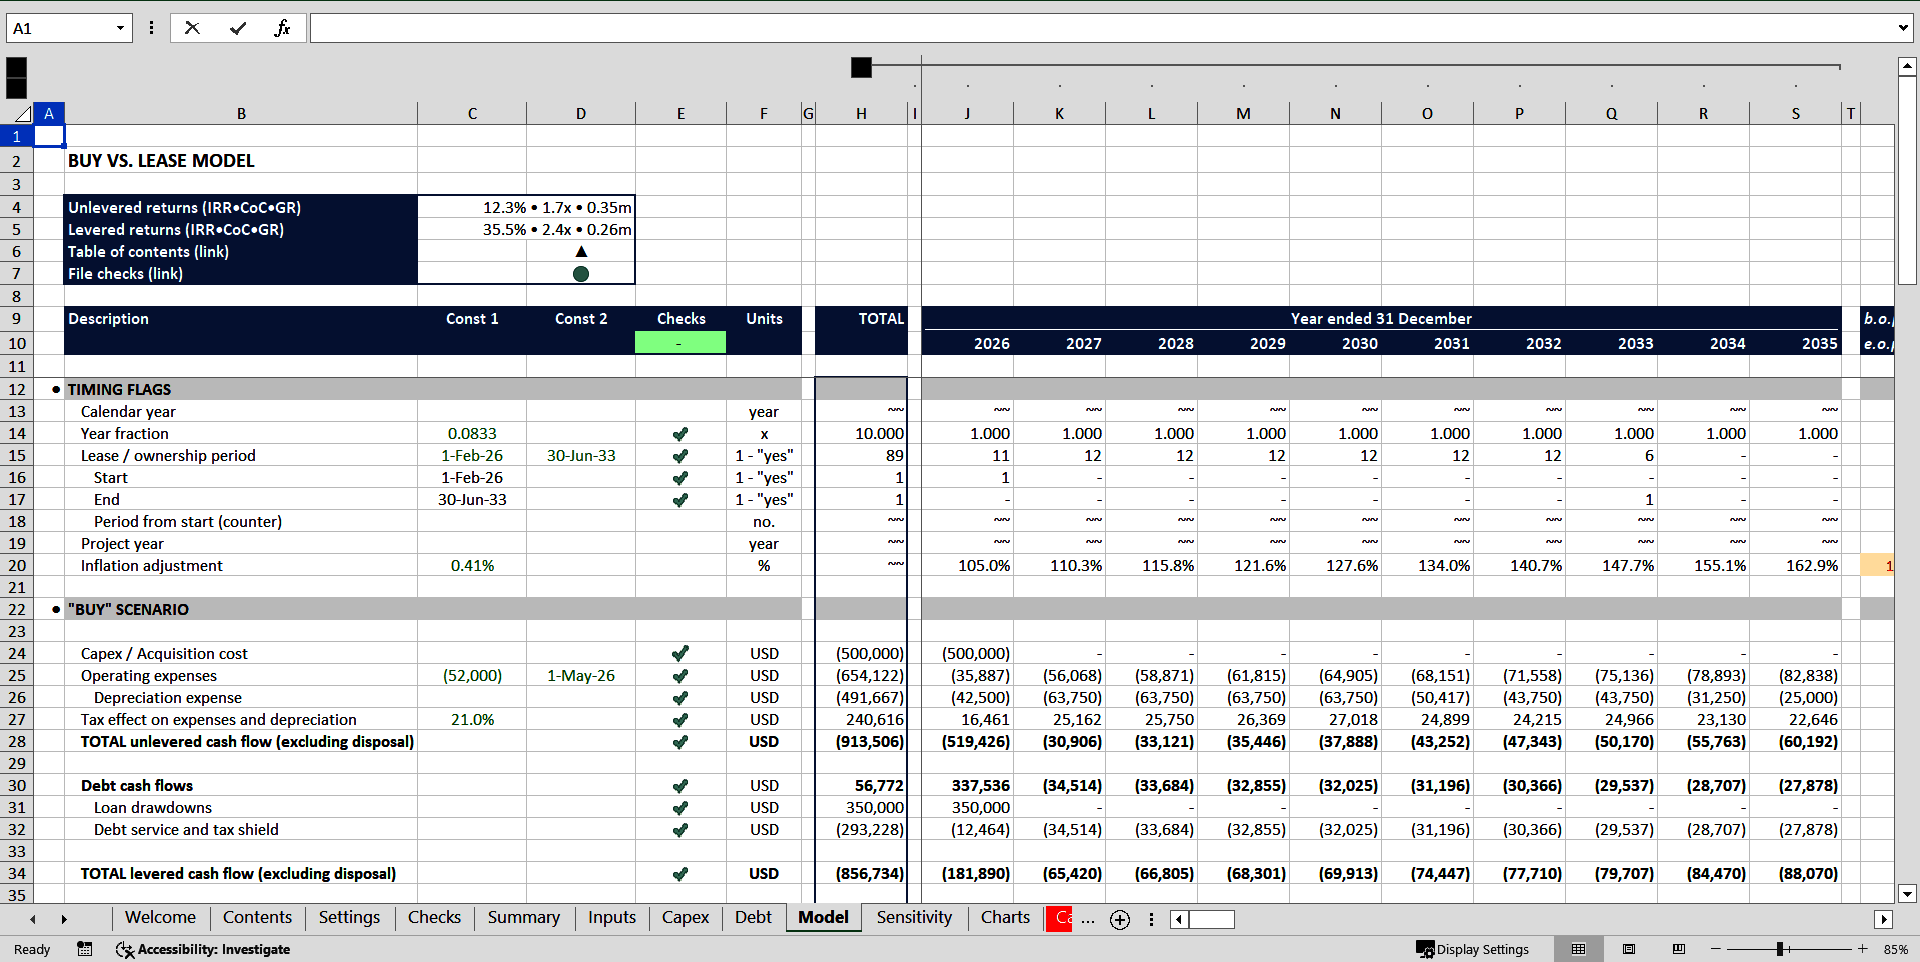
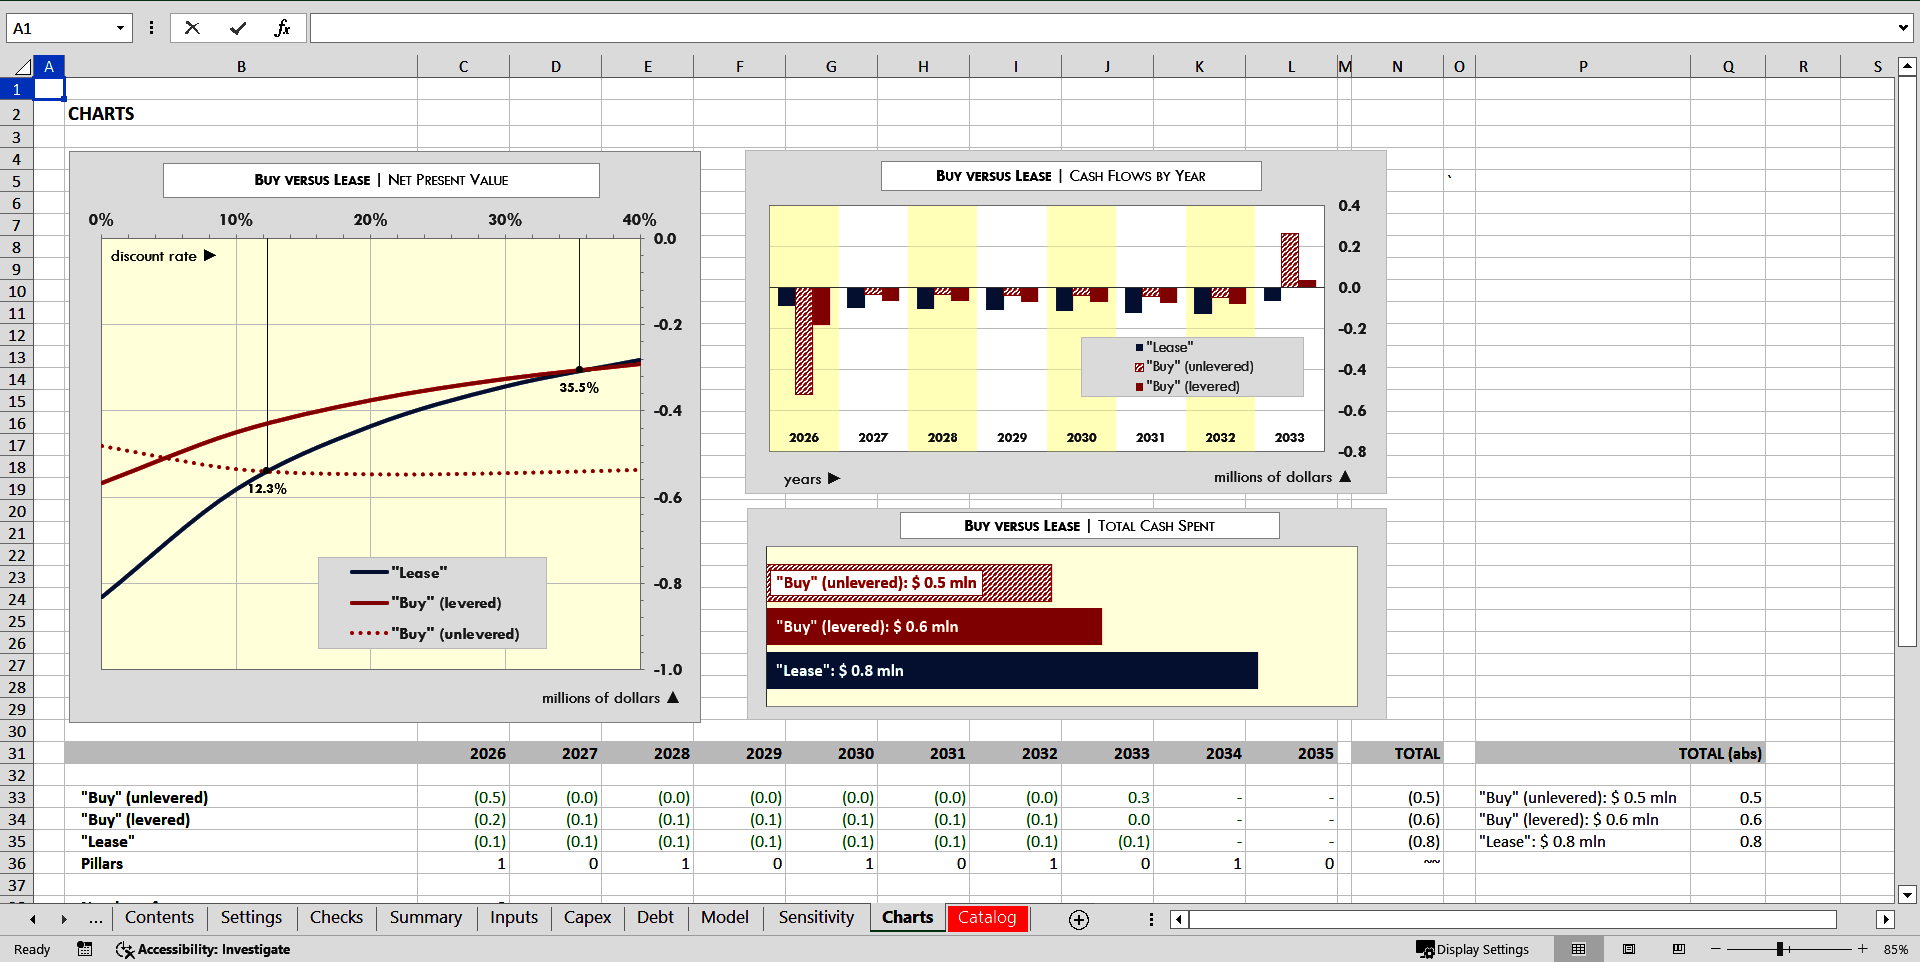
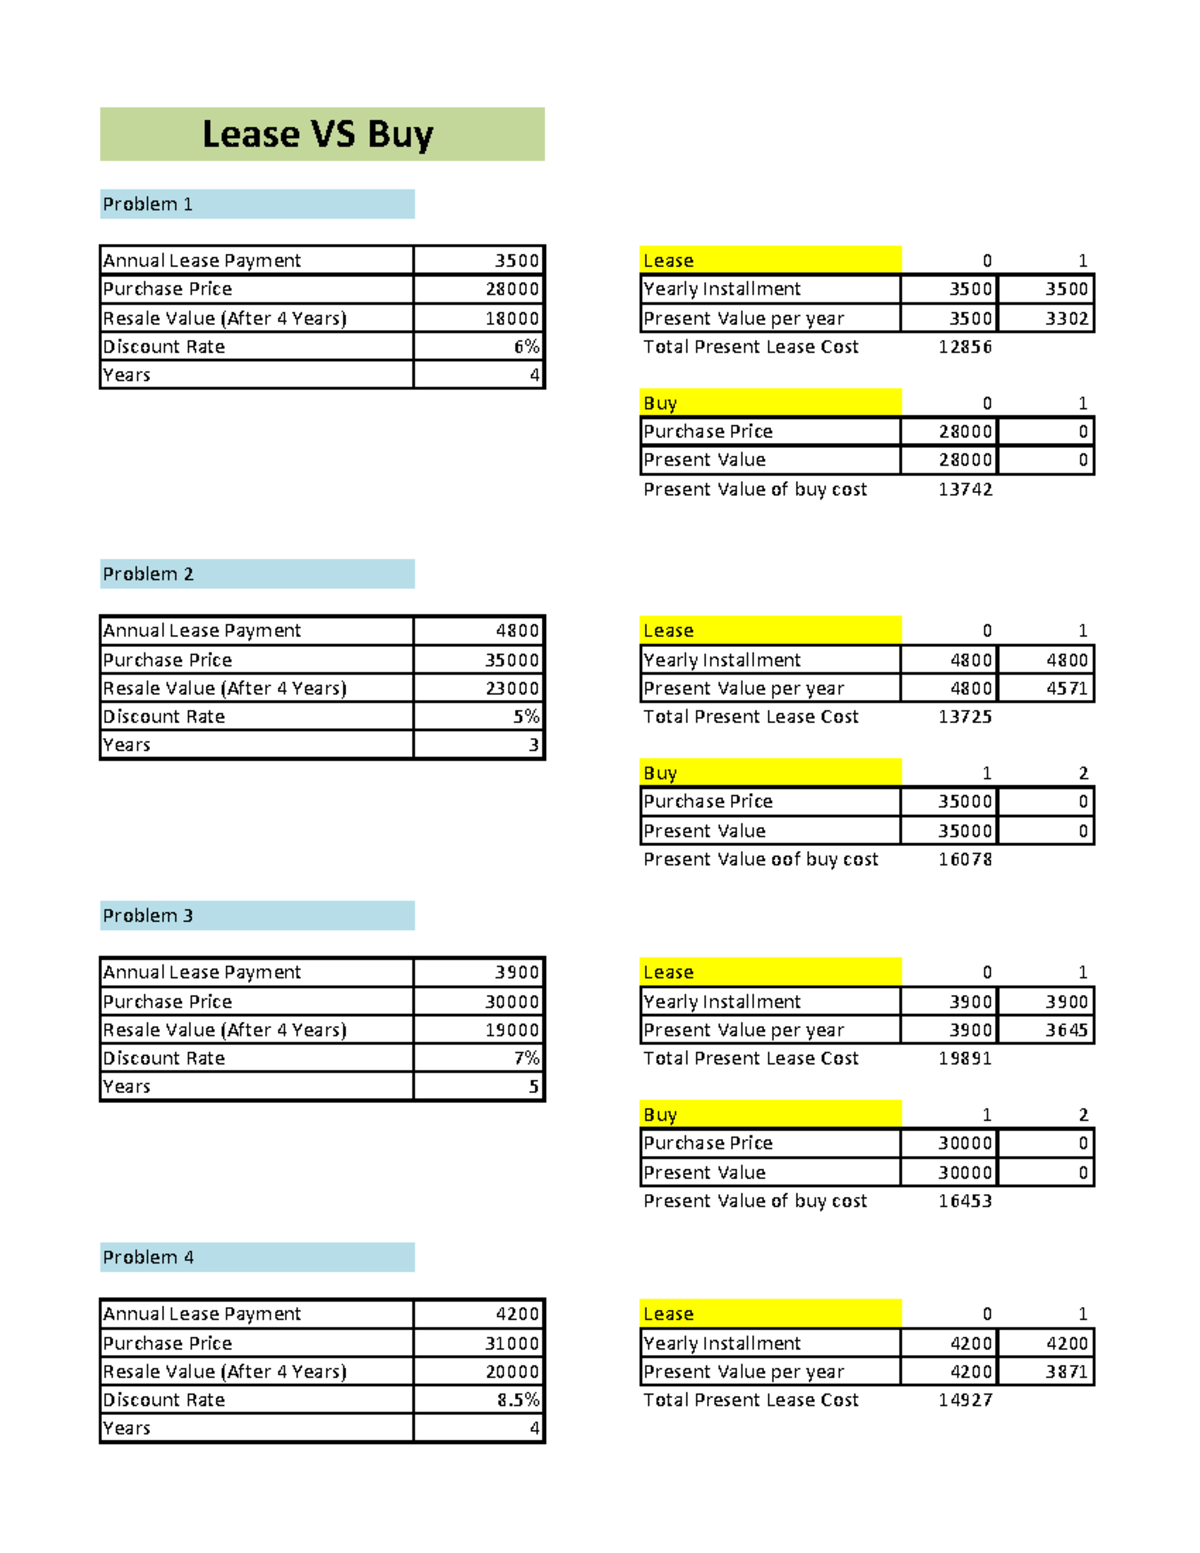
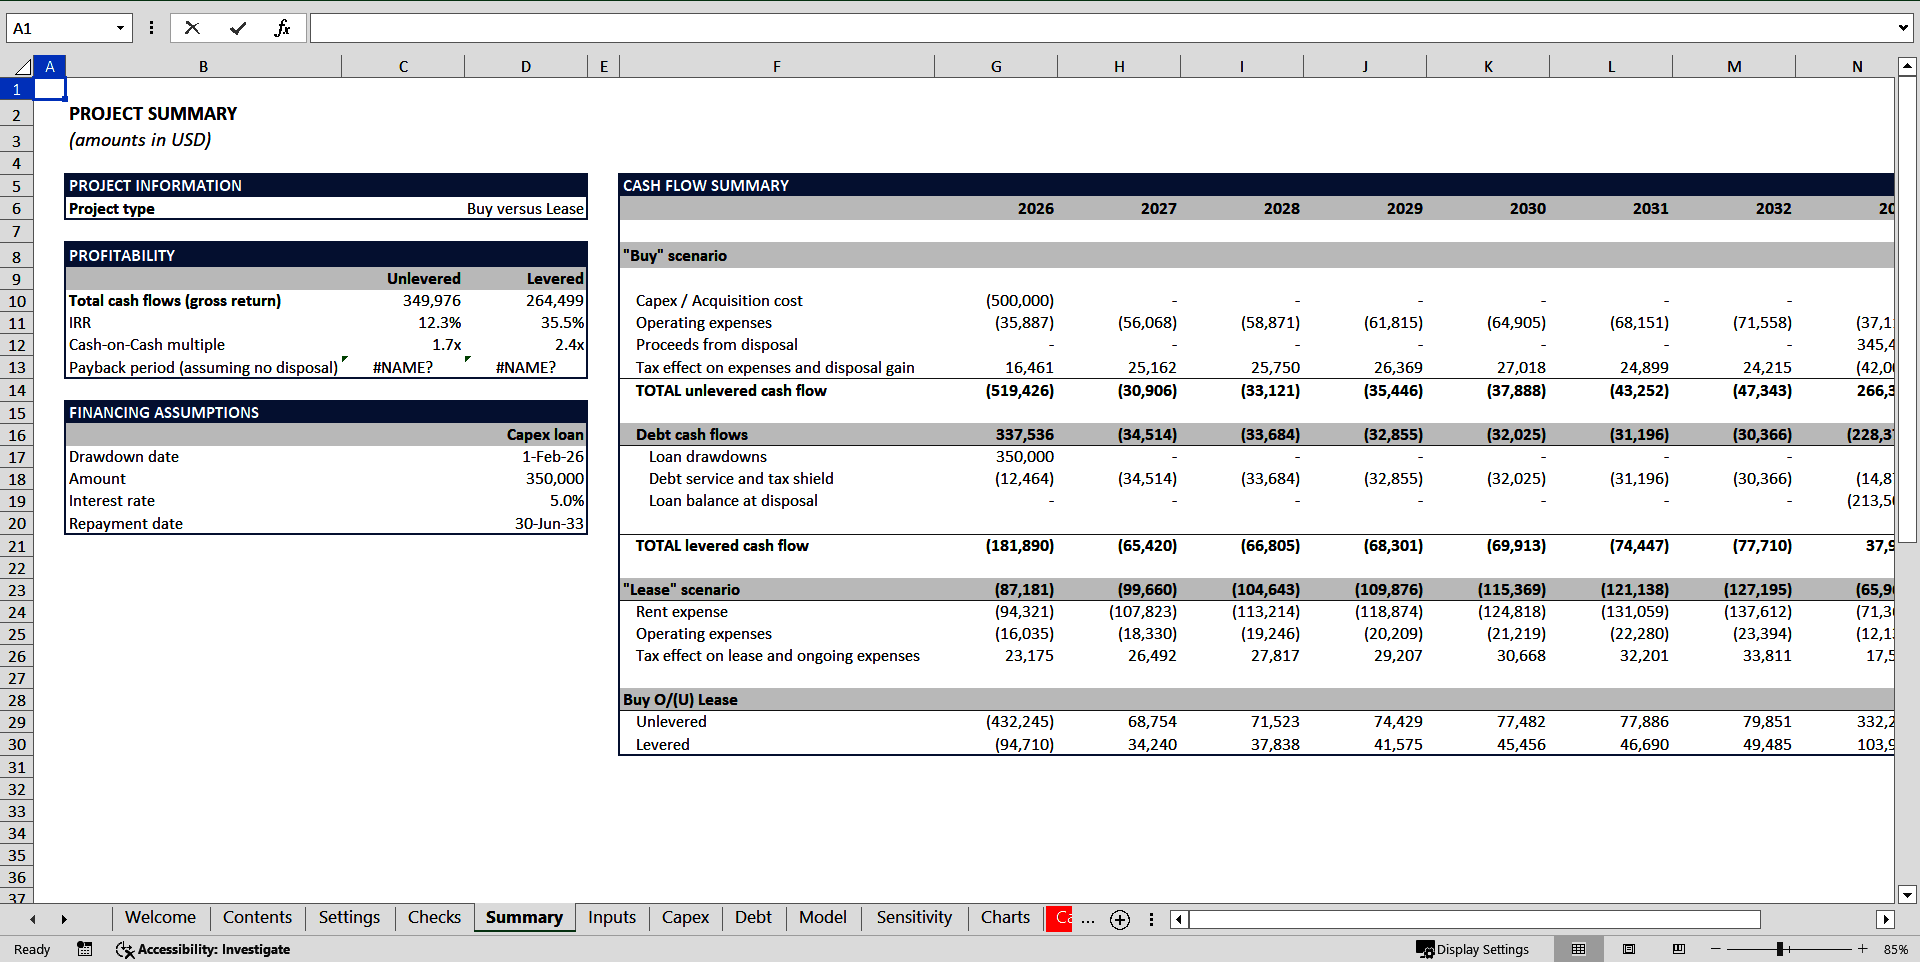
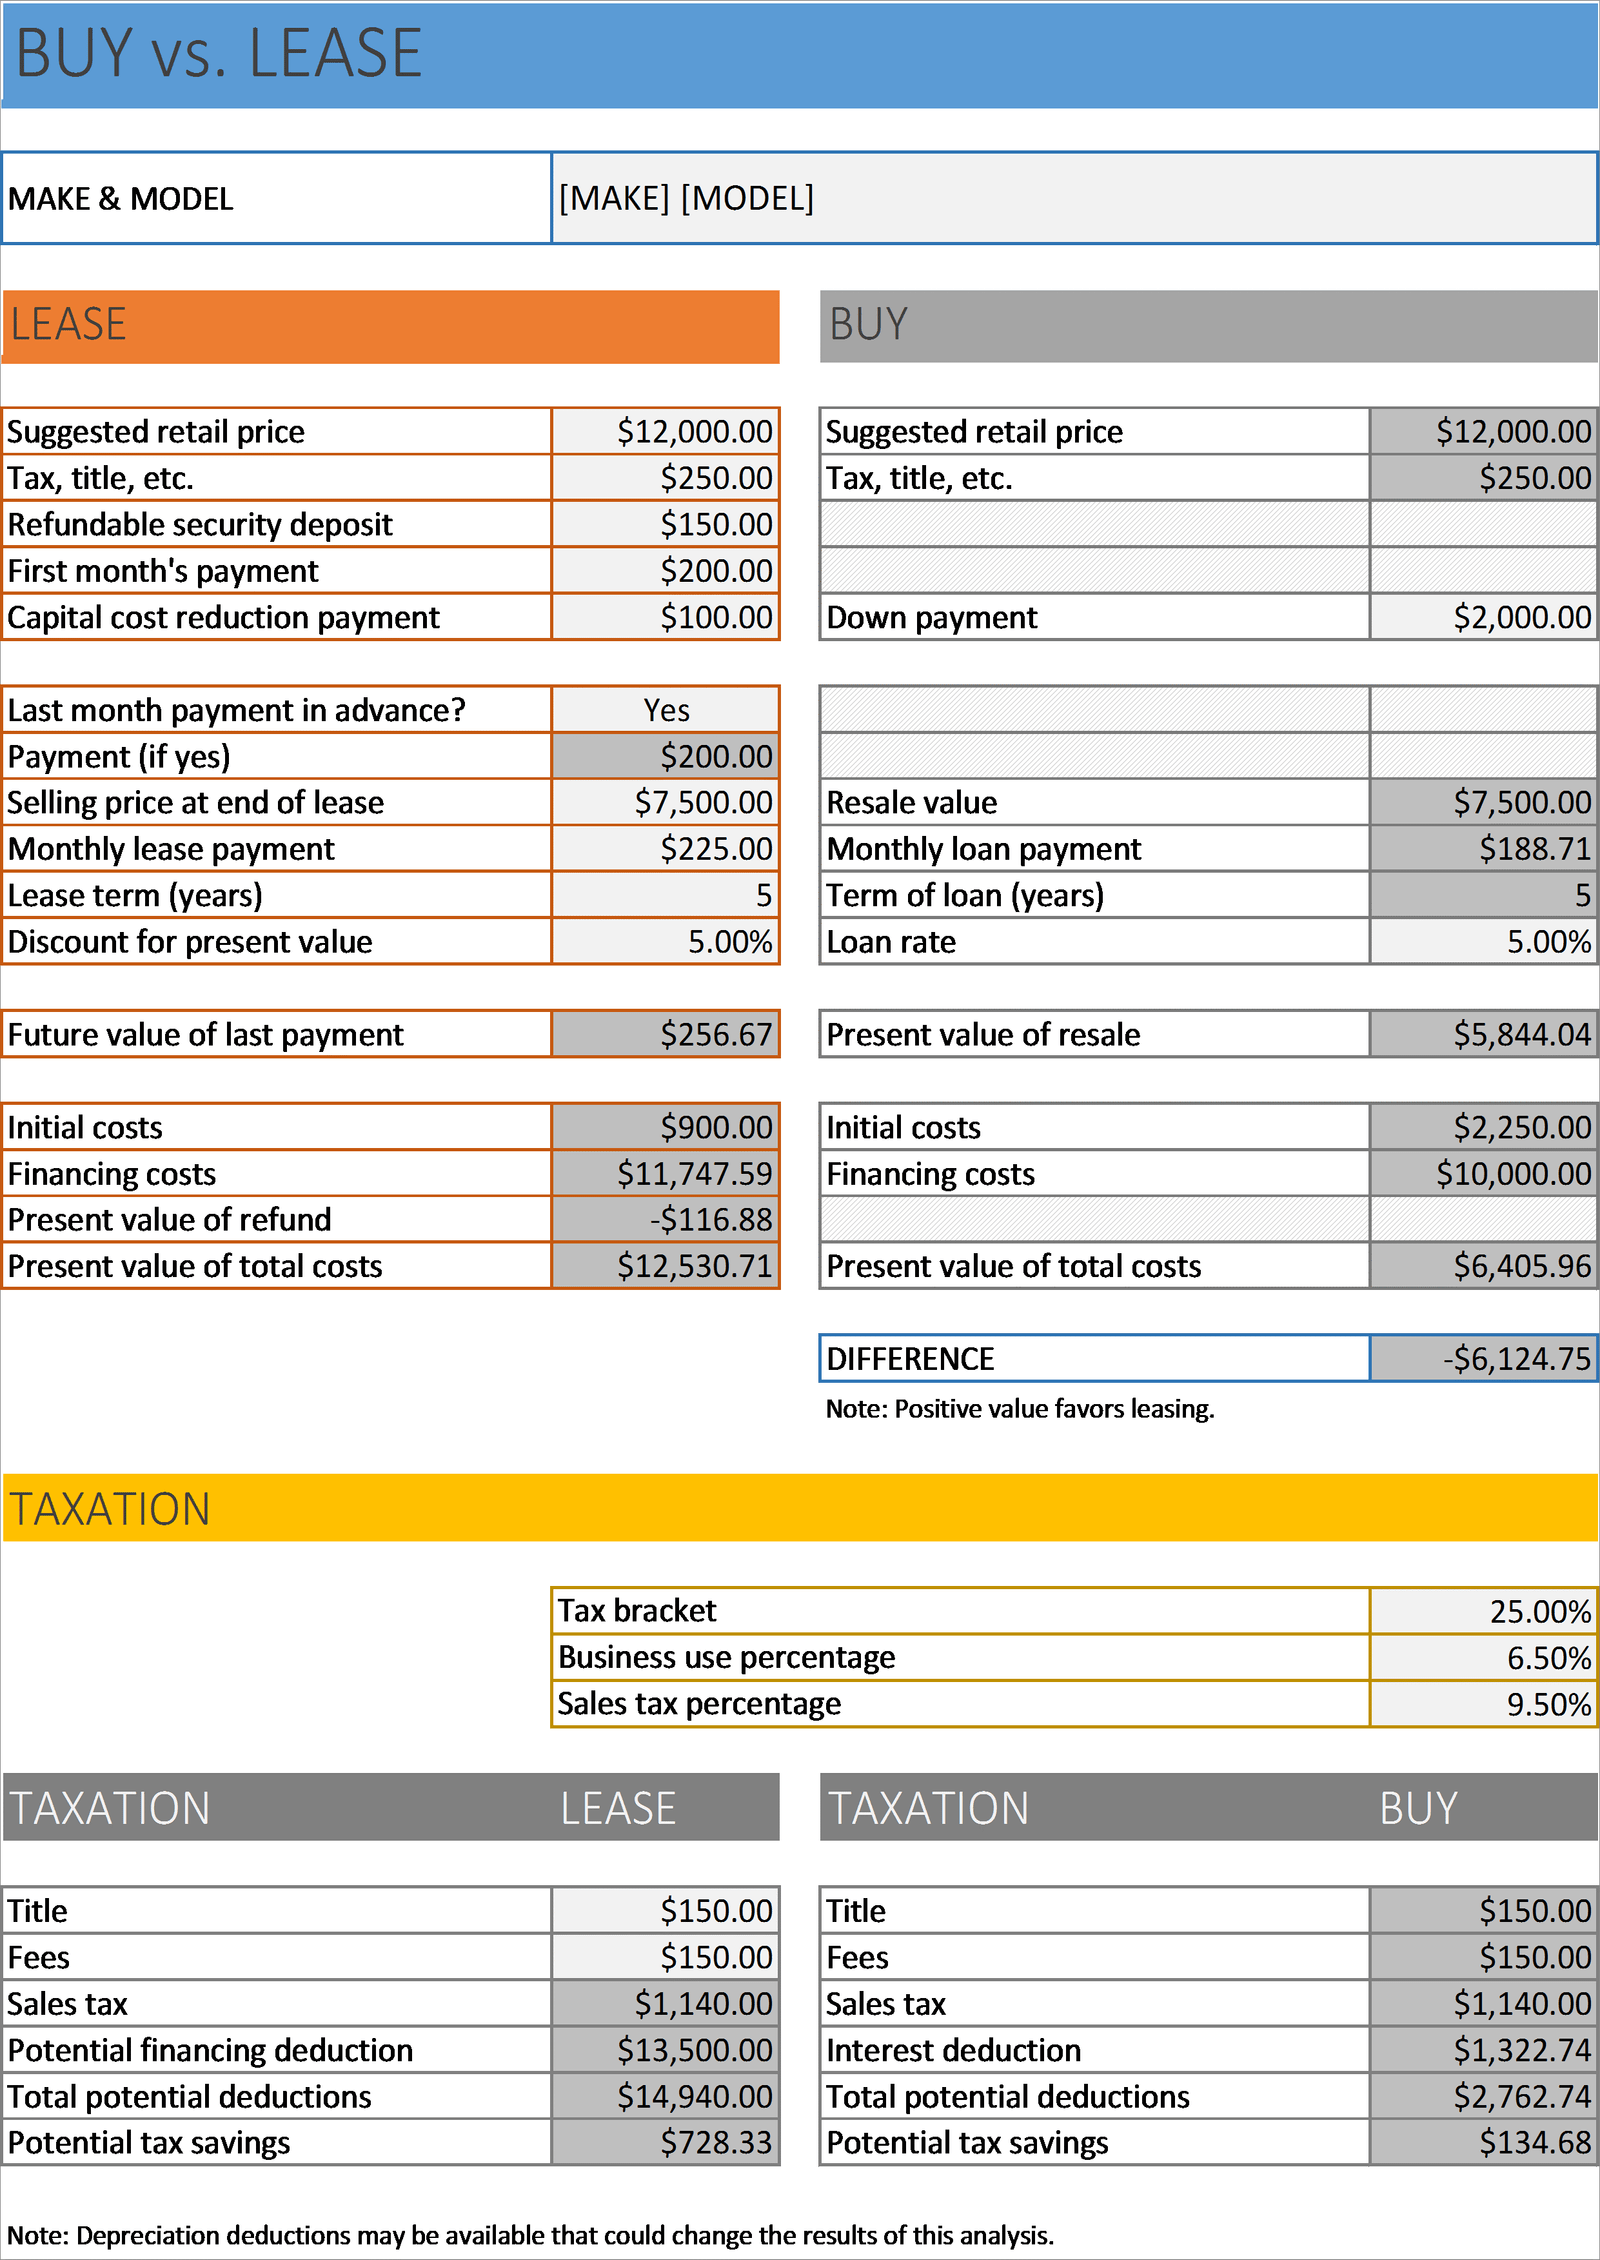
The template’s engine is built around three pillars: cost comparison, cash‑flow timing, and risk assessment. It pulls in the purchase price, leasing payments, residual values, tax treatments, and even opportunity costs. By running a side‑by‑side NPV (Net Present Value) calculation, it tells you which option gives you the biggest bang for your buck. It’s like having a financial calculator that also tells you a joke to lighten the mood.
Key Inputs That Drive the Model
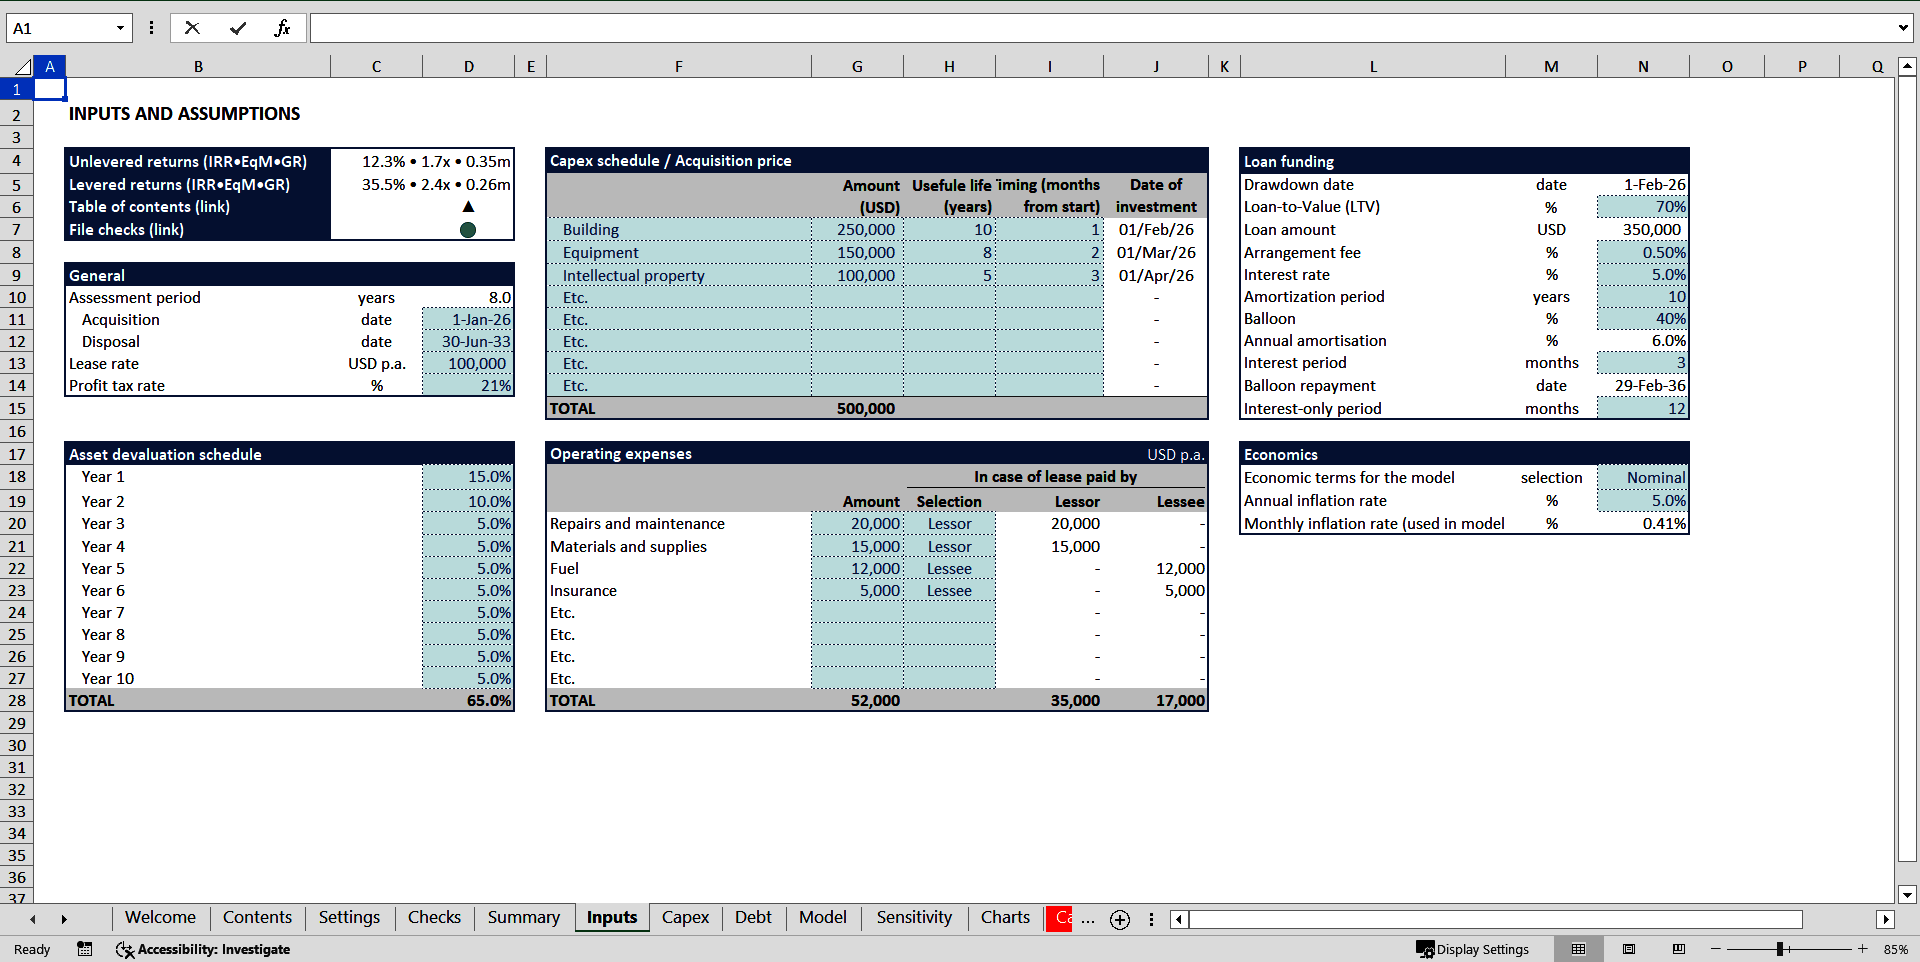
- Purchase Price: The sticker price, plus taxes, shipping, and installation.
- Lease Terms: Monthly or quarterly payments, lease duration, and any escalation clauses.
- Depreciation Schedule: Straight‑line, double‑declining balance, or whatever your accountant prefers.
- Tax Rate: The percentage of taxable income that the company pays.
- Discount Rate: The hurdle rate or the cost of capital.
- Residual Value: The expected worth of the asset at the end of the lease or ownership period.
- Maintenance & Insurance: Costs that are typically included in lease agreements but not in outright purchases.
Why NPV Is the King
The NPV calculation is the heart of the model. By discounting all future cash flows back to the present, it neutralizes the time value of money. This means that a payment today is considered worth more than a payment a year from now. The template automatically applies the discount rate, so you don’t need to manually calculate each year’s present value. The result is a clean comparison: the higher the NPV, the better the option. And if both options are close, the spreadsheet will point out the difference in less than 1% – which is precisely the difference that can decide a board meeting.
Step‑by‑Step: Building Your Own Lease Vs Buy Model
Step 1: Gather All Your Data
Start by collecting every relevant piece of data – even the ones that seem trivial. Shipping costs? Include them. Installation fees? Absolutely. Hidden taxes that pop up only when you ask the tax accountant? Don’t skip them. The more accurate your data, the more reliable the model’s output.
Step 2: Set Up the Input Sheet
Create a clean, labeled input sheet. Use cell references instead of hard‑coded numbers wherever possible. This makes the model dynamic; change a single cell, and the entire analysis updates. Label your inputs clearly: “Purchase Price”, “Lease Monthly Payment”, “Lease Duration”, etc. Add data validation dropdowns for categories like “Tax Rate” or “Discount Rate” to reduce input errors.
Step 3: Build the Cash‑Flow Timeline
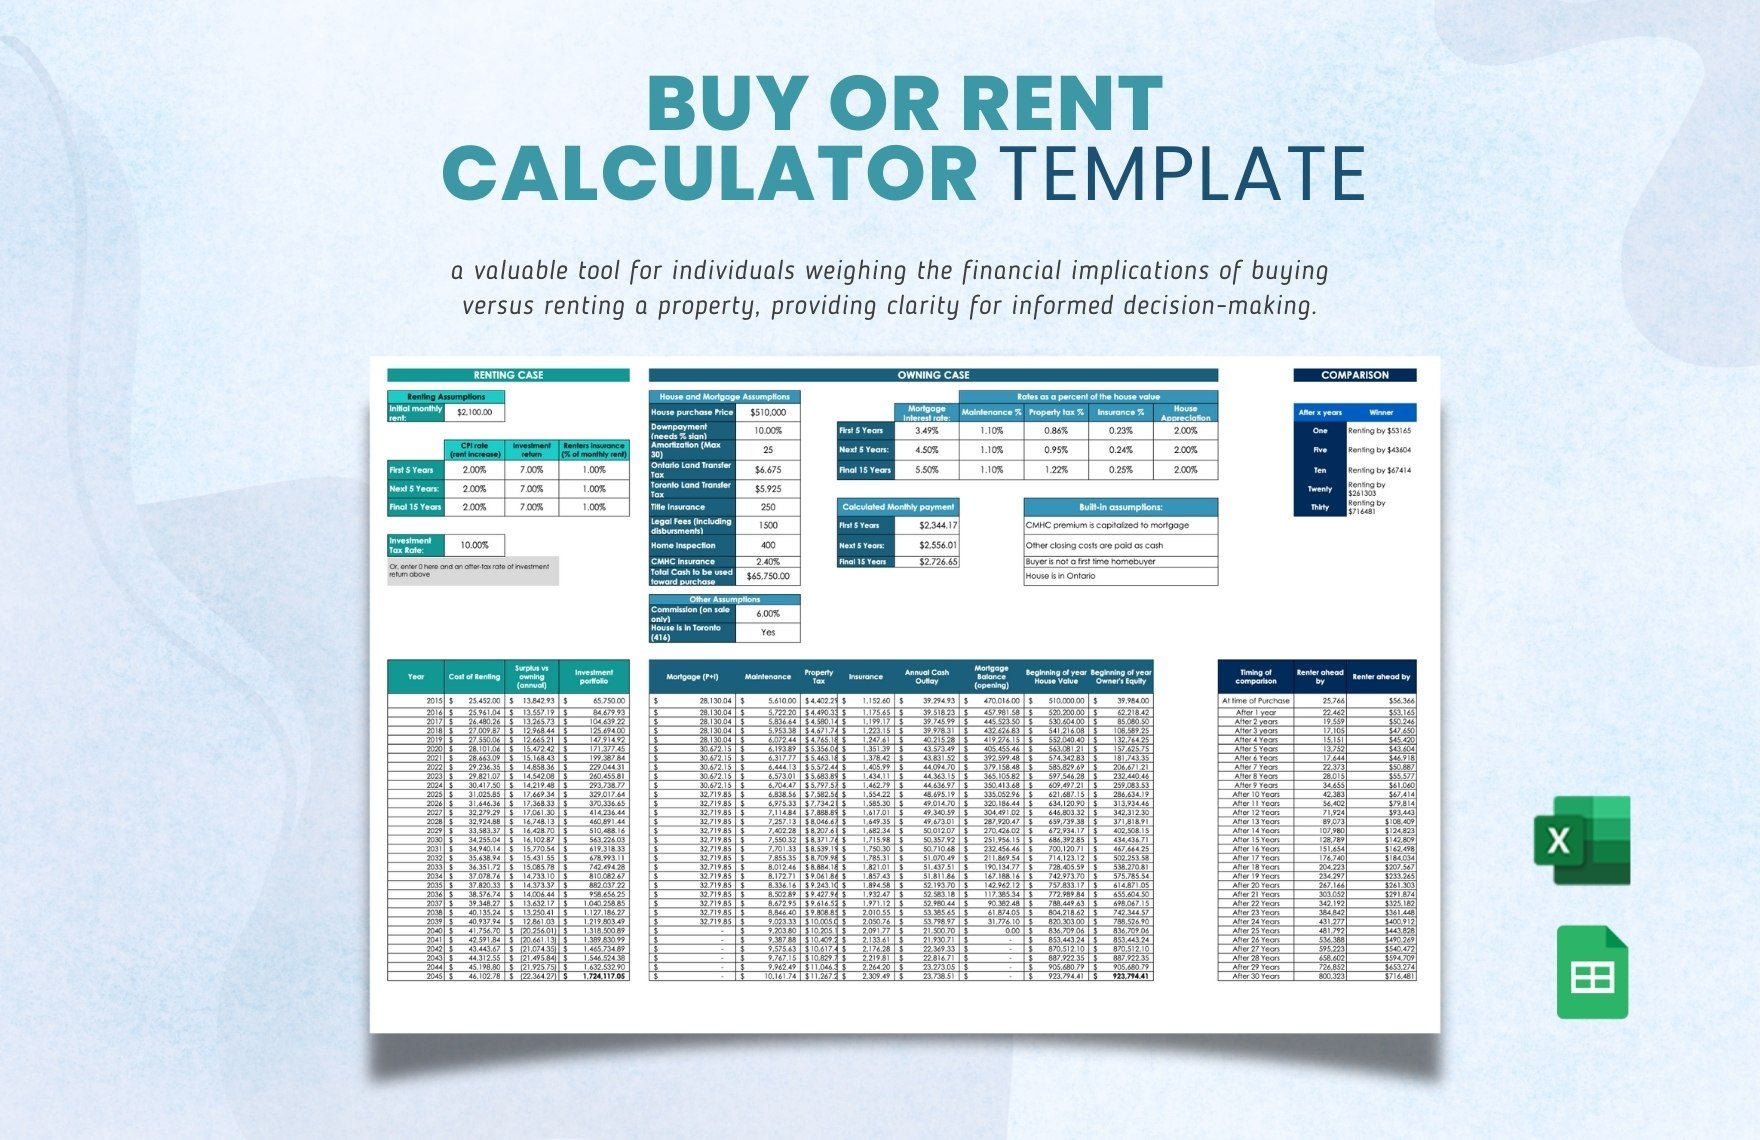
Construct a year‑by‑year table. For the buy option, list the initial purchase outlay, annual depreciation expense, annual tax shield, and any salvage value at the end. For the lease option, list the lease payments, any residual lease value, and tax shield from lease expenses. Use the same date format for both columns so the comparison stays straight‑forward.
Step 4: Apply the NPV Formula
Use Excel’s NPV function for each column of cash flows. Make sure you include the initial outlay as a negative number outside the NPV function, since it occurs at time zero. For example: NPV(discount_rate, cash_flow_1, cash_flow_2, …) + initial_outlay. The template will handle this automatically, but knowing how it works gives you confidence when troubleshooting.
Step 5: Interpret the Results
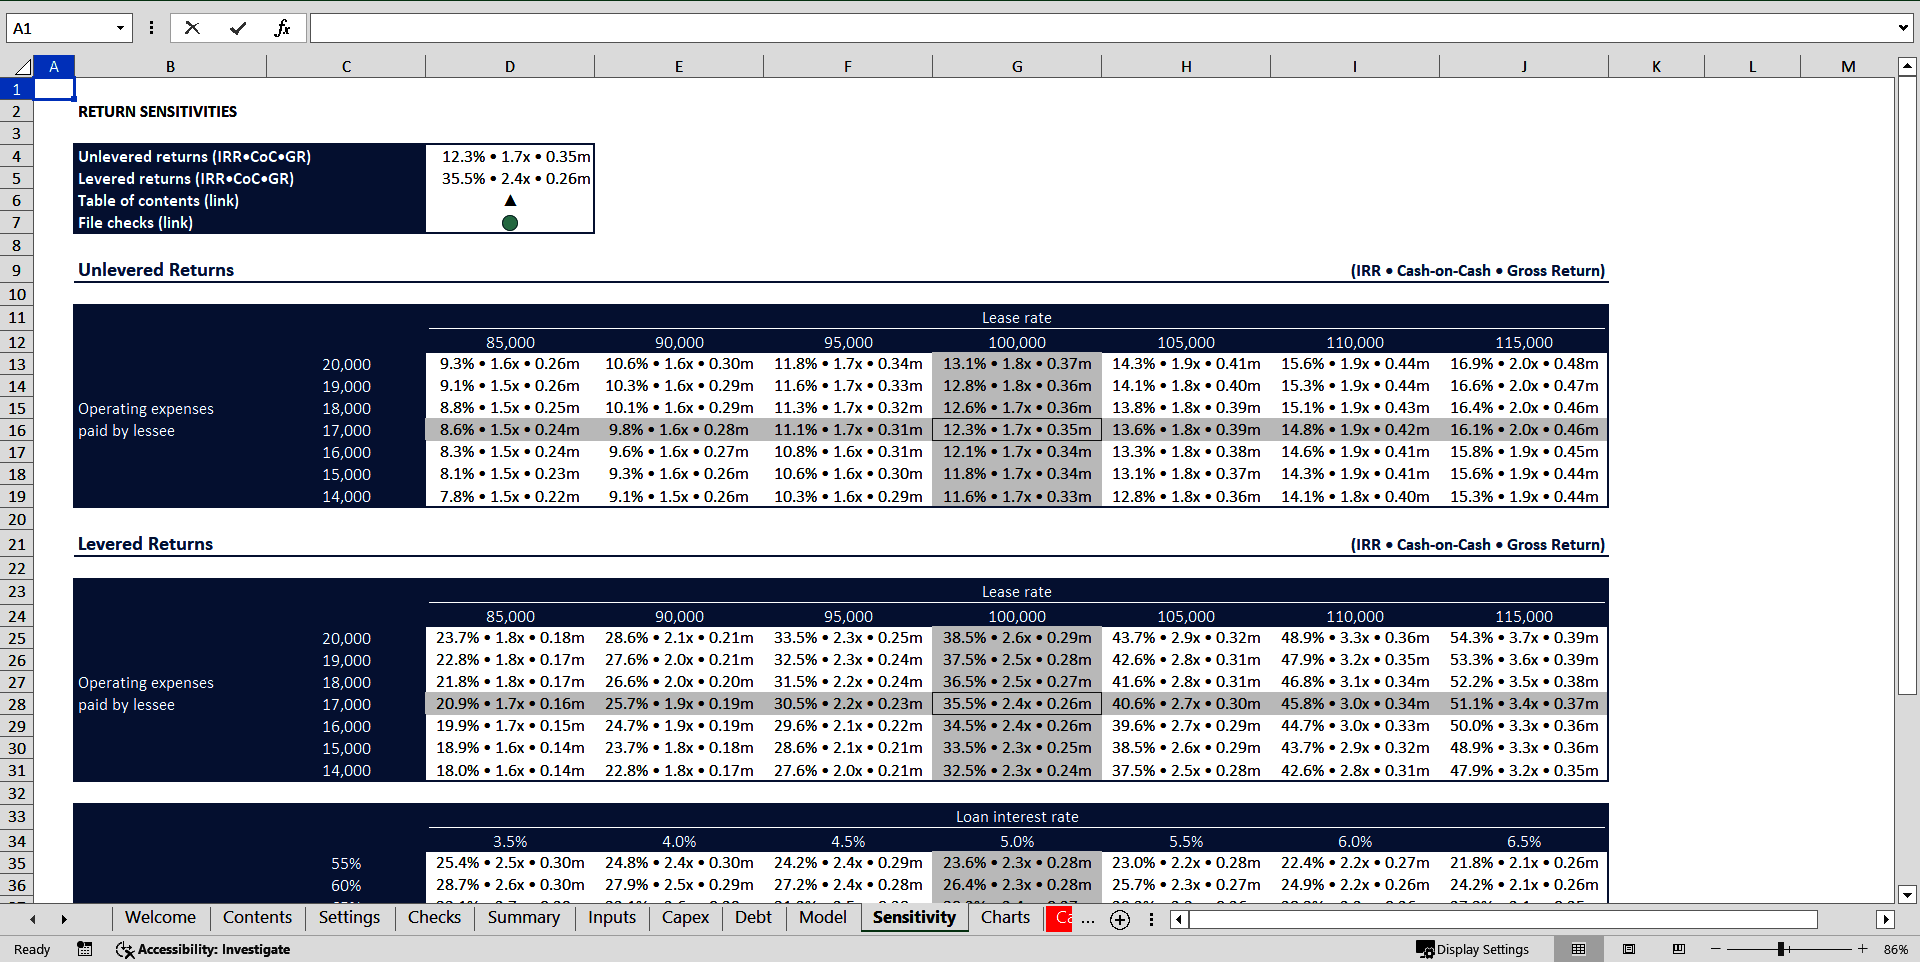
When you look at the final NPV values, the higher one is the preferred option. But don’t stop there. Check the sensitivity: How does a 1% change in the discount rate affect the outcome? What if the lease escalates by 3% annually? The template often includes a sensitivity table or can be easily extended to do so. This is your “what‑if” analysis – the safety net that prevents you from making a decision that looks great on paper but crumbles under real-world uncertainty.
Real‑World Scenarios: From a Startup to a Fortune 500
Startup Scenario: The $10,000 Laptop
A fledgling tech startup needs a high‑end laptop for its lead developer. The market price is $1,200. They can purchase it outright or lease it for $100/month over 2 years. The startup’s cost of capital is 20% (because they’re a risk‑tolerant venture), and they have a 25% tax rate. Plugging numbers into the template, the buy NPV is –$1,200 (negative because it’s an upfront cost with no recurring tax shield), while the lease NPV is –$1,800 (negative because of higher cumulative payments). Even though the lease has a tax shield, the high cost of capital swamps the benefit. Result: buy. The startup saves $600 in cash‑flow and keeps the laptop for future years, potentially avoiding future leasing costs.
Mid‑Sized Firm Scenario: Industrial Machinery
A manufacturing firm needs a CNC machine costing $150,000. Leasing offers $5,000/month over 5 years, with a residual value of $30,000. The firm’s discount rate is 12%, tax rate 30%. The template calculates a buy NPV of $25,000 (positive) and a lease NPV of $30,000. The lease looks better because of the tax shield on lease payments and the fact that the firm avoids the large upfront outlay. But the firm also has to consider the machine’s maintenance – if the lease includes maintenance, the model already accounts for that; otherwise, the buy option might have hidden costs that tilt the scale back toward leasing.
Fortune 500 Scenario: Corporate Headquarters Renovation
A large corporation wants to renovate its headquarters, costing $10 million in new HVAC and lighting systems. Leasing offers a $500,000 annual payment over 10 years, with a $2 million residual value. The corporation’s discount rate is 8% and tax rate is 35%. The buy NPV is $3.5 million, while the lease NPV is $4.2 million. The lease is slightly better because of the larger tax shield and because the corporation can reallocate the initial $10 million to other growth projects. The template’s ability to capture intangible benefits, such as brand value from greener energy systems, adds depth to the analysis beyond mere numbers.
Beyond the Numbers: Qualitative Factors That Matter
Asset Flexibility
Leasing can offer flexibility to upgrade technology or relocate assets. If the industry changes fast, the company might prefer leasing to avoid obsolescence. The template can model a “flexibility premium” by adding a small positive adjustment to the lease NPV.
Brand and Image
Owning certain high‑profile equipment can be a status symbol. For instance, a media company owning cutting‑edge cameras might prefer ownership to signal technological leadership. This qualitative factor can be captured in a decision matrix alongside the NPV results.
Tax Strategy and Cash‑Flow Management
Tax laws differ by jurisdiction. In some cases, lease payments can be fully deducted immediately, while purchase depreciation is spread out. The template’s tax shield calculation can be tweaked to reflect these nuances. Additionally, leasing often keeps cash flow smoother, which can be critical for companies with tight working capital.
Operational Control
When you own an asset, you control maintenance, upgrades, and usage. Leasing often comes with service packages, but you may have less control over scheduling. The template can incorporate a “control cost” or benefit by adjusting the NPV accordingly.
Common Pitfalls and How to Avoid Them

Ignoring Opportunity Cost
Companies sometimes forget that the money tied up in an asset purchase could be invested elsewhere. The template automatically considers the discount rate, but you must ensure it reflects your real cost of capital or an alternative investment return.
Misapplying Tax Rates
Tax rates can vary across regions, and tax shields depend on the type of expense. Double‑check whether lease payments are fully deductible in the year they’re paid or if they’re spread out. Adjust the template’s tax shield calculation accordingly.
Overlooking Residual Value
Residual values are often underestimated, especially for assets that hold value due to brand or technology. An optimistic residual value can make leasing look better than it really is. The template allows you to enter a realistic residual value, and you can run a sensitivity analysis to see how it changes the outcome.
Failing to Account for Maintenance
Lease agreements often include maintenance and insurance, while purchases require the company to shoulder these costs. If you ignore maintenance in the buy option, the NPV will be skewed. Add a maintenance cost line for the buy scenario, and the template’s NPV will balance out.
Relying Solely on NPV
While NPV is a powerful metric, it doesn’t capture everything. Some companies use internal rate of return (IRR), payback period, or even qualitative scoring. Use the template as a starting point, then layer additional metrics as needed.
Wrapping It Up: When the Excel Sheet Saves the Day

The Lease Vs Buy Analysis Corporate Finance Excel Template isn’t just a spreadsheet; it’s a decision‑making compass that points you toward the most financially sound choice. By automating the grunt work of cost comparison, NPV calculation, and sensitivity analysis, it frees up CFOs and finance teams to focus on strategy rather than spreadsheet gymnastics. And let’s be honest – who doesn’t love a spreadsheet that can also give you a quick joke or two while you crunch numbers?
In the end, whether you end up with a shiny new asset on your balance sheet or a neat line of lease payments on your income statement, the real win is that you’re making an informed, data‑driven decision. So next time a CEO asks whether to buy or lease, pull out the template, run the numbers, and let the spreadsheet do the heavy lifting. Your stakeholders will thank you, and you’ll have more time to enjoy a well‑deserved coffee break. After all, the best financial decisions are the ones that let you stay caffeinated and confident.





Related posts of "Lease Vs Buy Analysis Corporate Finance Excel Template"
