
Example Cost Benefit Analysis Template is a powerful tool that helps businesses and individuals in Asia make informed decisions by weighing potential gains against the associated costs, all while respecting the region’s values of harmony, foresight, and collective benefit.
Why a Cost Benefit Analysis Matters in Asian Markets
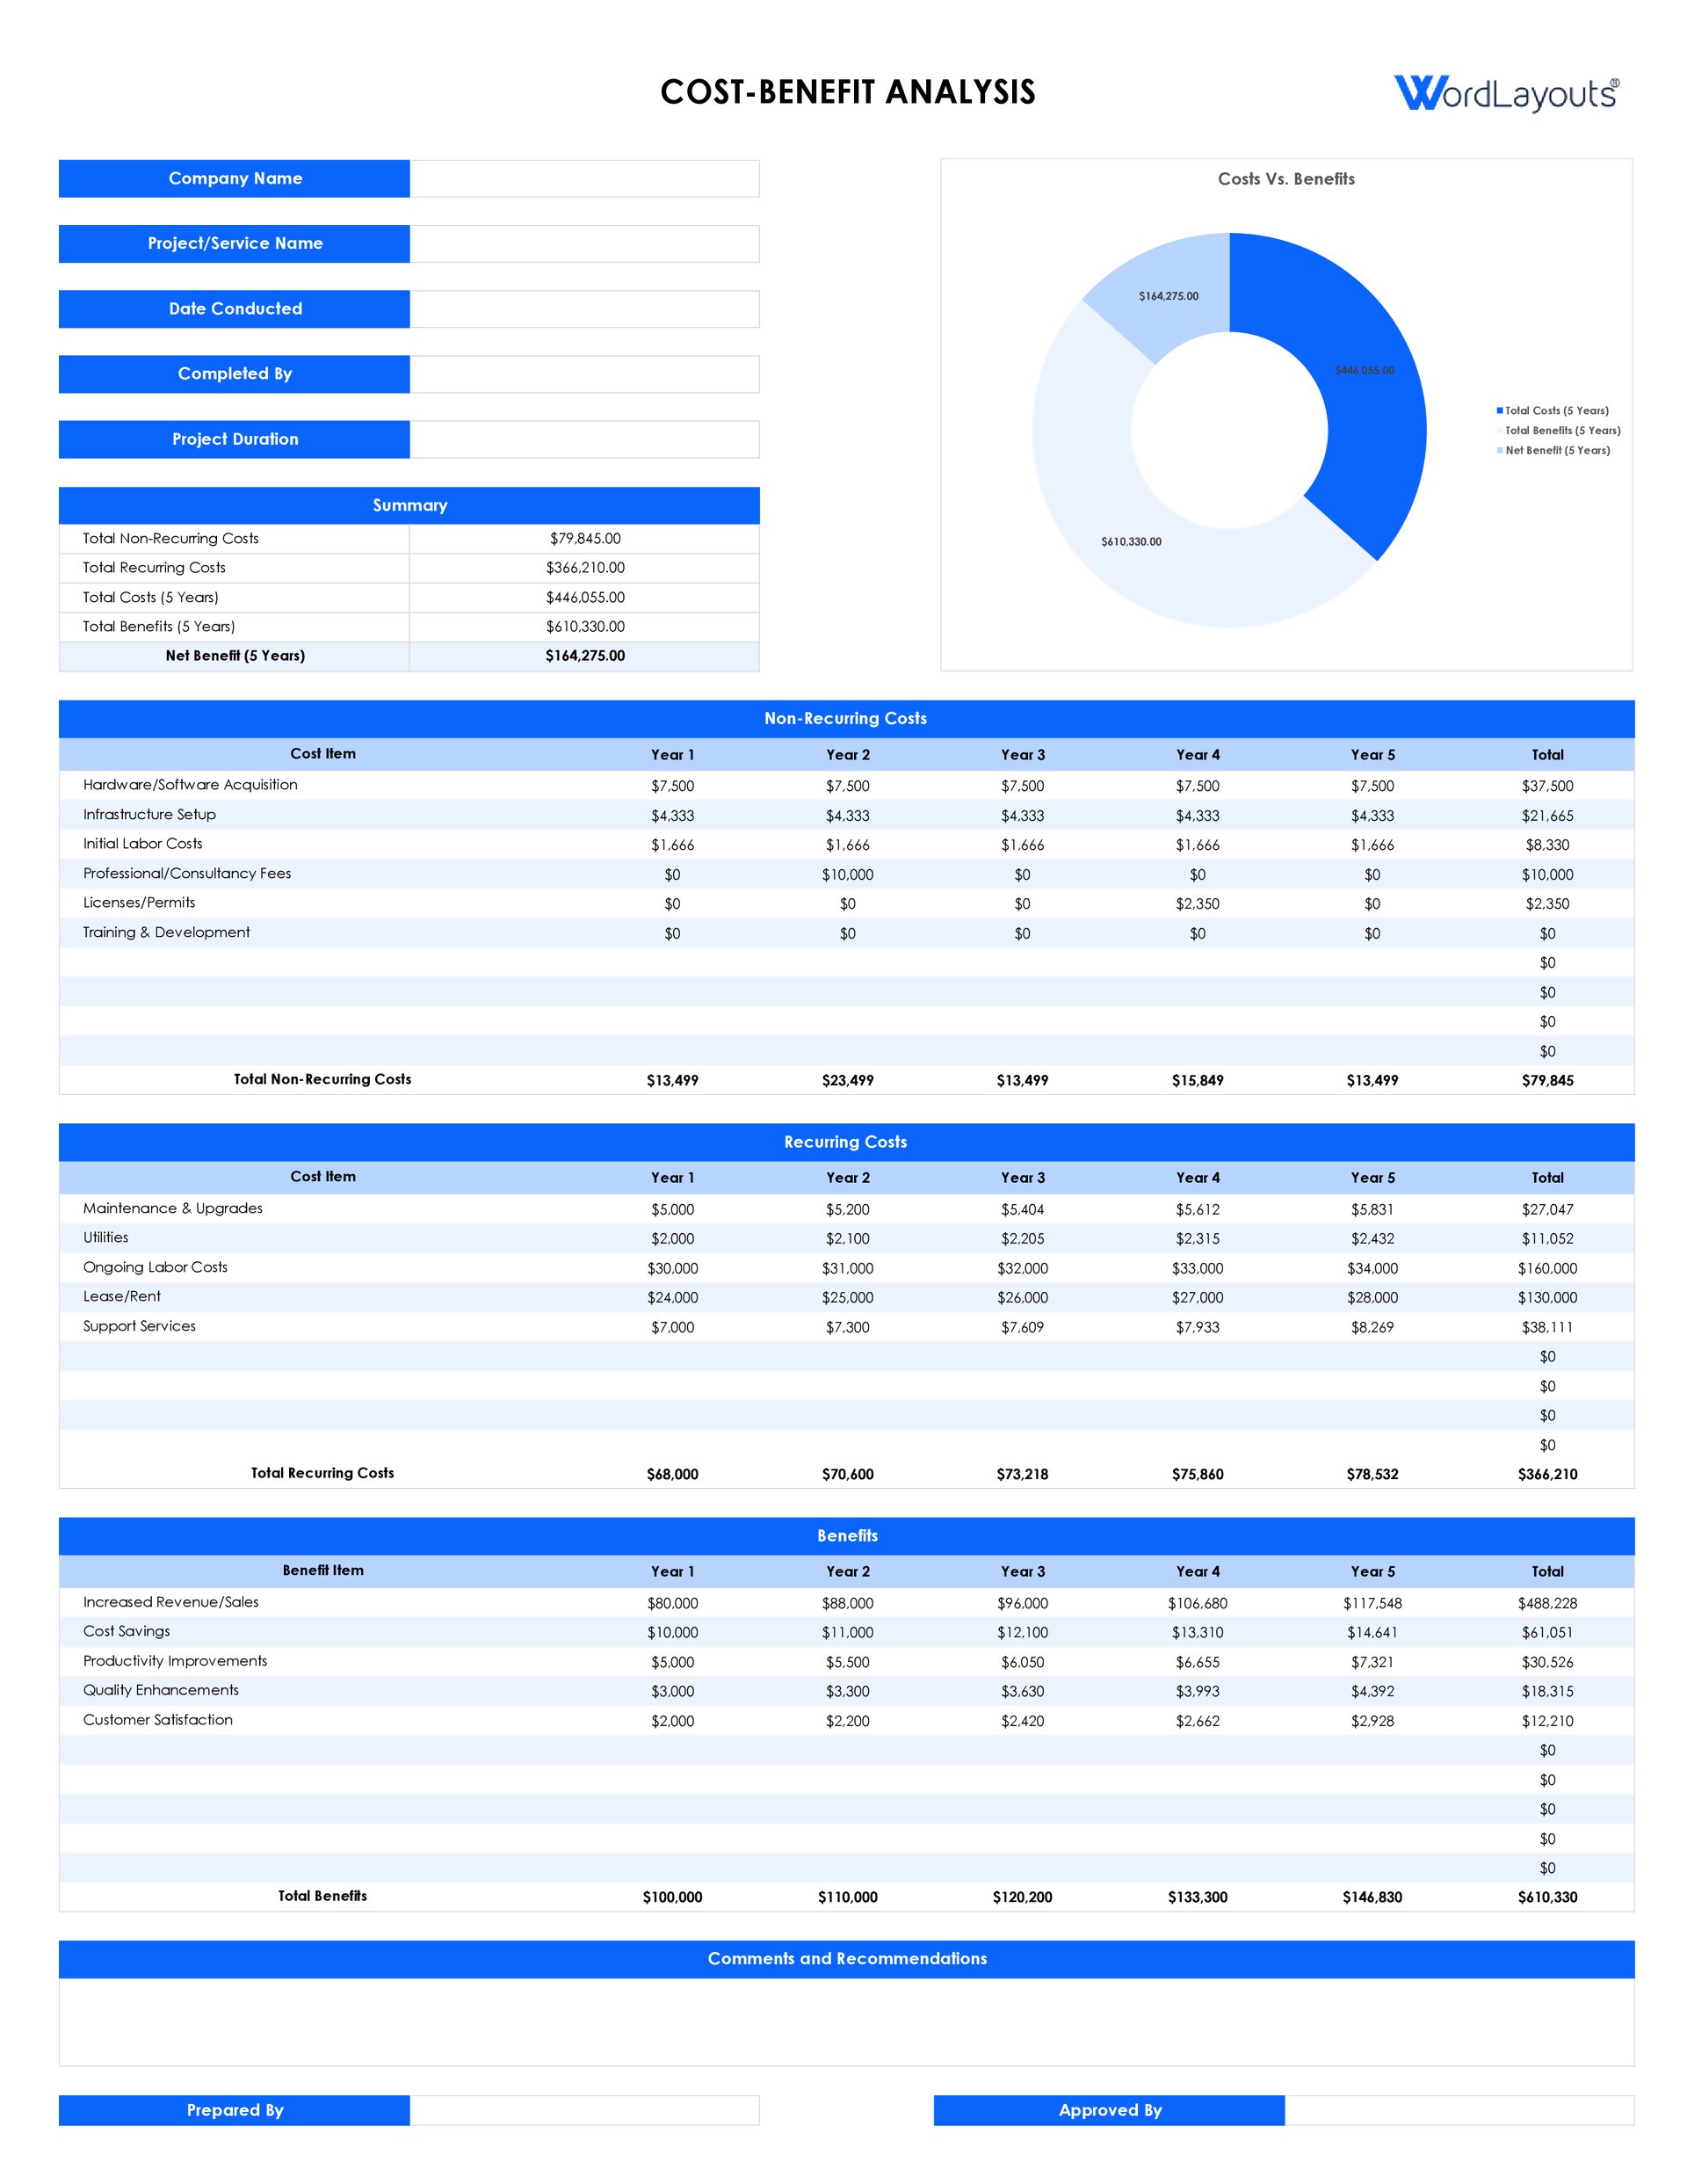
In many Asian cultures, decisions are not made in isolation but in consideration of family, community, and long‑term stability. A robust cost benefit analysis (CBA) aligns with these principles by offering a transparent, data‑driven framework that balances short‑term costs with enduring advantages. Whether you’re a startup in Singapore planning to launch a new app, a municipal council in Tokyo evaluating a green‑energy project, or a family in Mumbai deciding on a home renovation, a well‑crafted CBA helps you see the full picture.
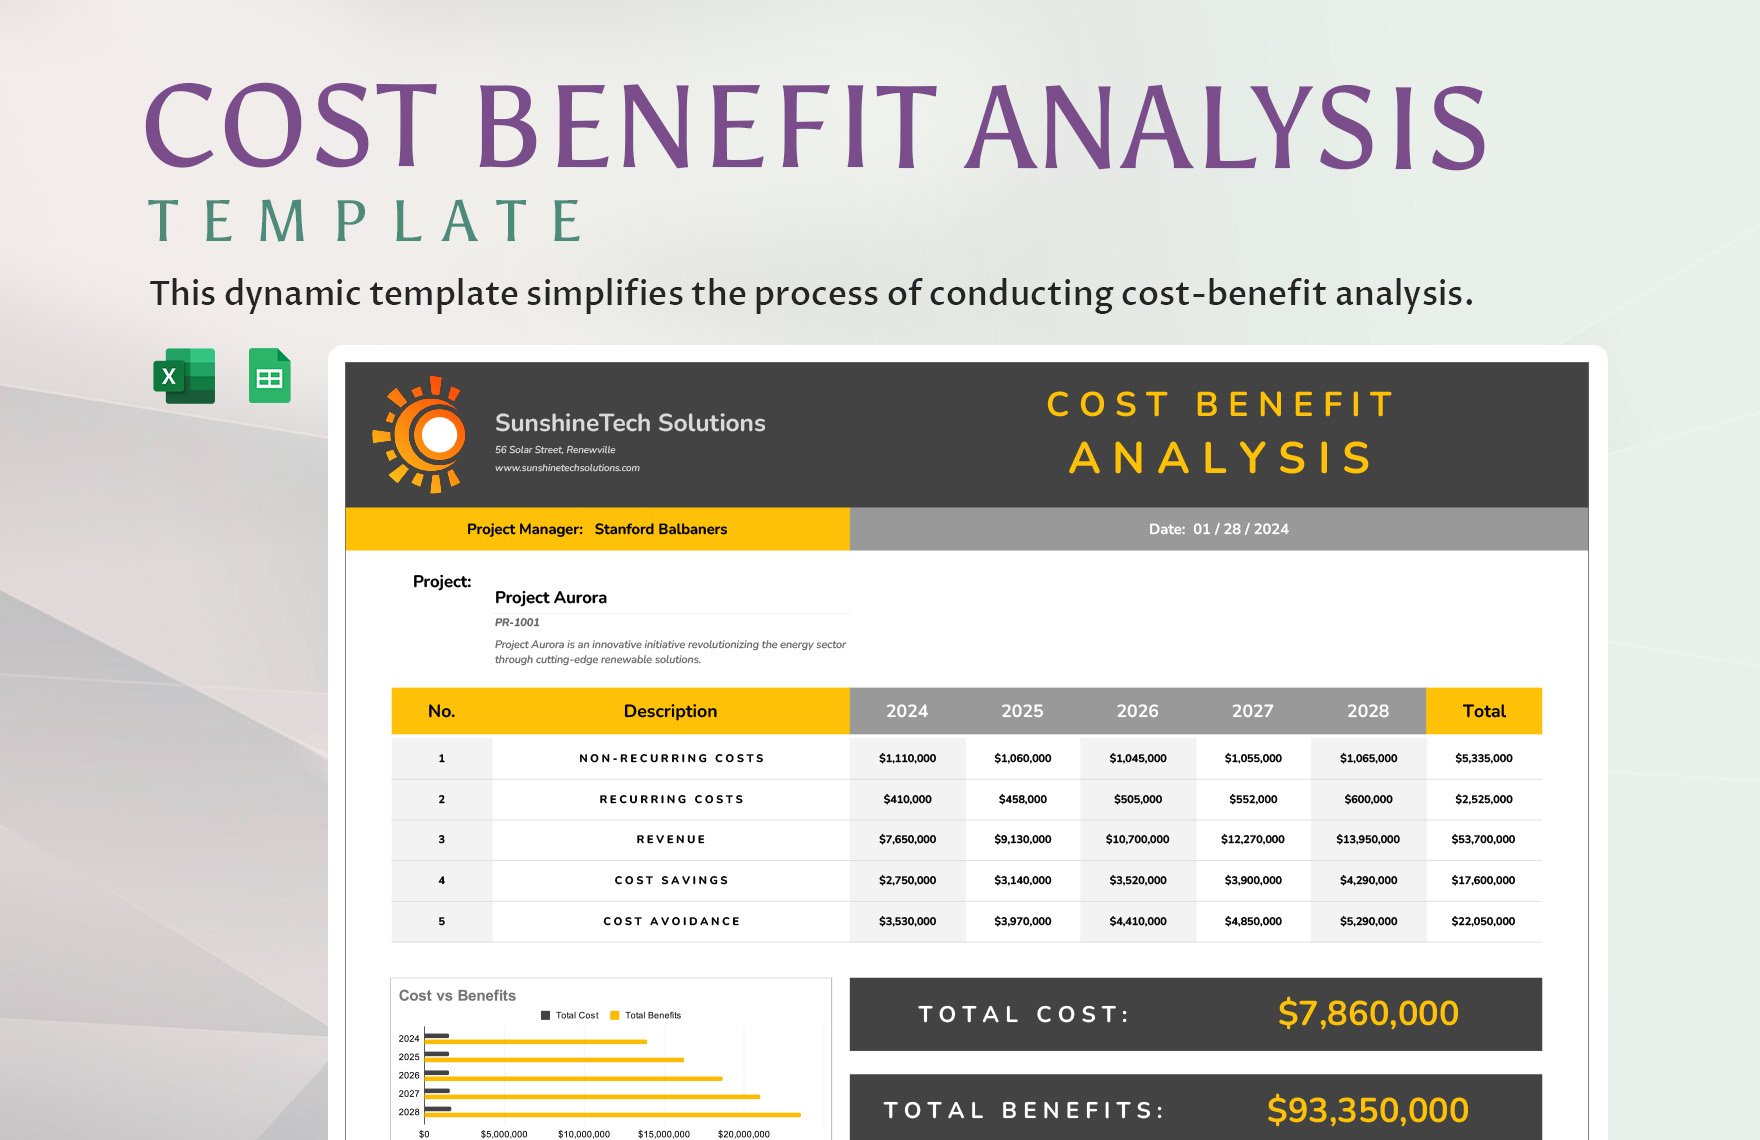
Key Elements of an Effective CBA Template

1. Clear Objective Statement
Begin by defining the decision’s purpose. Use concise language that captures the core question: “Will this initiative bring greater value than its cost?” A clear objective anchors every subsequent calculation and aligns stakeholders around a shared goal.
2. Identification of Benefits
List all tangible and intangible benefits, such as:
- Revenue growth or cost savings
- Market share expansion
- Improved customer satisfaction
- Brand reputation enhancement
- Social impact or community goodwill
- Employee morale and retention
Assign realistic monetary values where possible, and use qualitative descriptors for hard‑to‑quantify benefits.
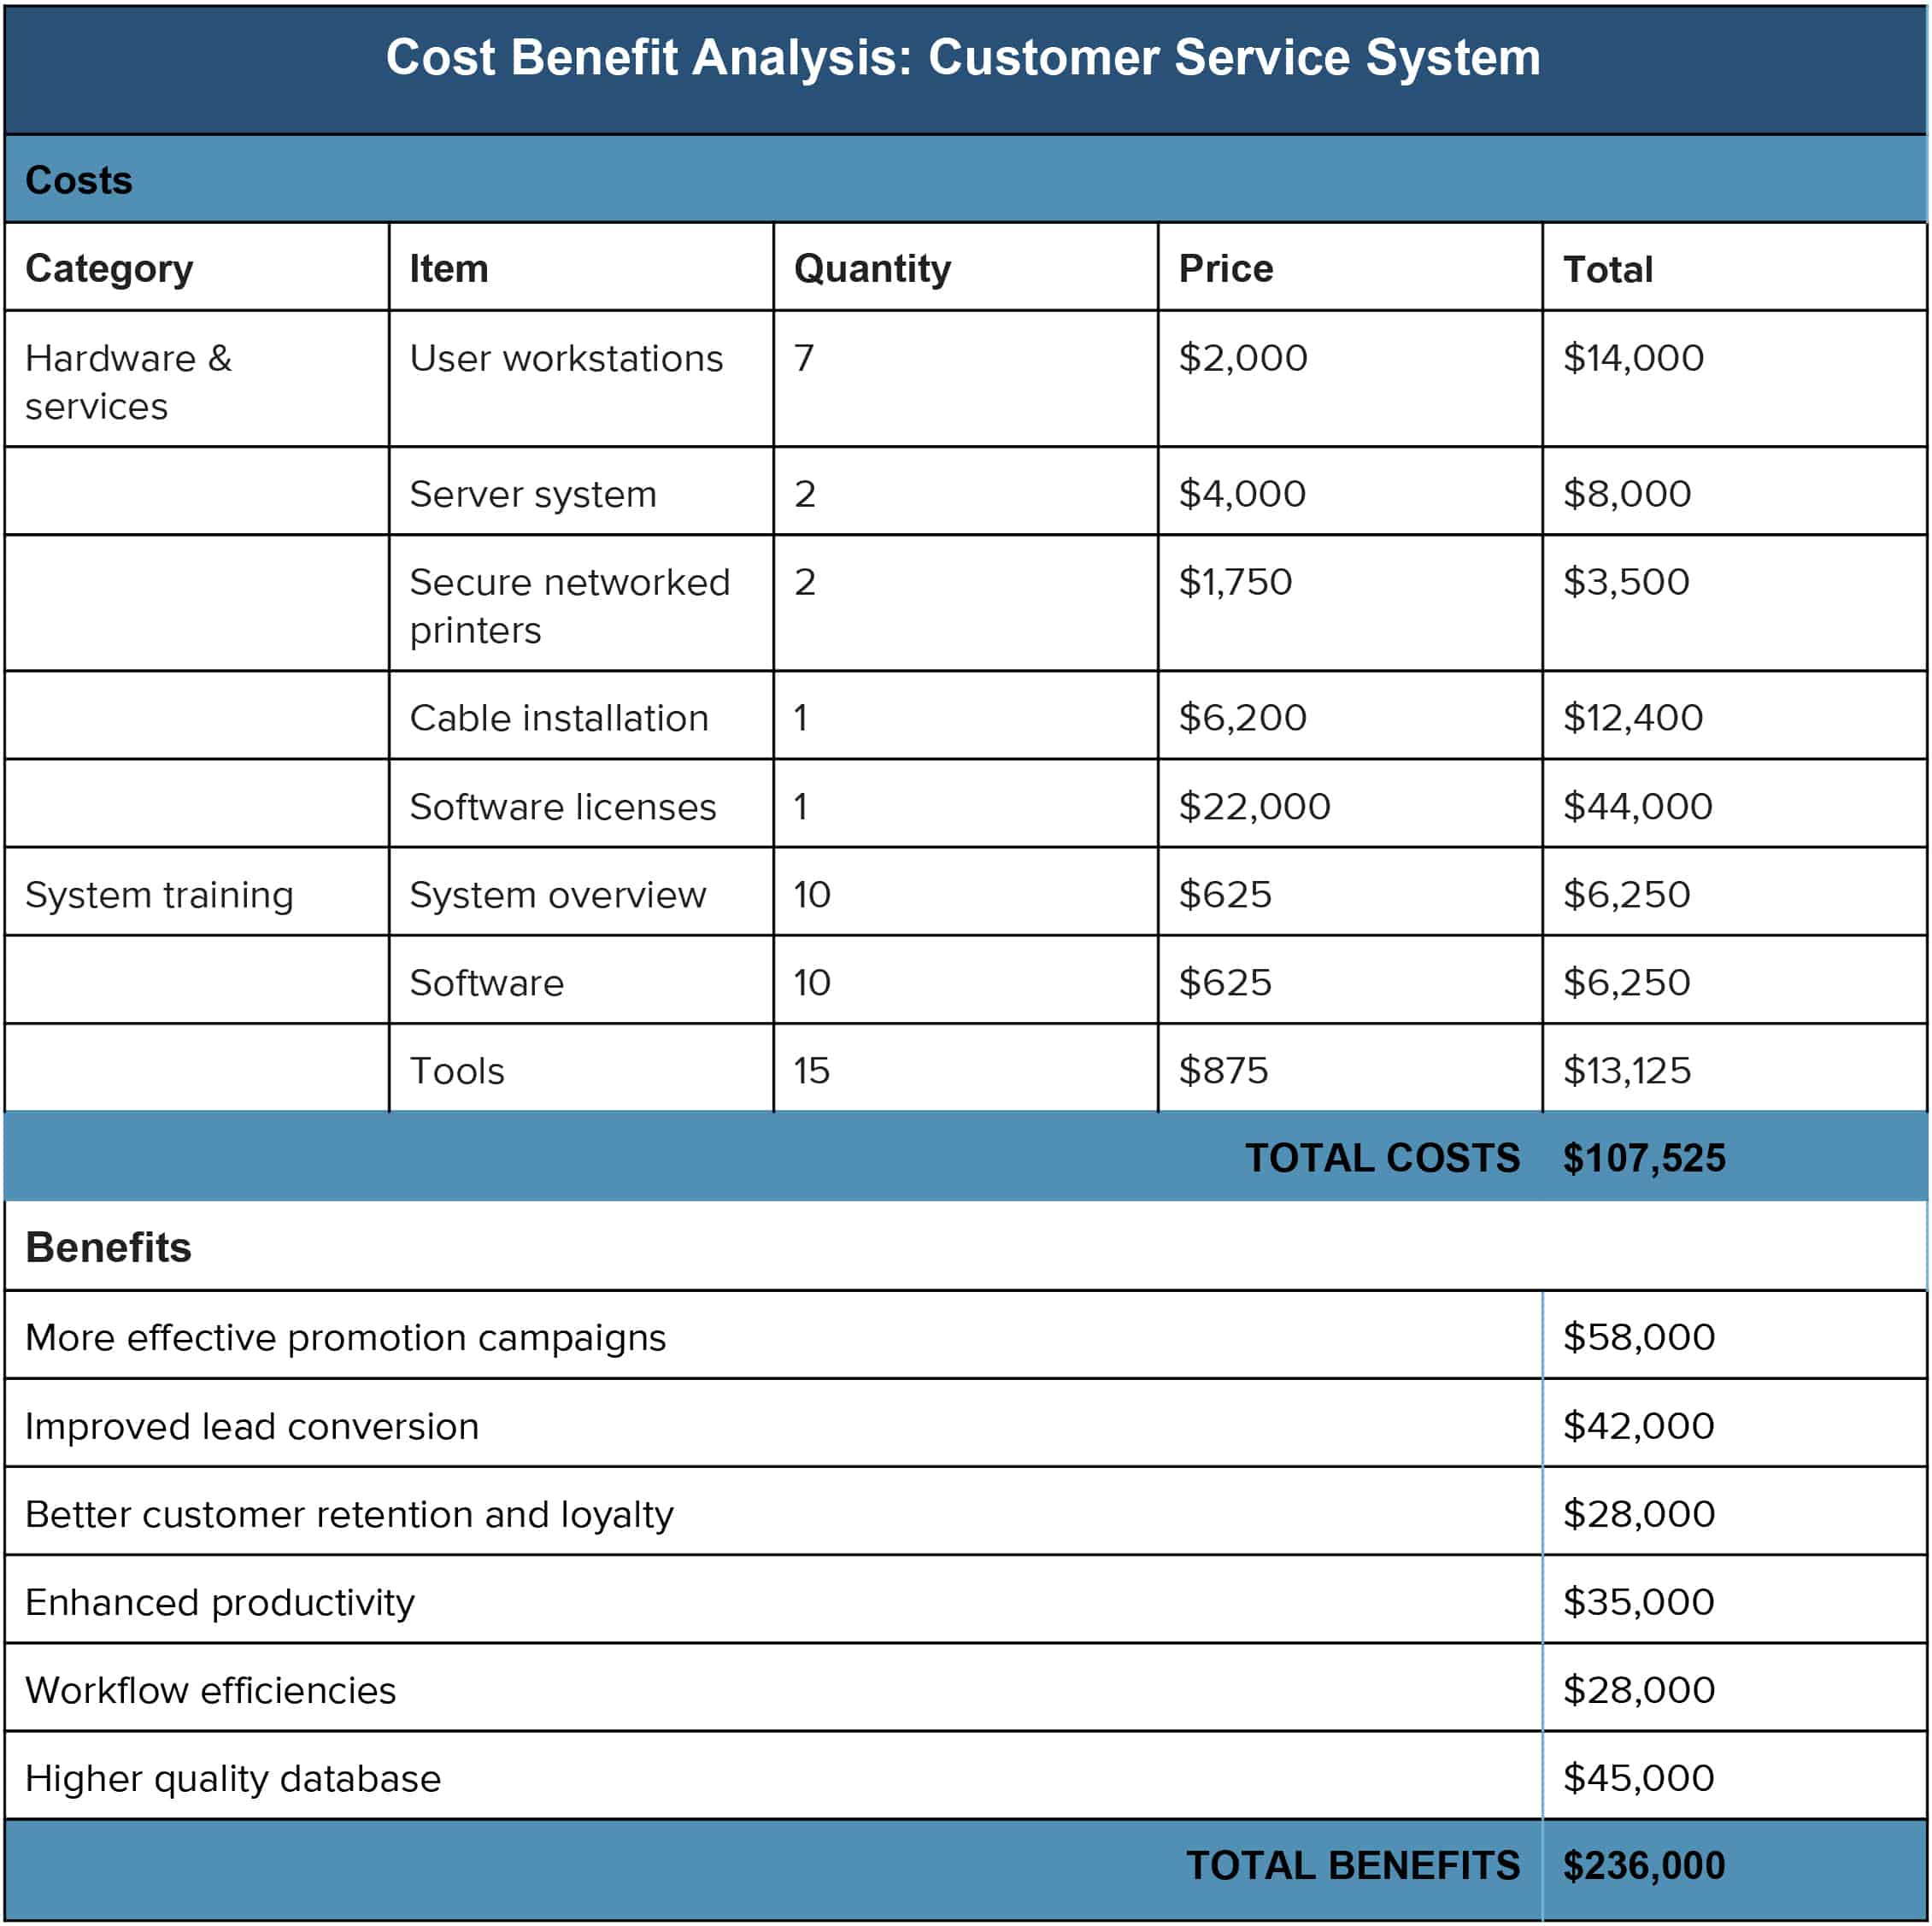
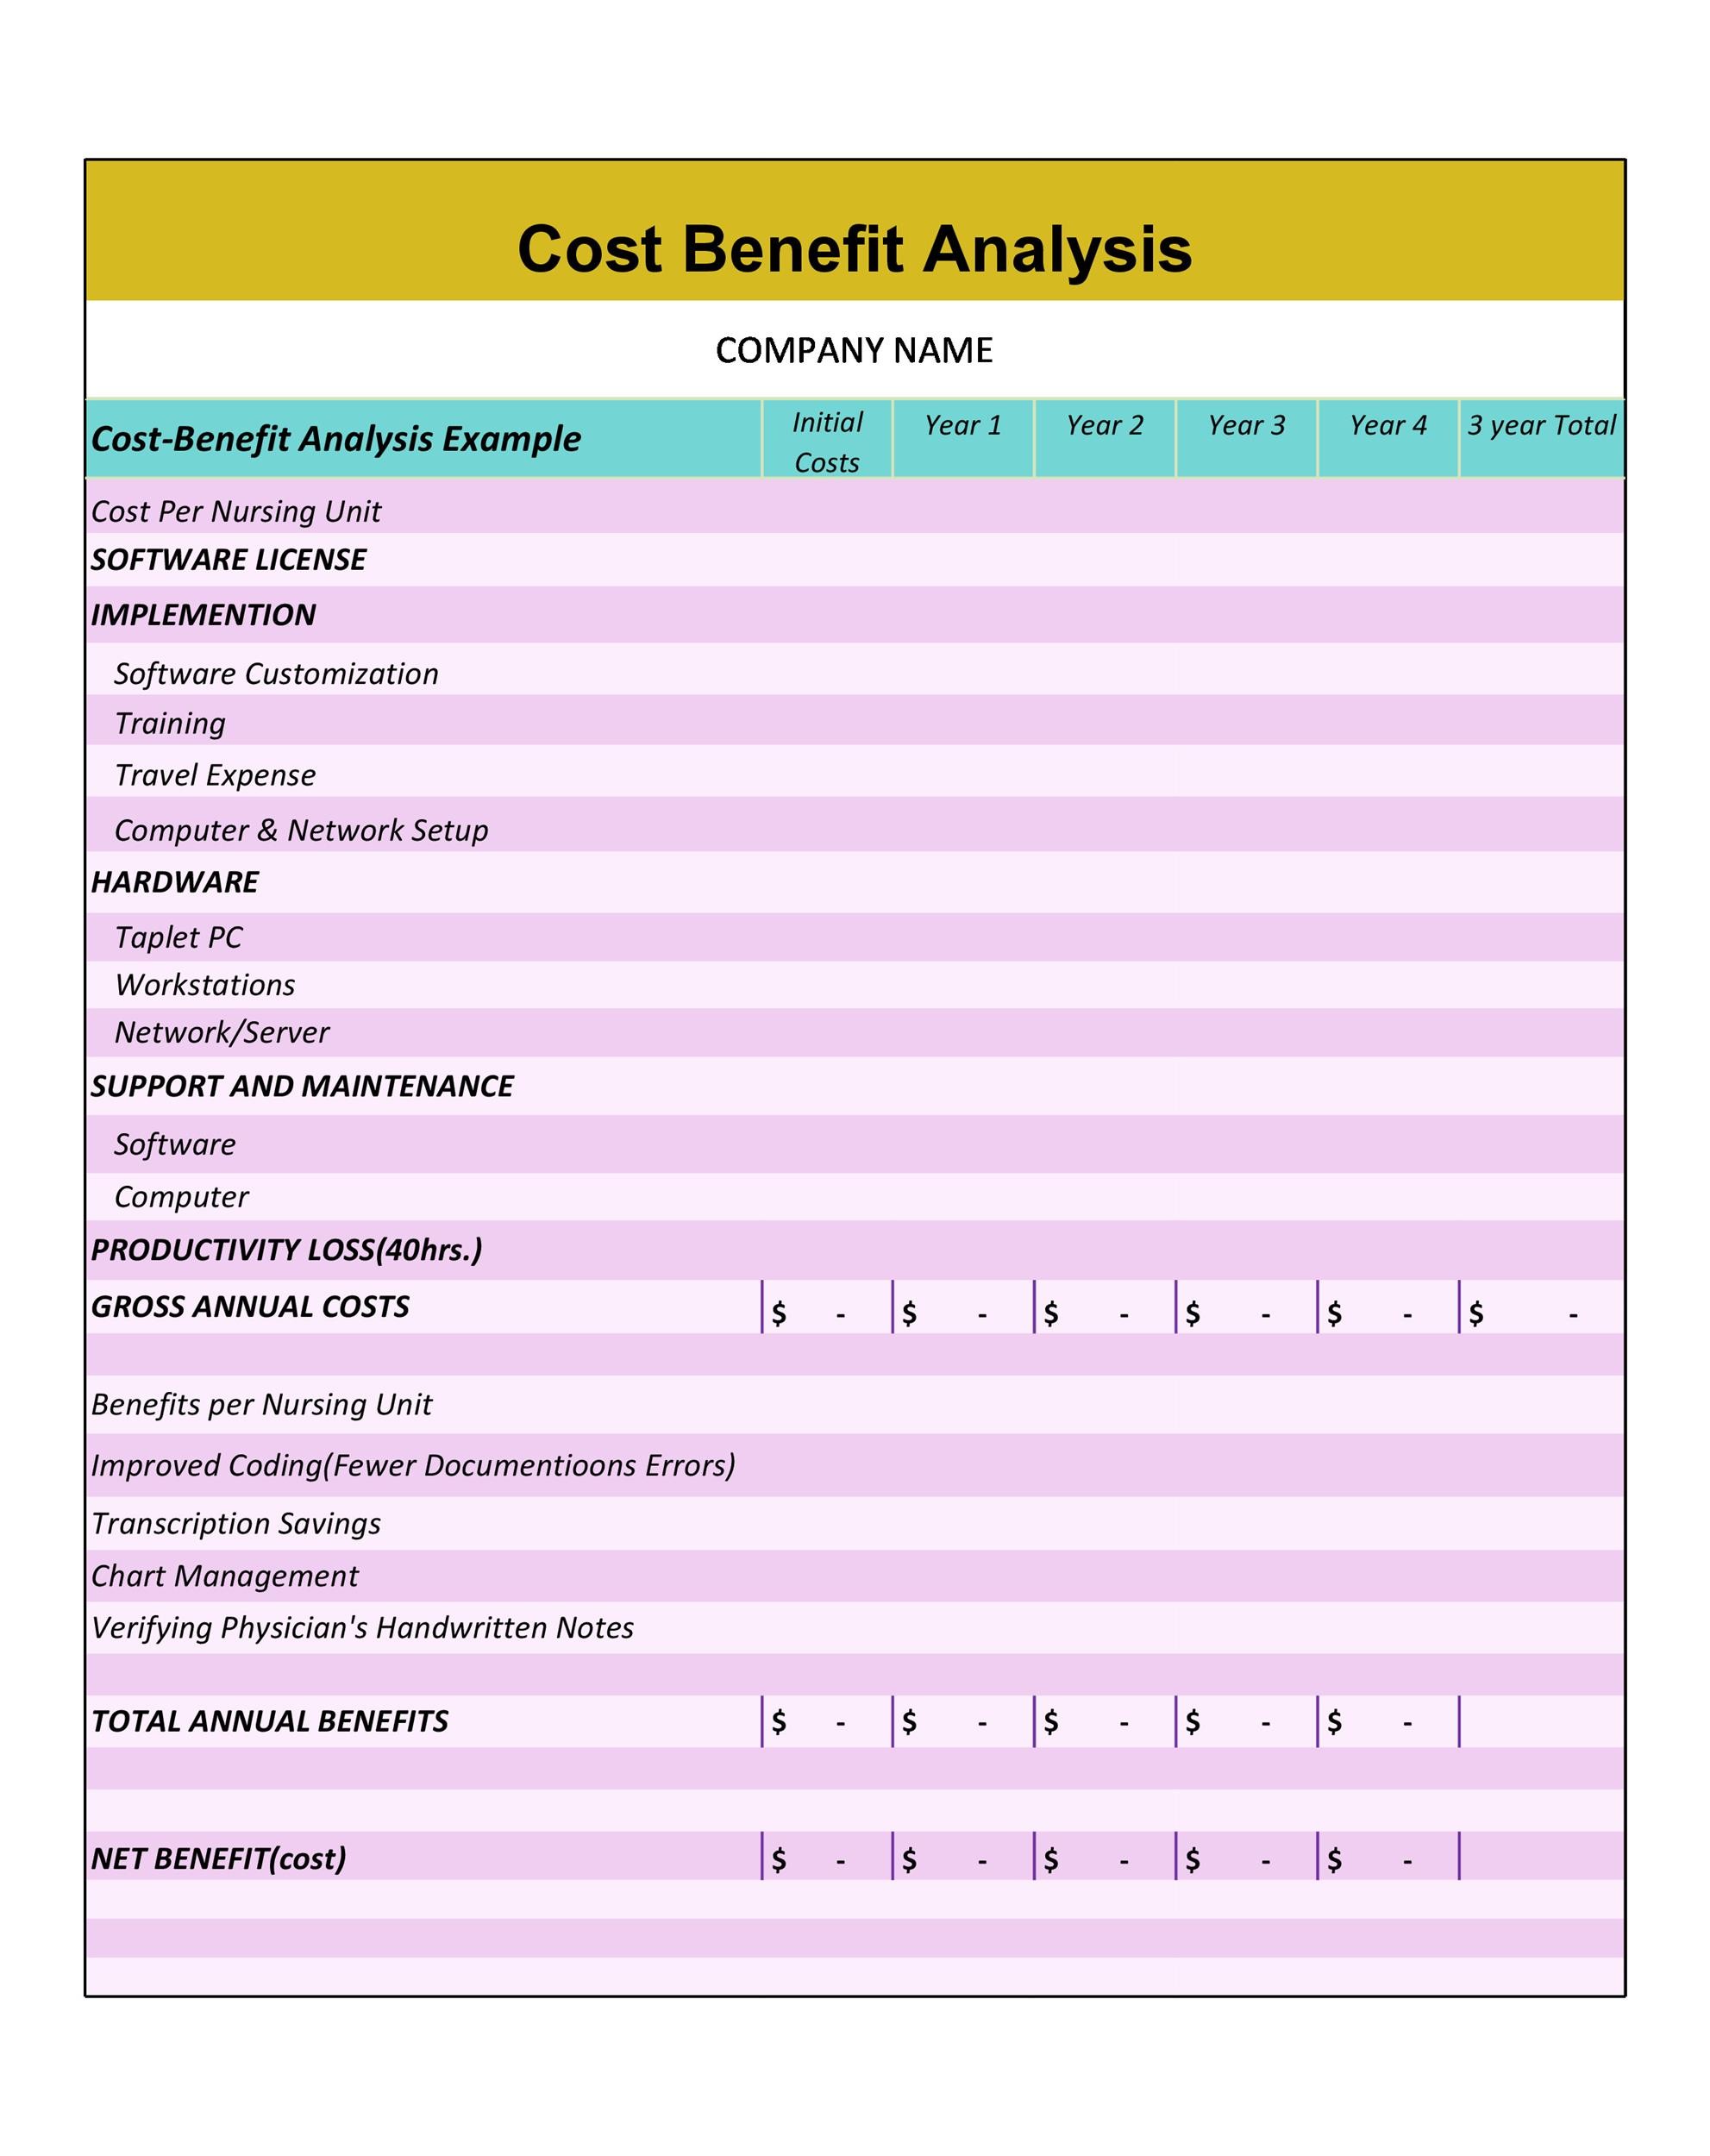
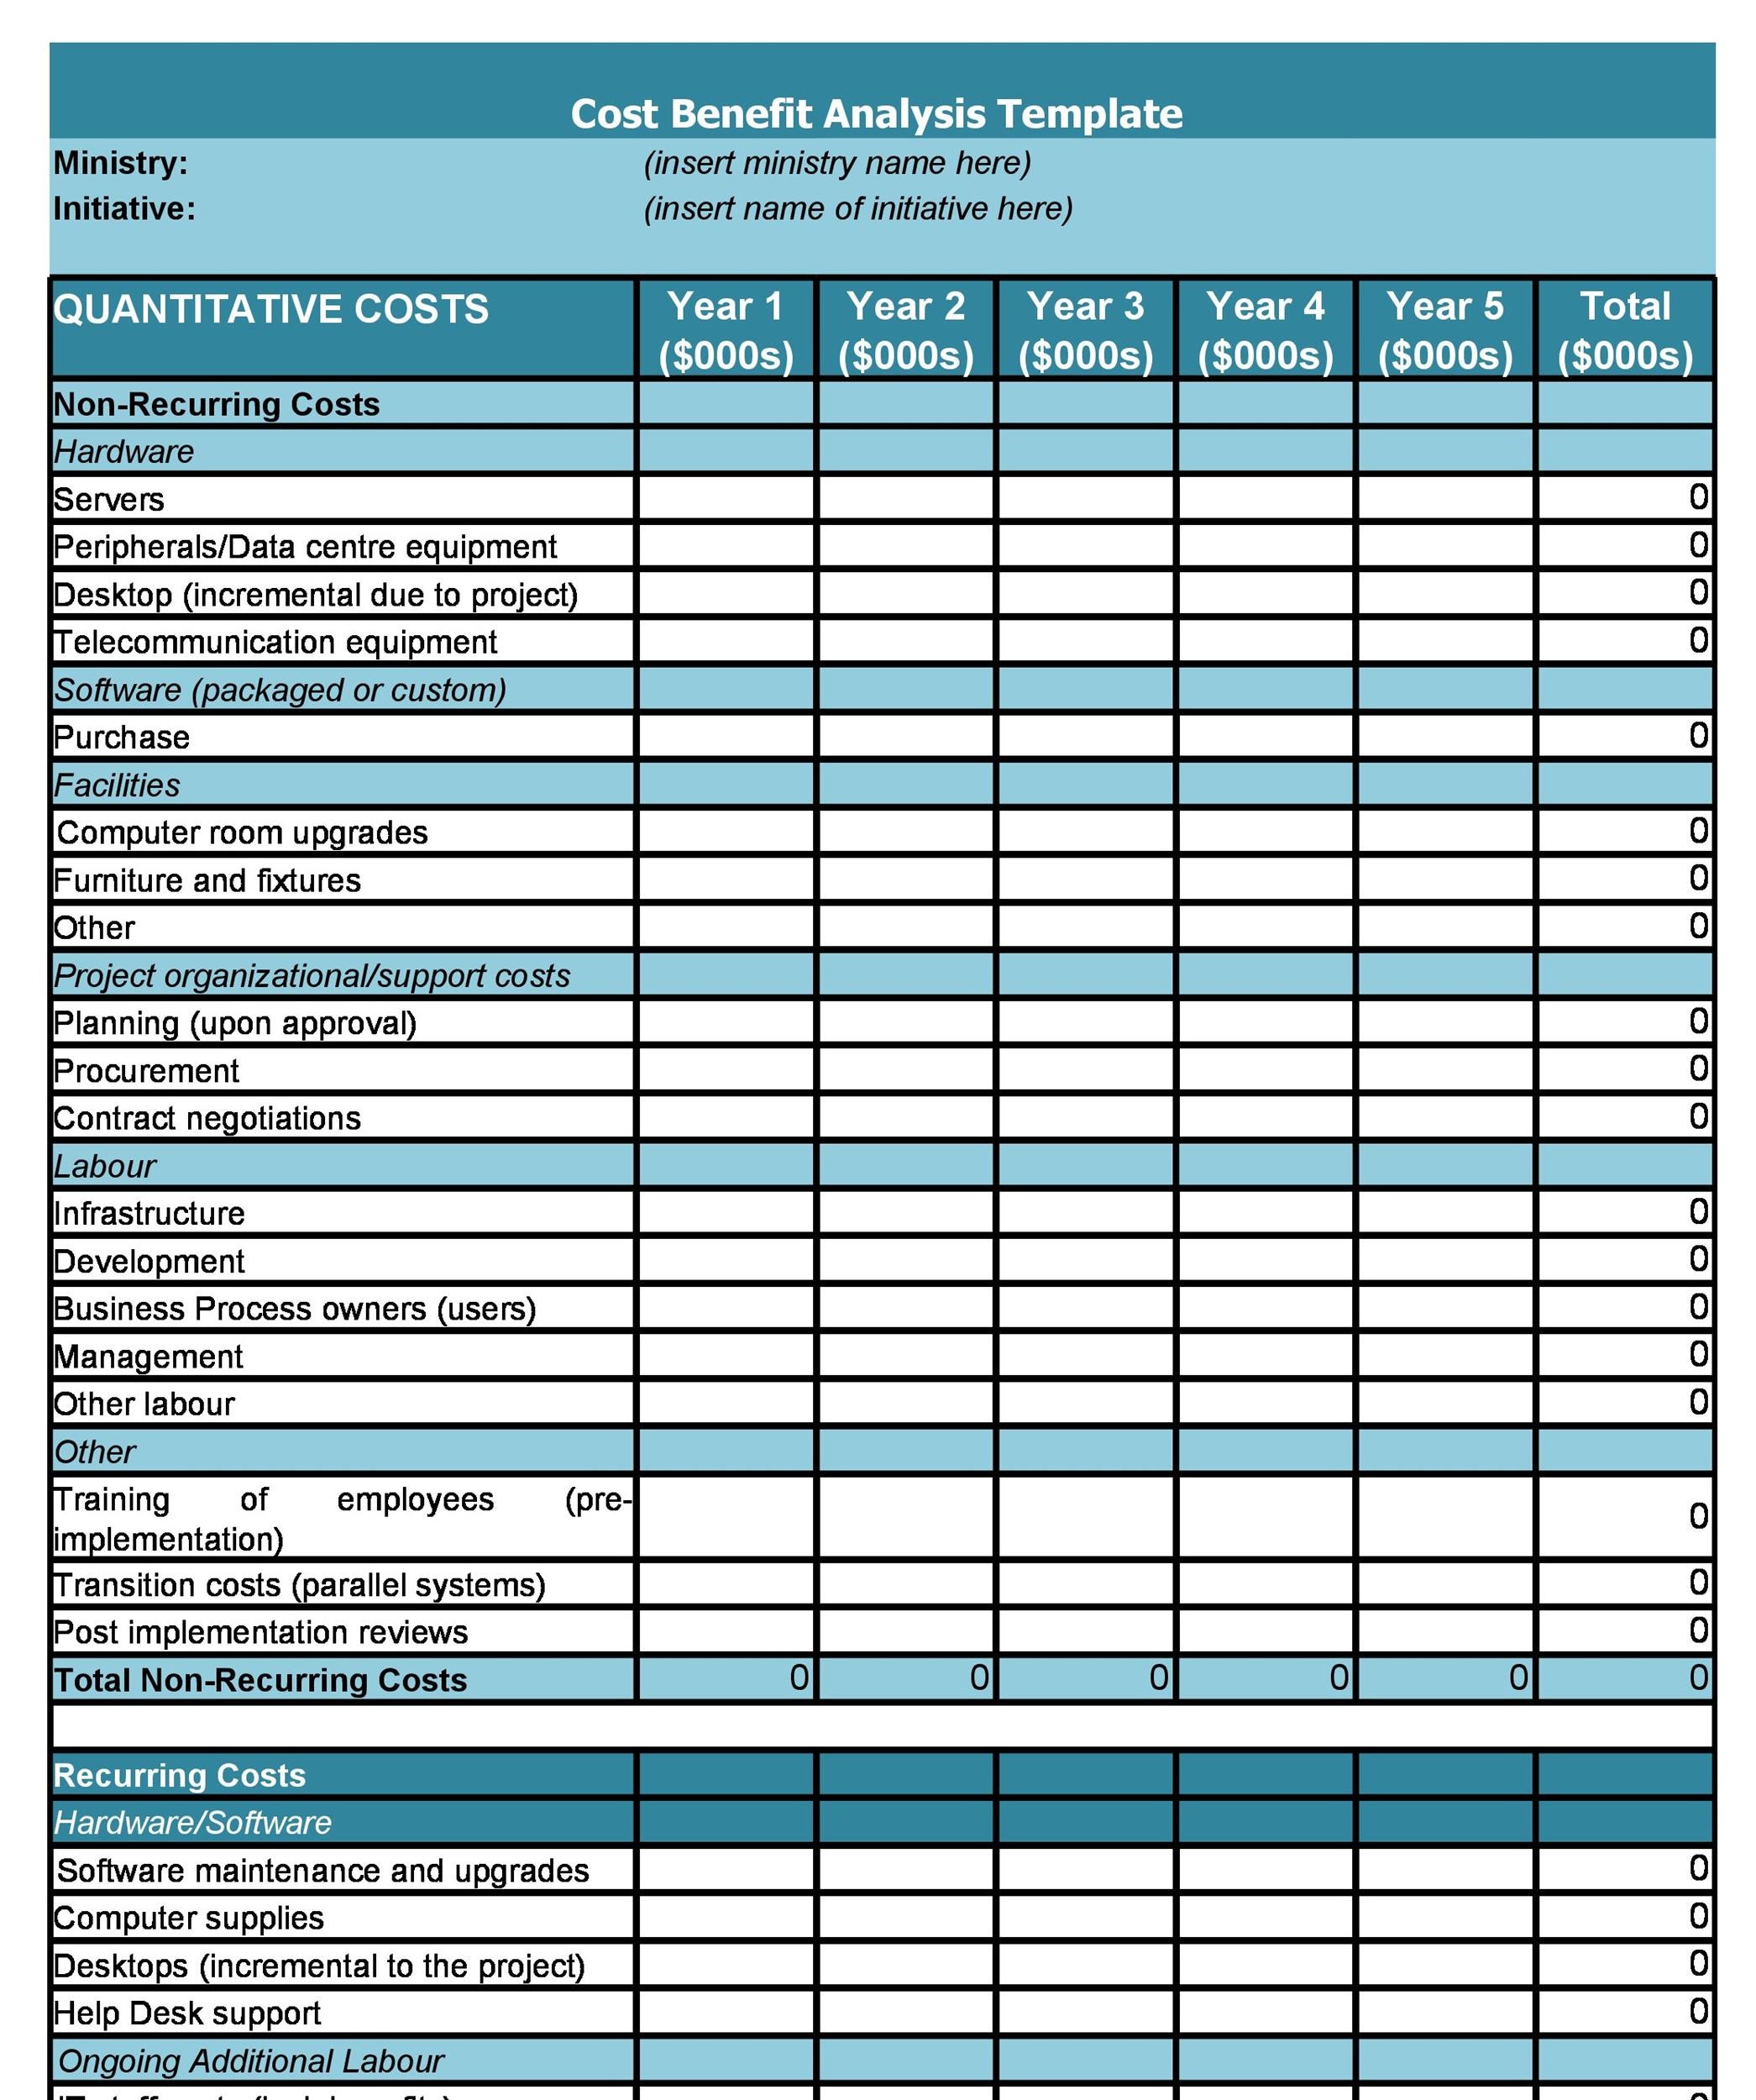
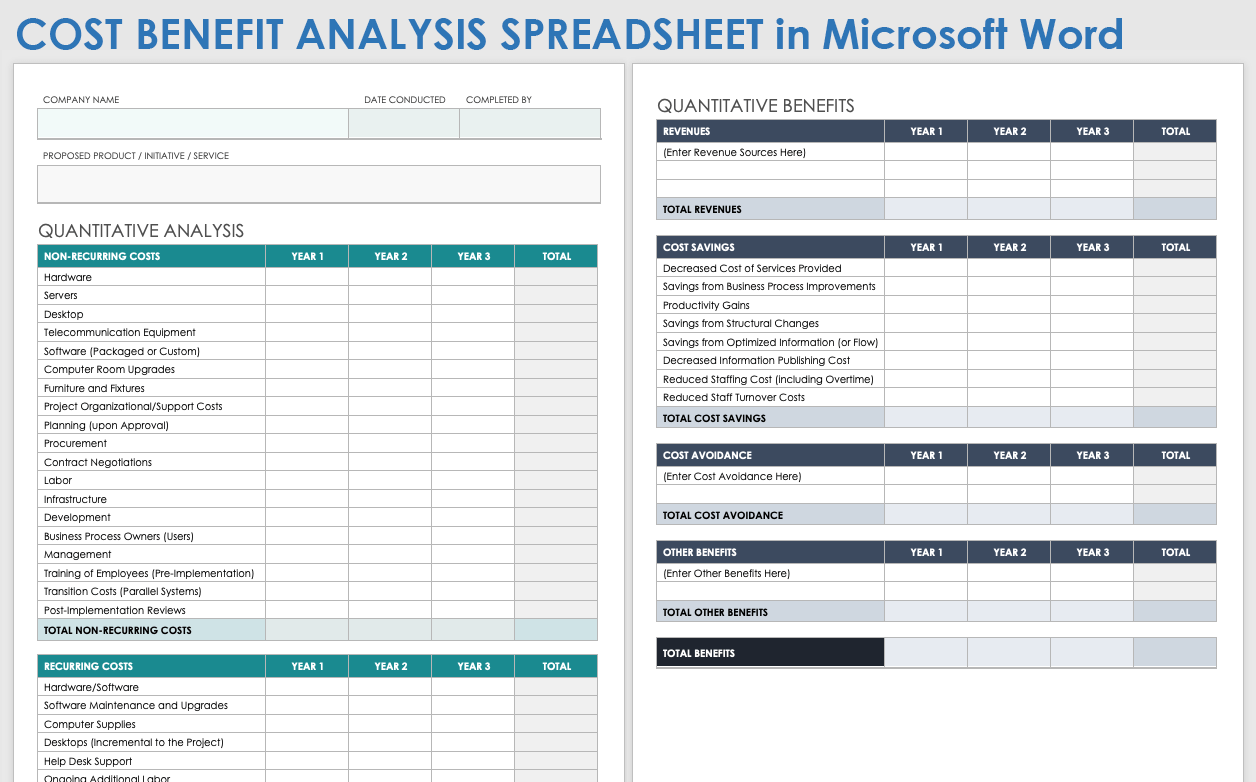
3. Cost Breakdown
Detail every expense that will arise:
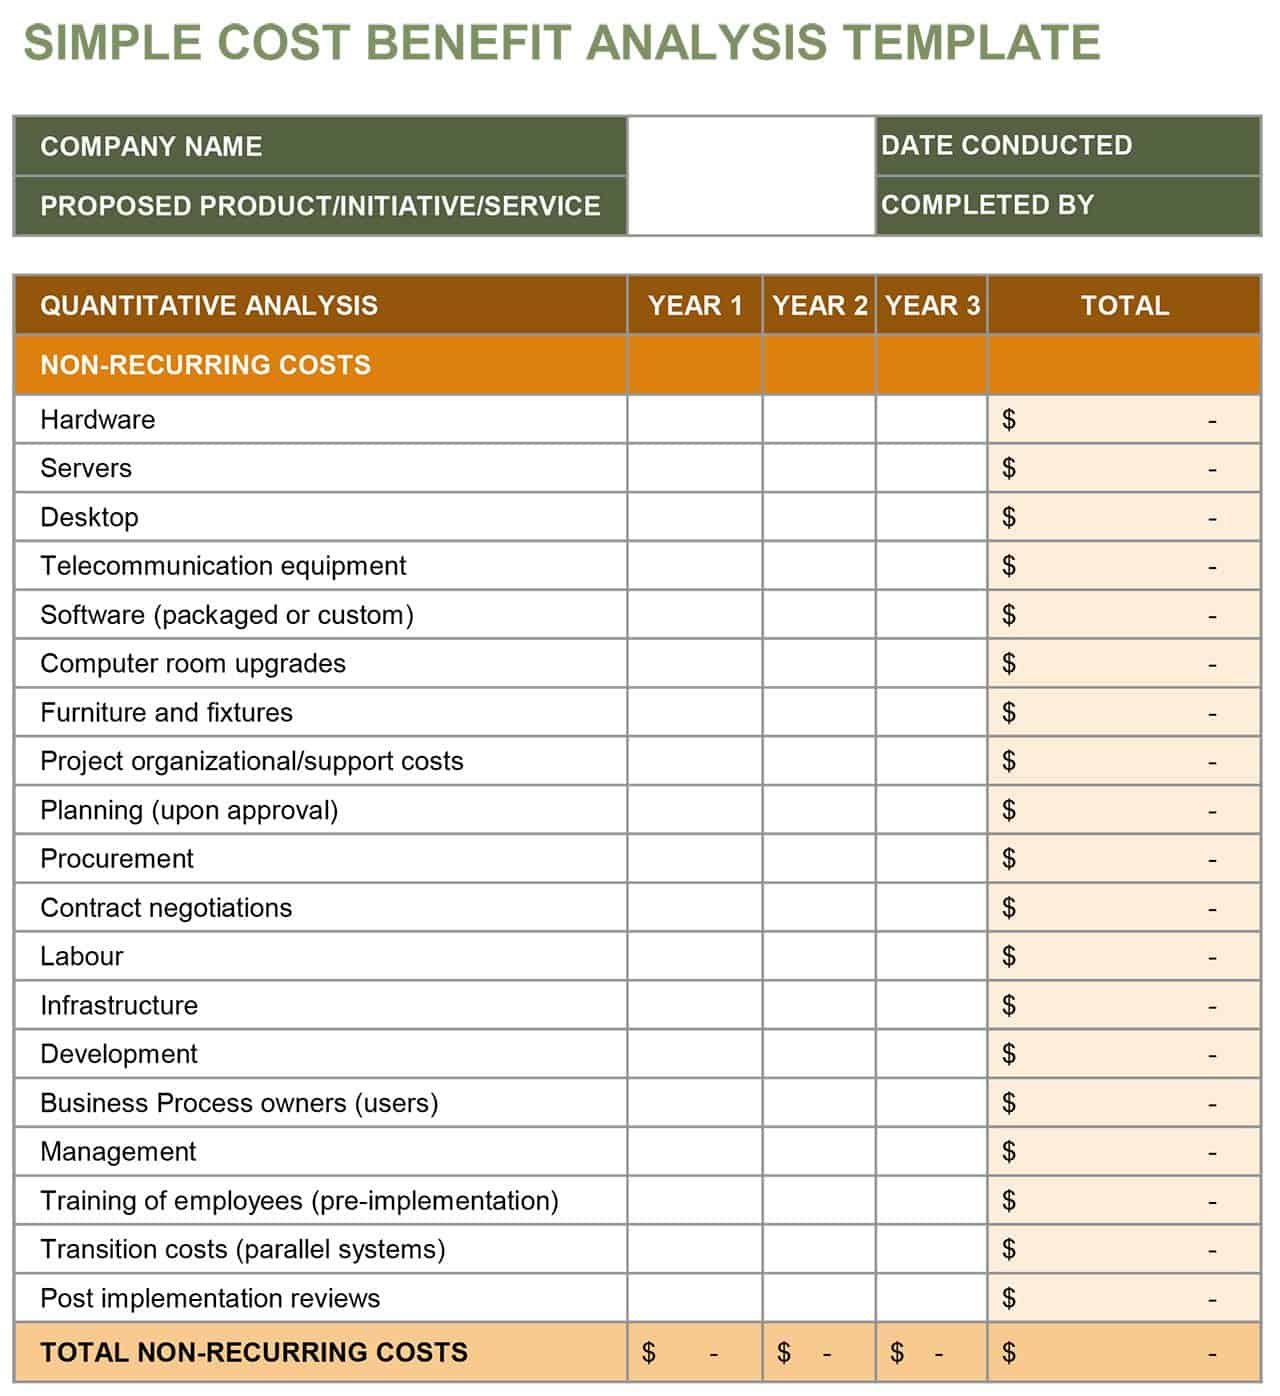
- Initial capital investment (equipment, software, training)
- Operating costs (utilities, maintenance)
- Human resources (salaries, outsourcing)
- Risk and contingency expenses (insurance, regulatory compliance)
- Opportunity cost (alternative projects foregone)
Ensure that costs are updated for inflation and local market rates to maintain accuracy.
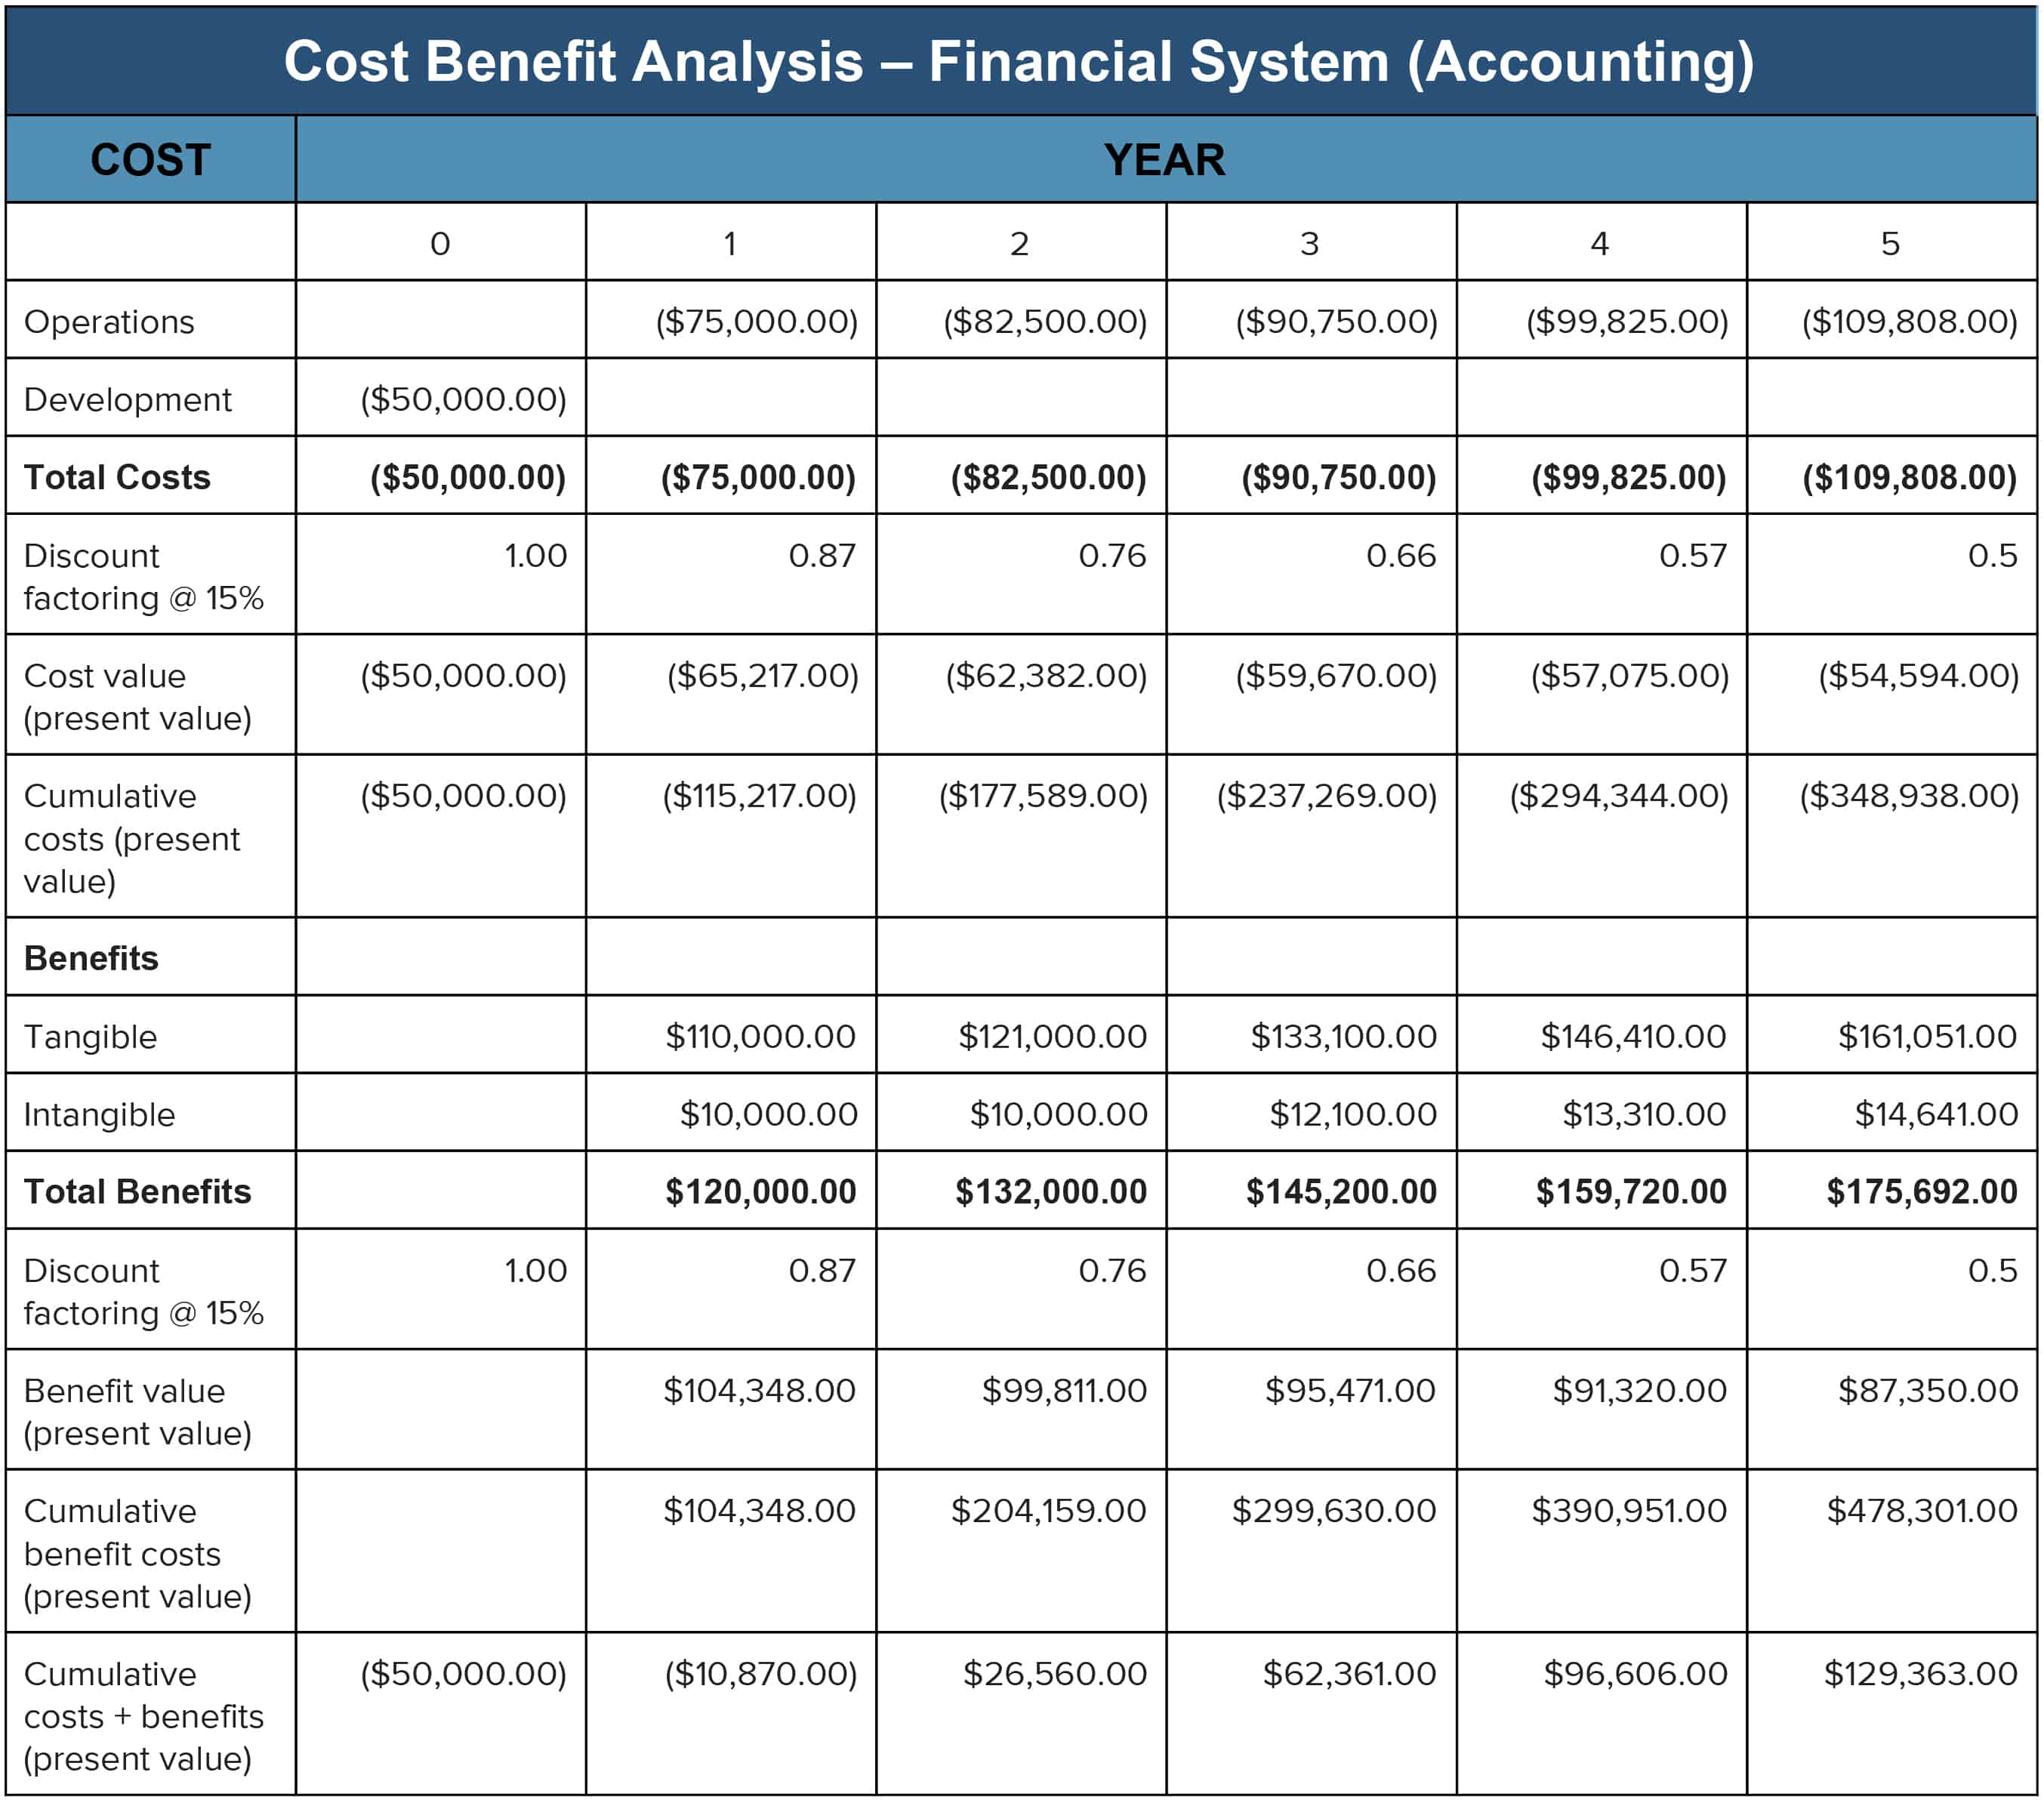
4. Time Horizon and Discounting
Define the analysis period—often 3 to 5 years for many projects. Apply a discount rate that reflects the cost of capital and risk profile. In Asian contexts, a rate between 8% and 12% is common, but adjust based on local economic conditions.
5. Sensitivity Analysis
Test how changes in key variables affect outcomes. Identify the most influential assumptions (e.g., sales growth, operating margin) and outline possible scenarios: best case, base case, worst case. This practice mirrors the Asian focus on risk mitigation and preparedness.
6. Visual Representation
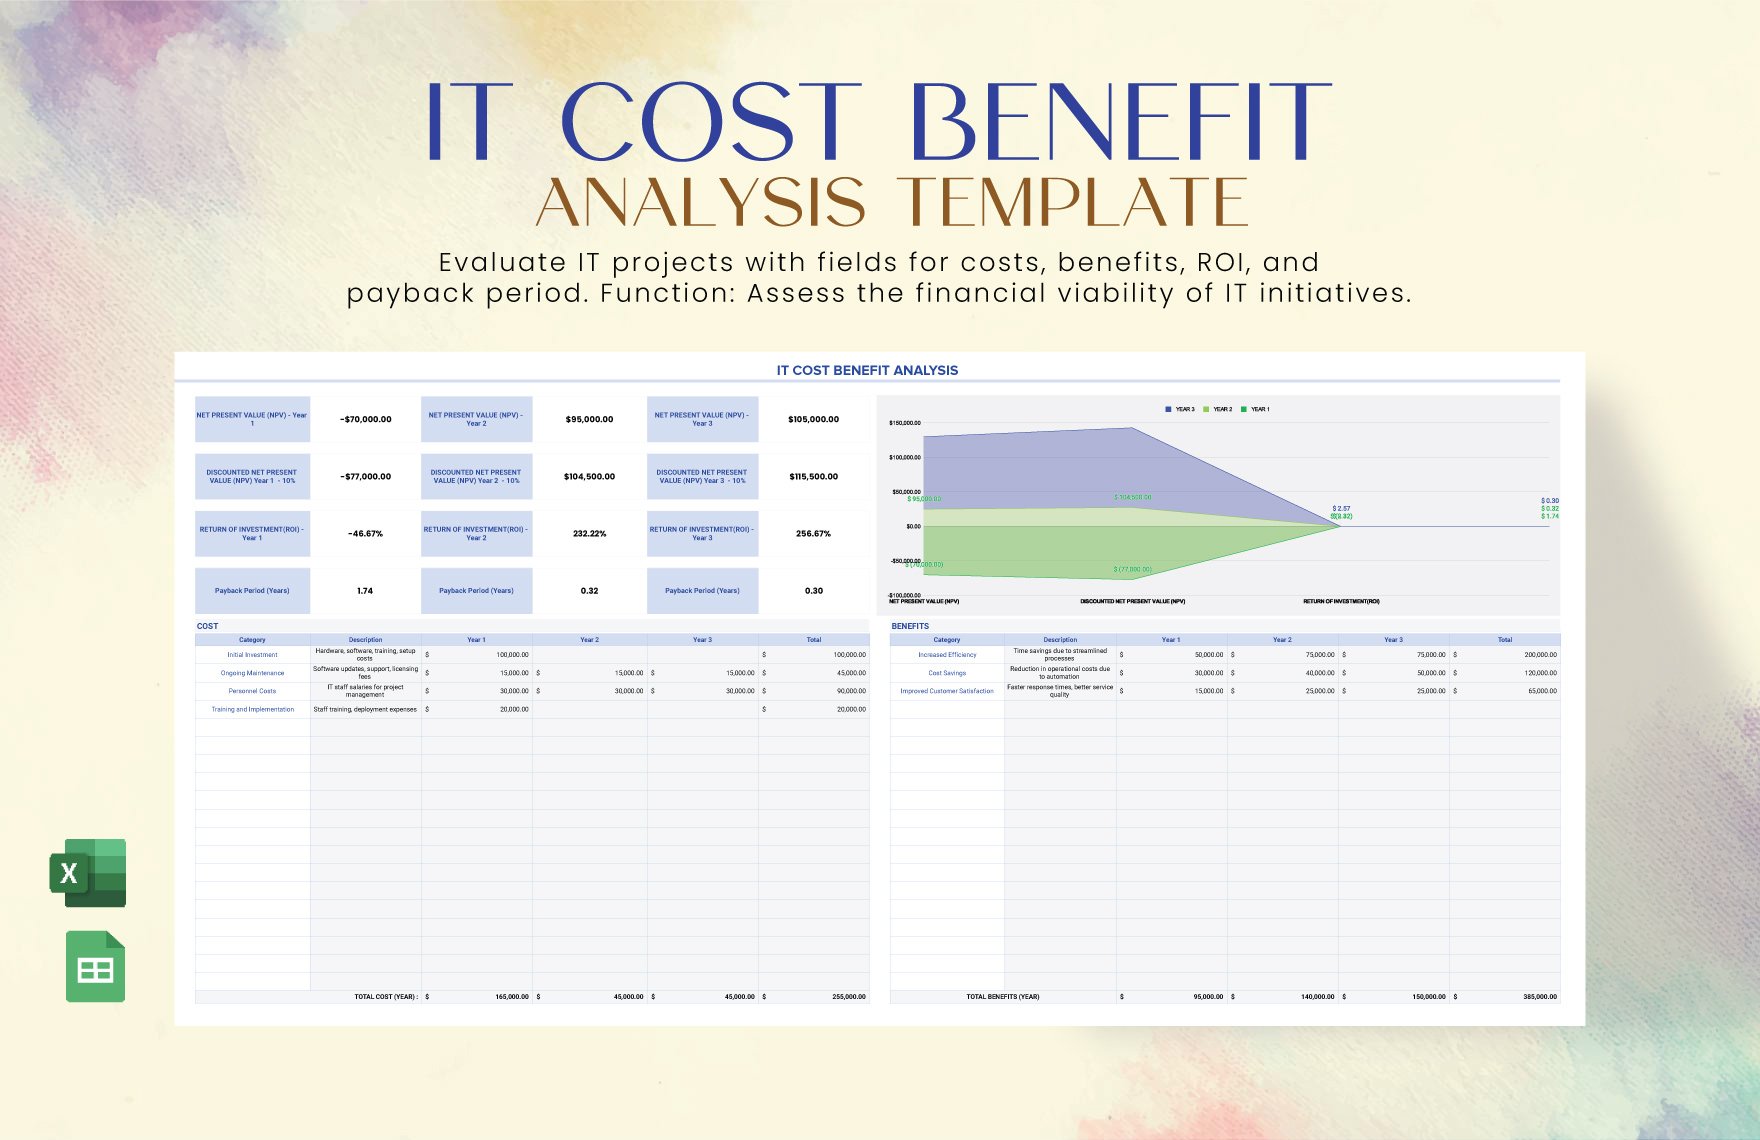
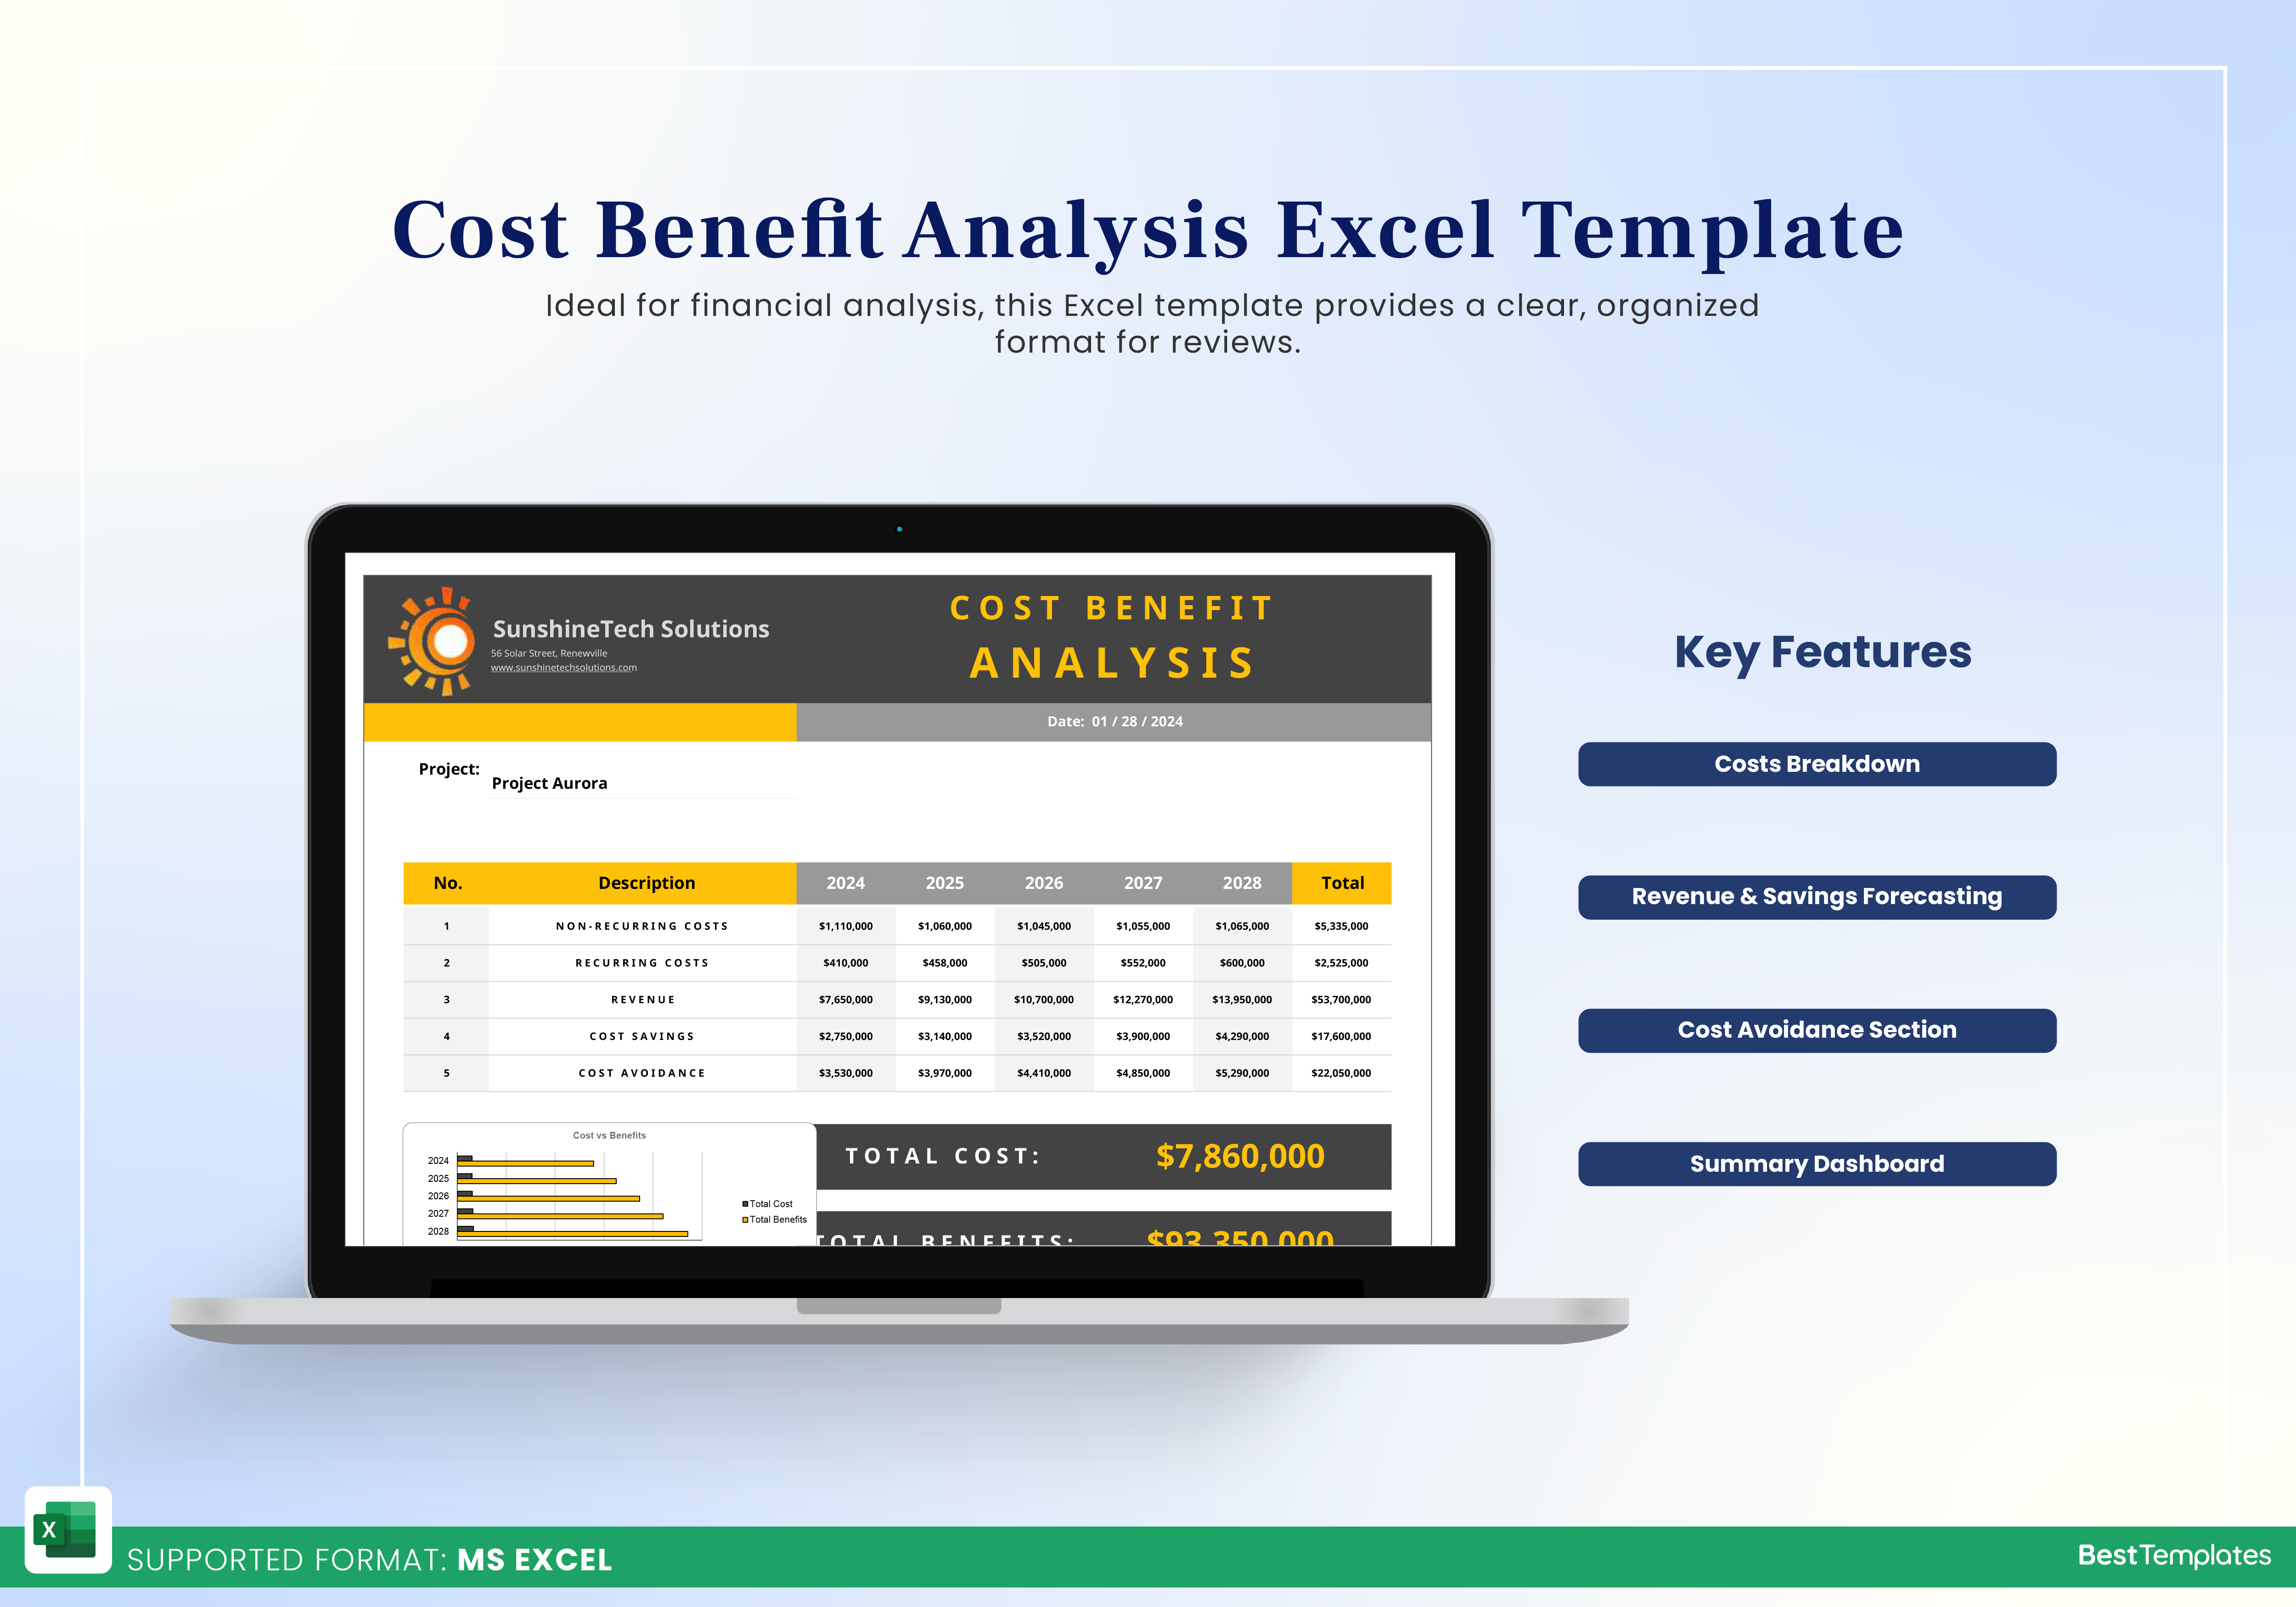
Graphs, charts, and color coding make complex data accessible. A simple bar chart comparing net present value (NPV) under different scenarios, or a pie chart showing cost distribution, can communicate insights instantly.
Step‑by‑Step Guide to Building Your Template
Step 1: Gather Data
Collect historical performance metrics, market research, and stakeholder interviews. In regions like Hong Kong or Seoul, reliable data sources include government reports, industry associations, and academic studies. Compile these into a spreadsheet for easy manipulation.
Step 2: Define Variables and Assumptions
For each benefit and cost, decide whether to use a fixed amount, a percentage, or a range. Document the rationale behind each assumption. For example, a digital marketing campaign might be expected to increase sales by 15% over the next year, based on prior campaign results.
Step 3: Create the Template Skeleton
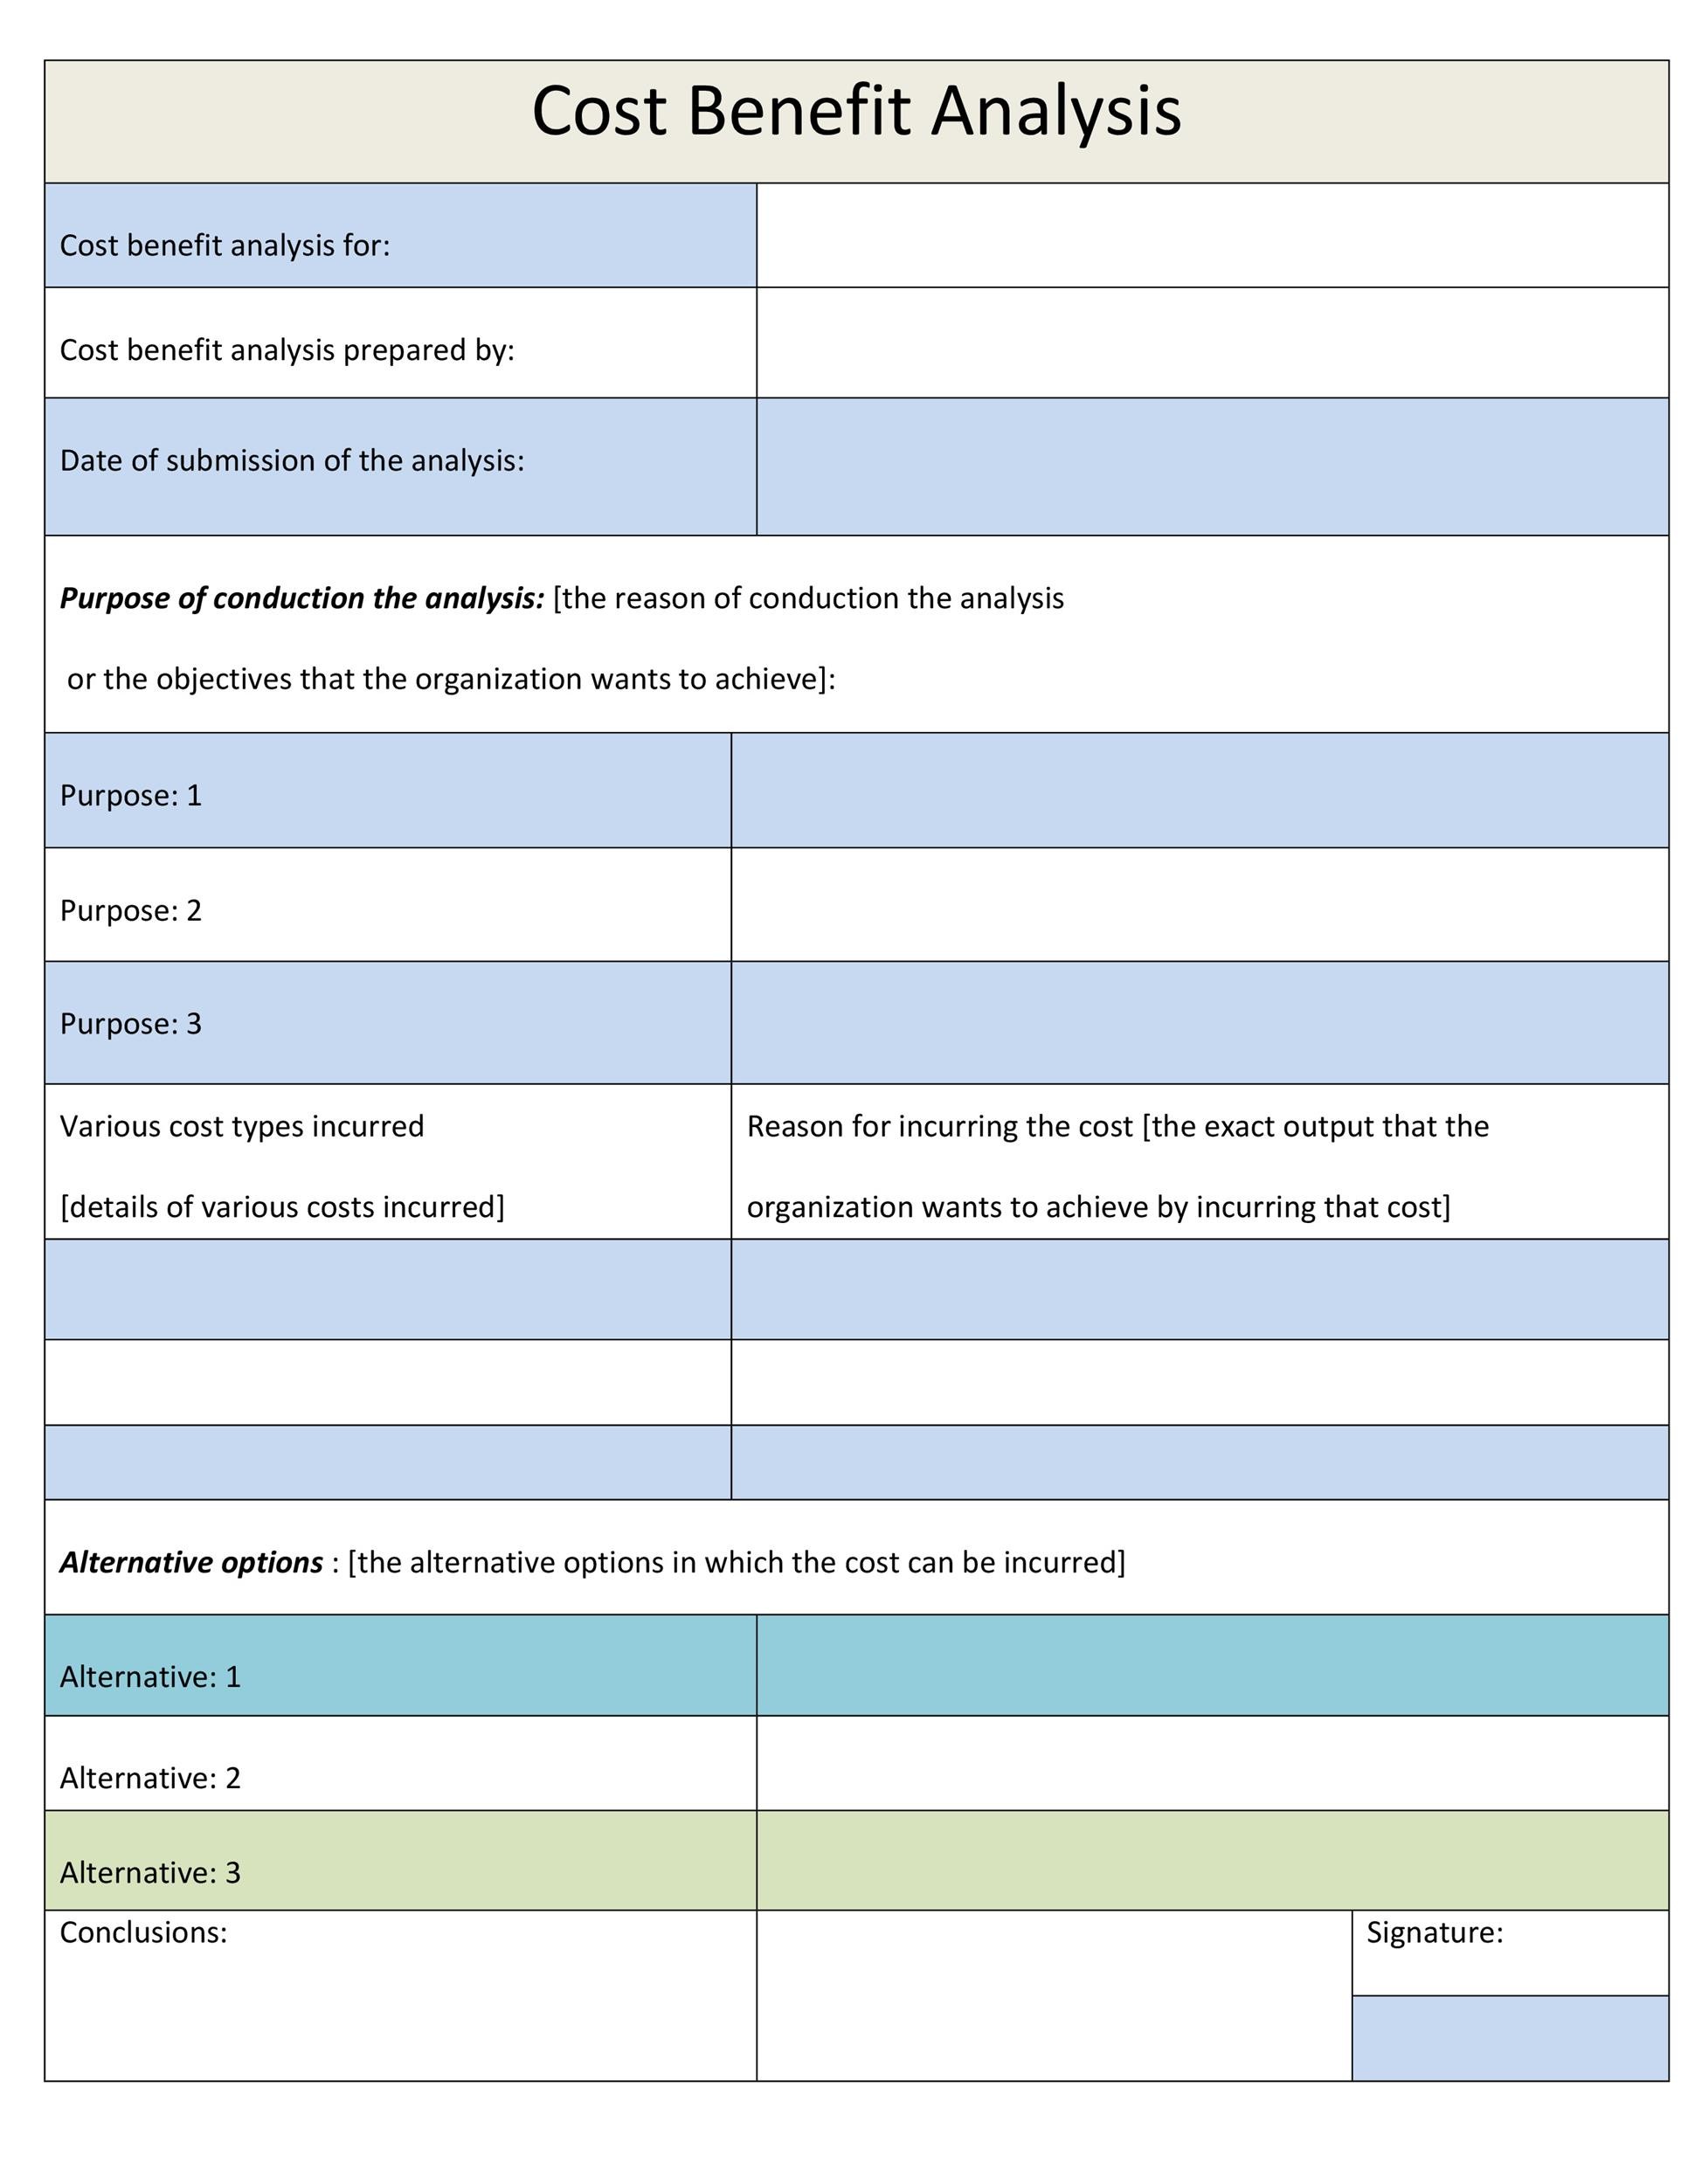
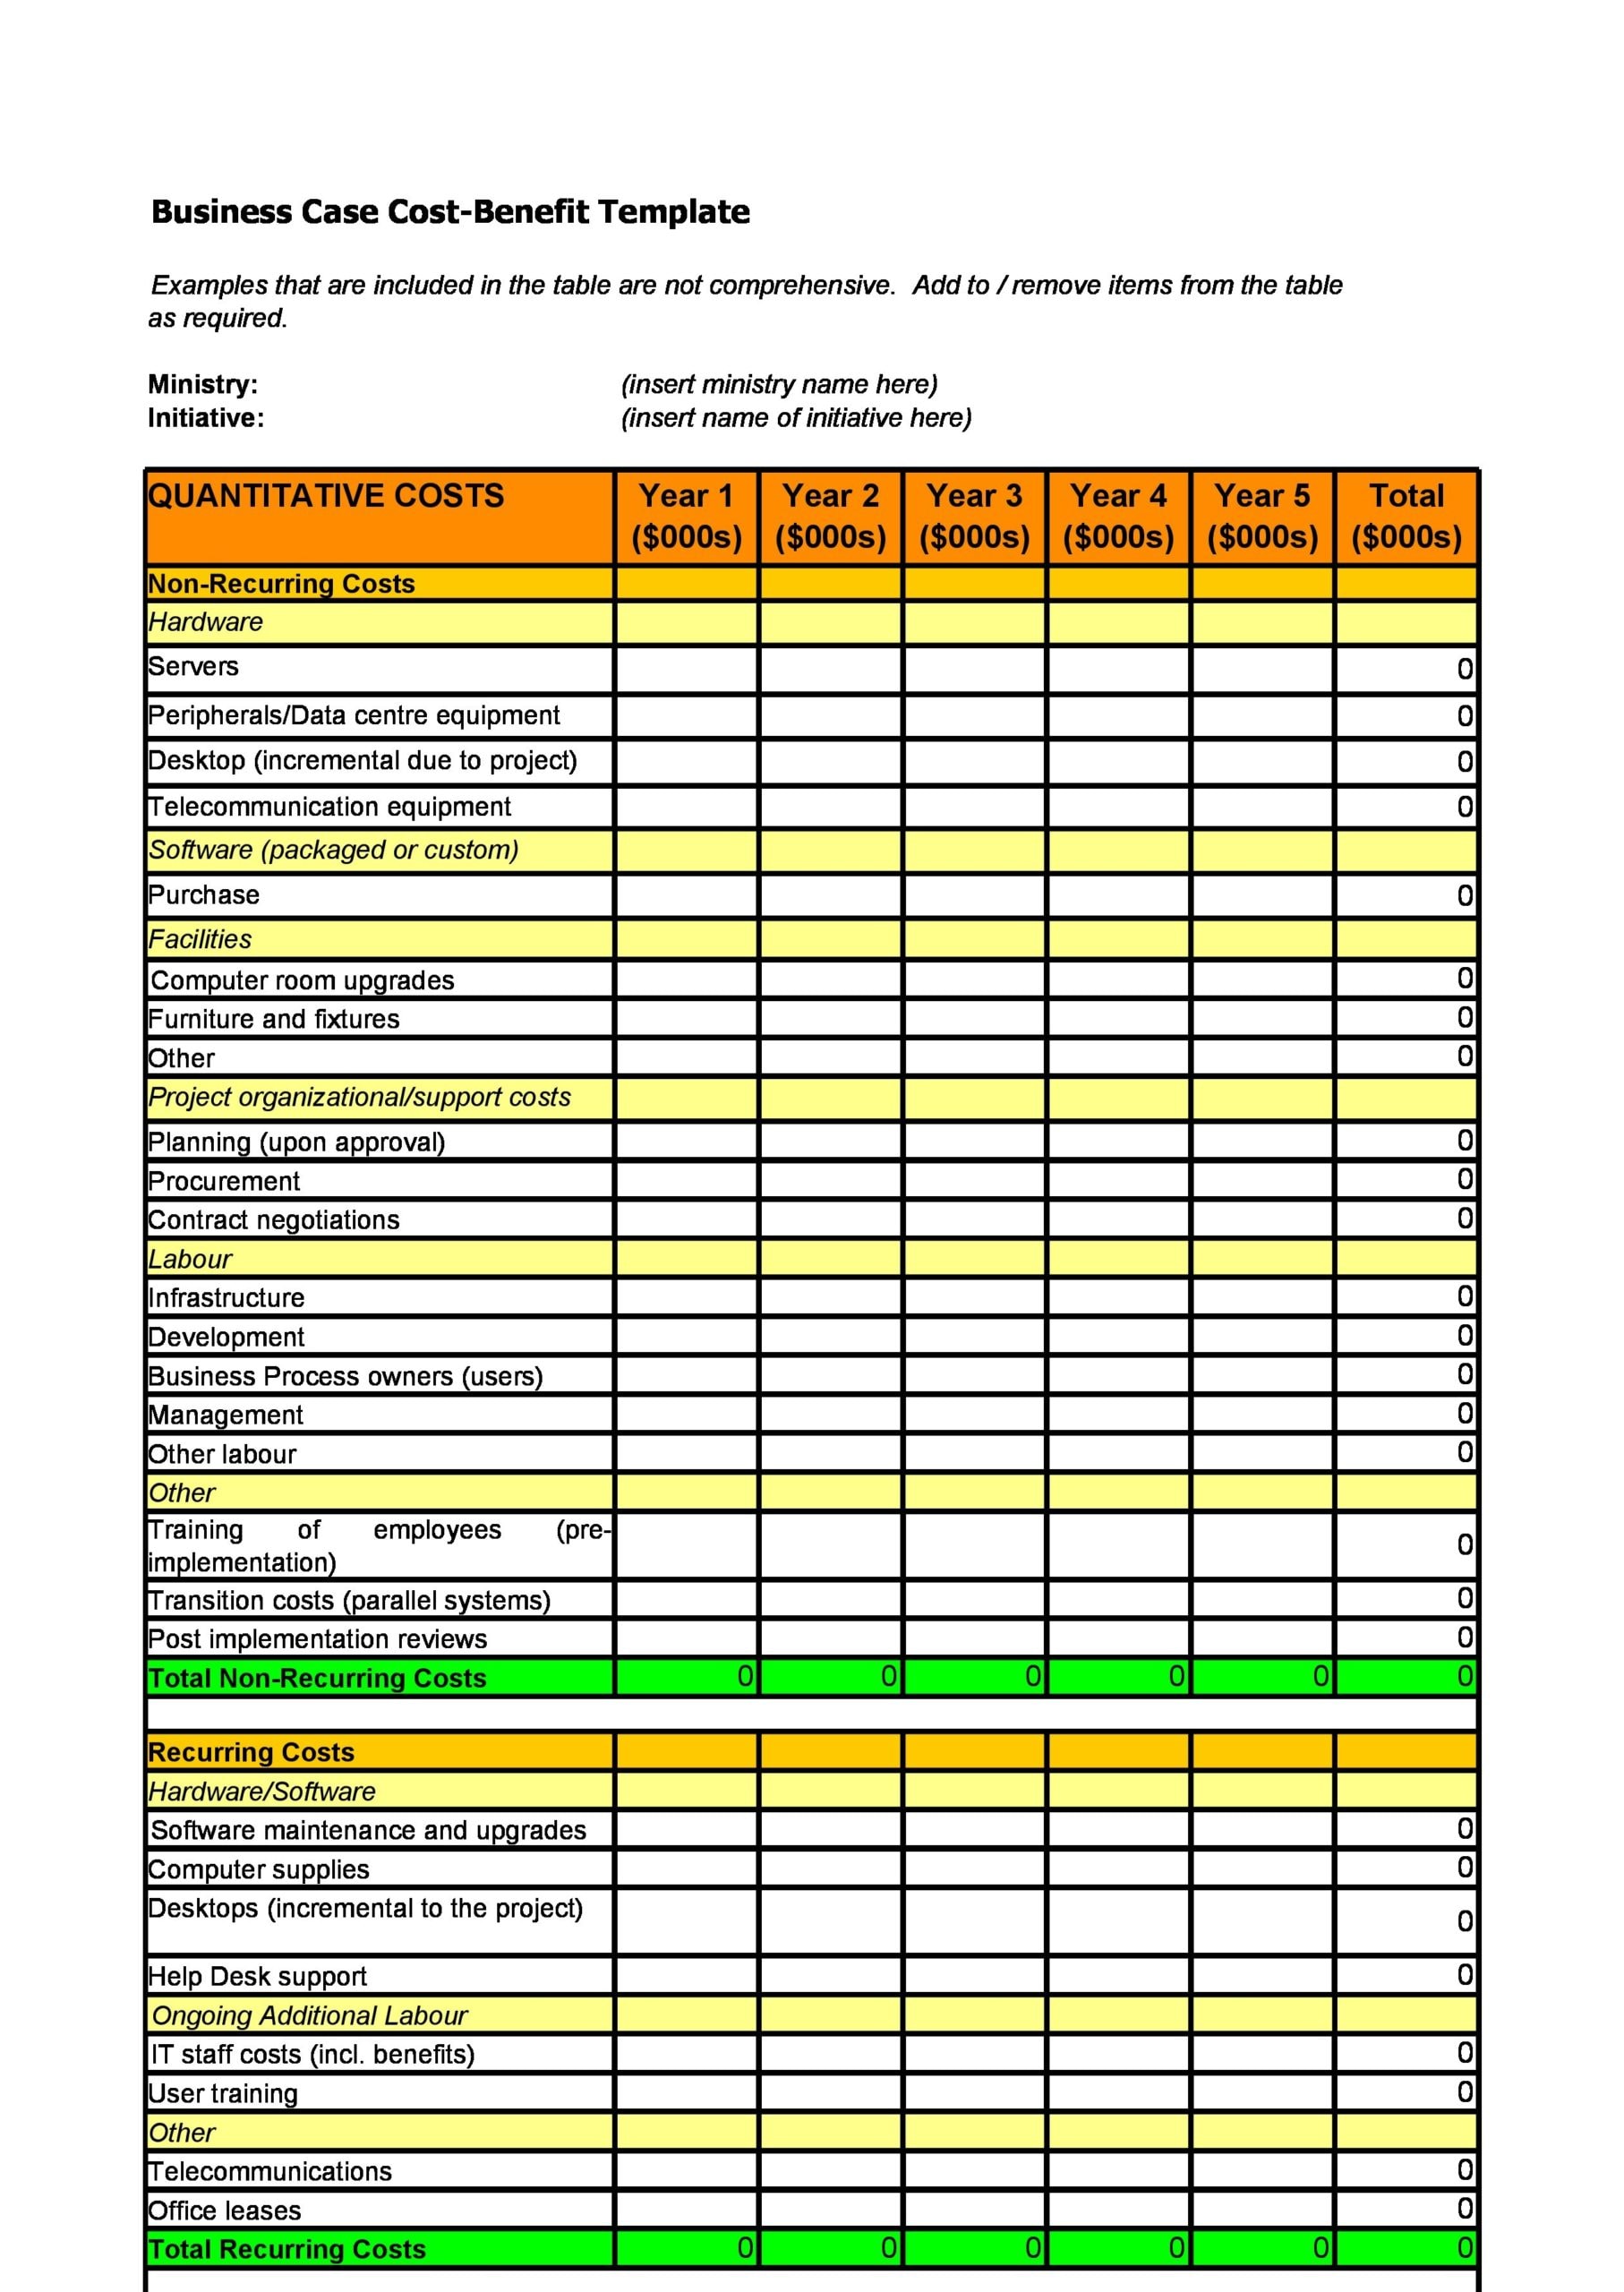
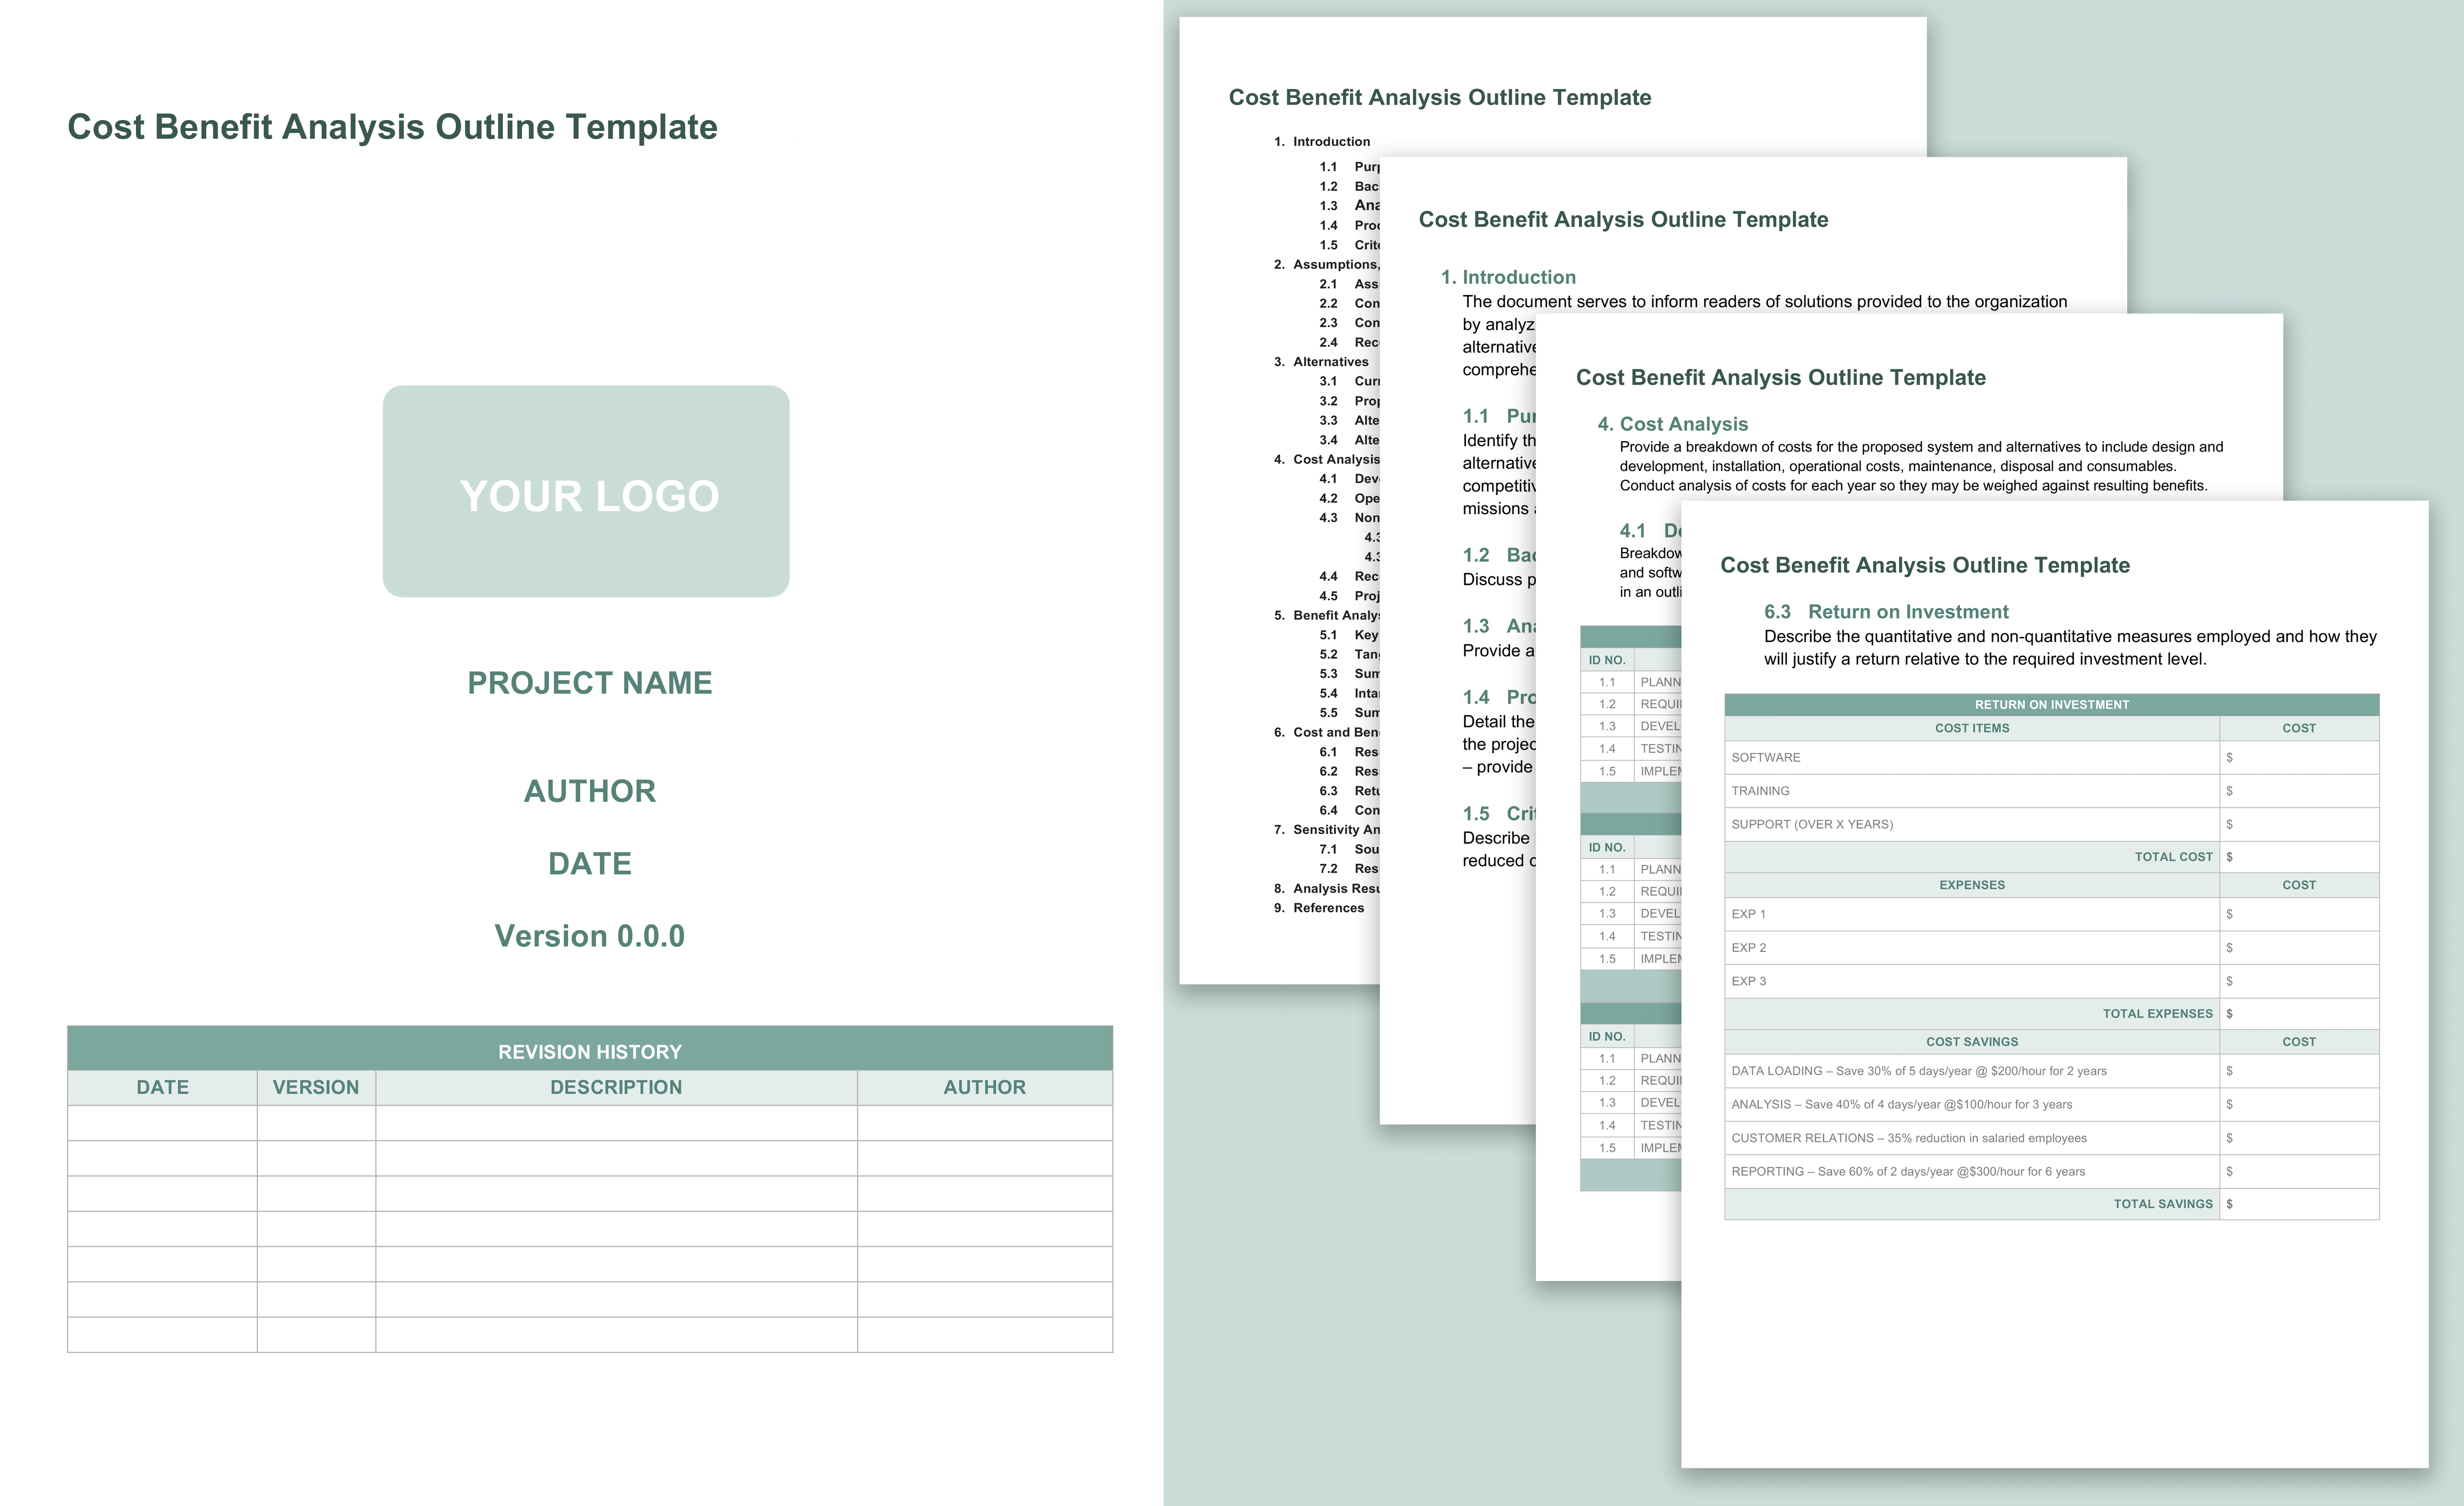
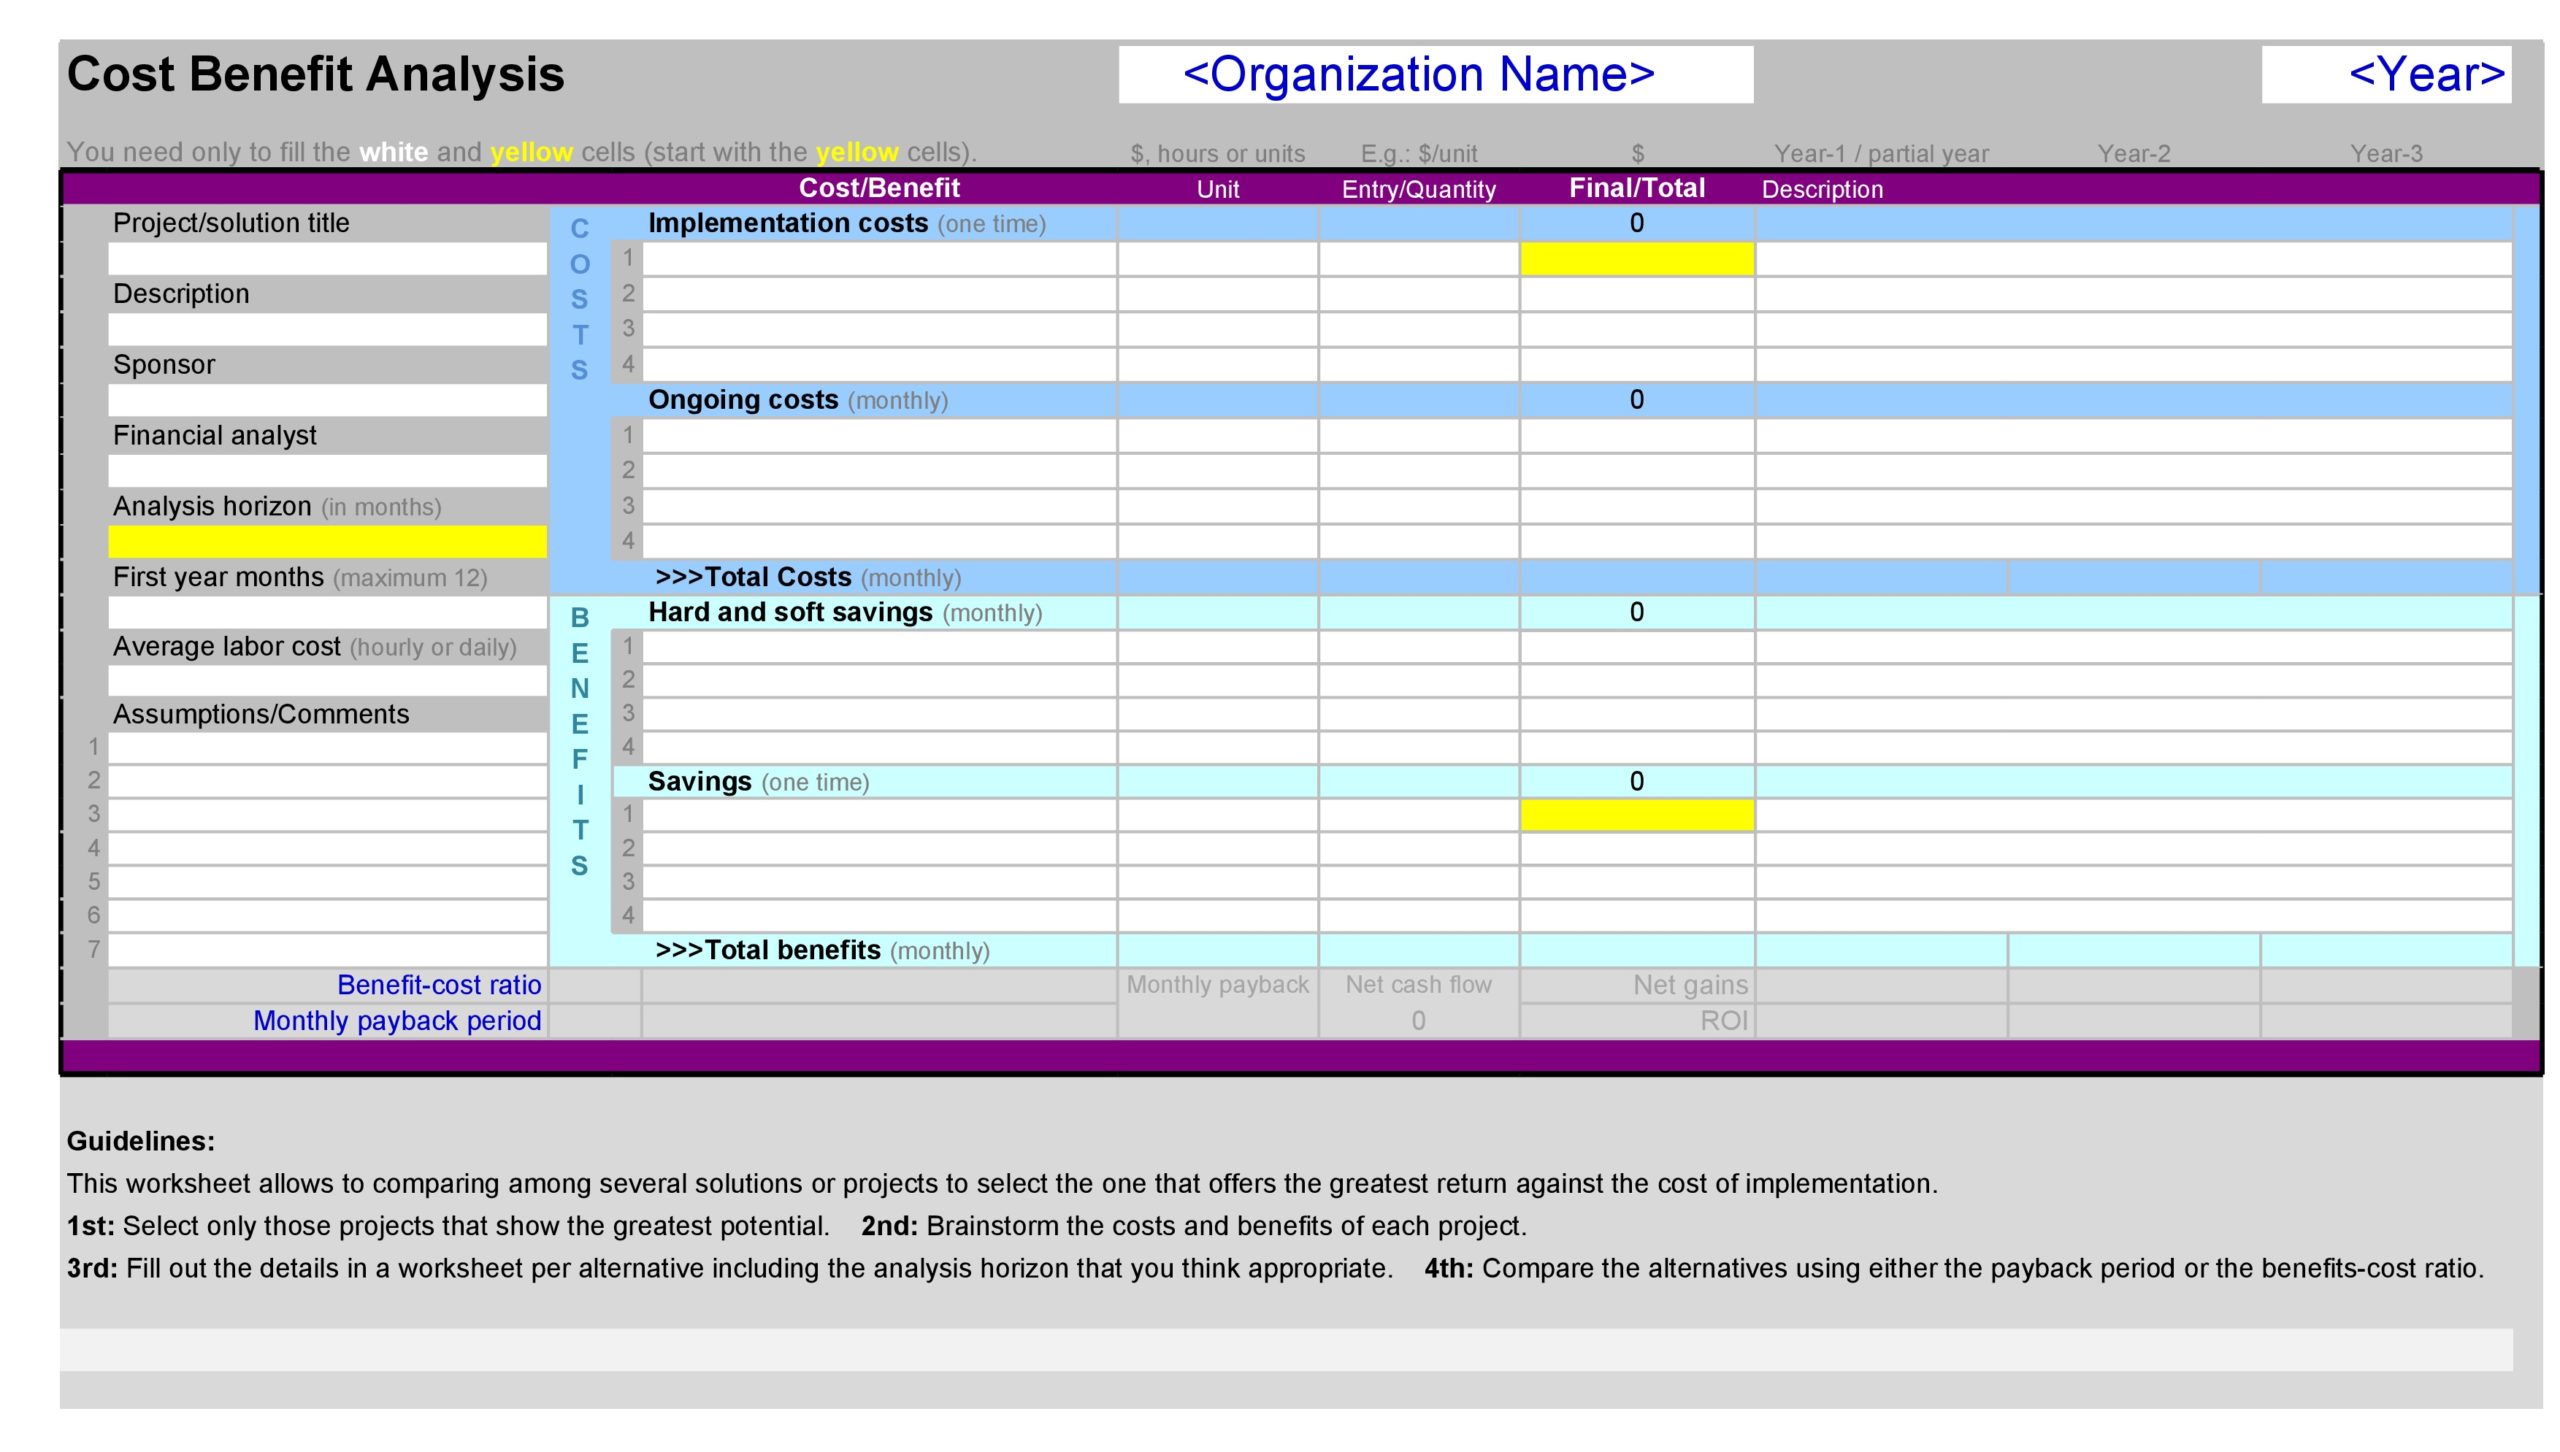
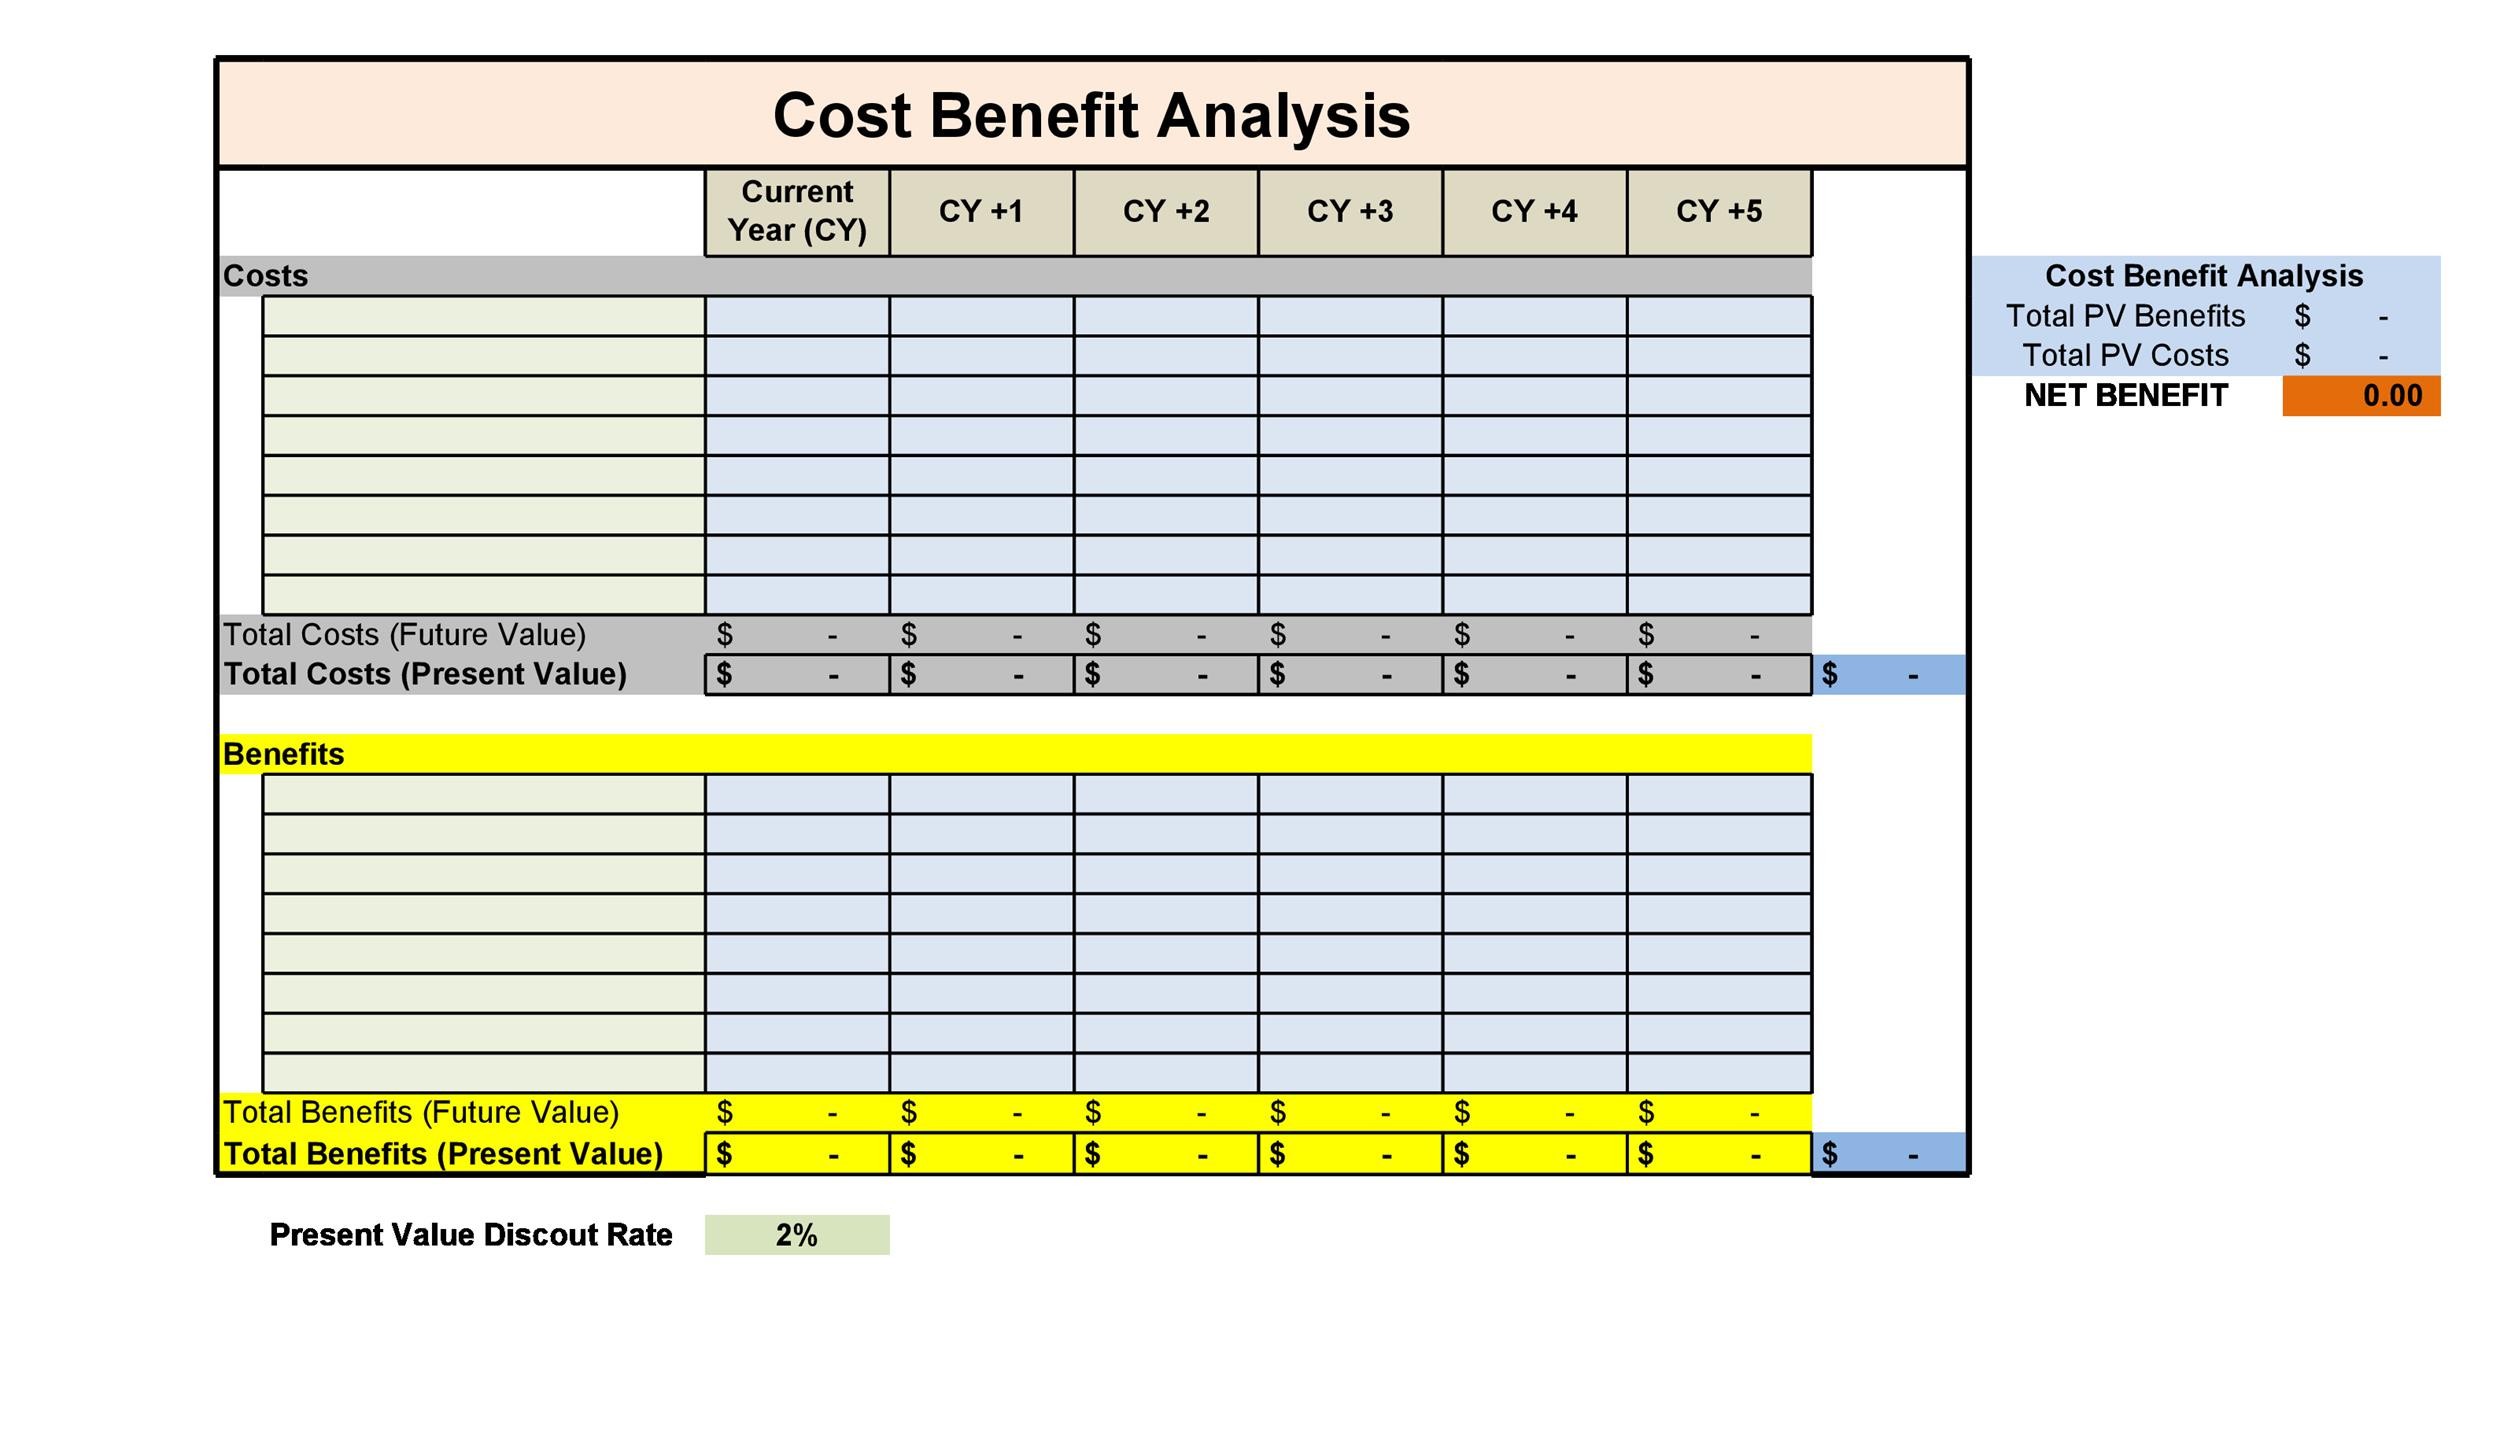
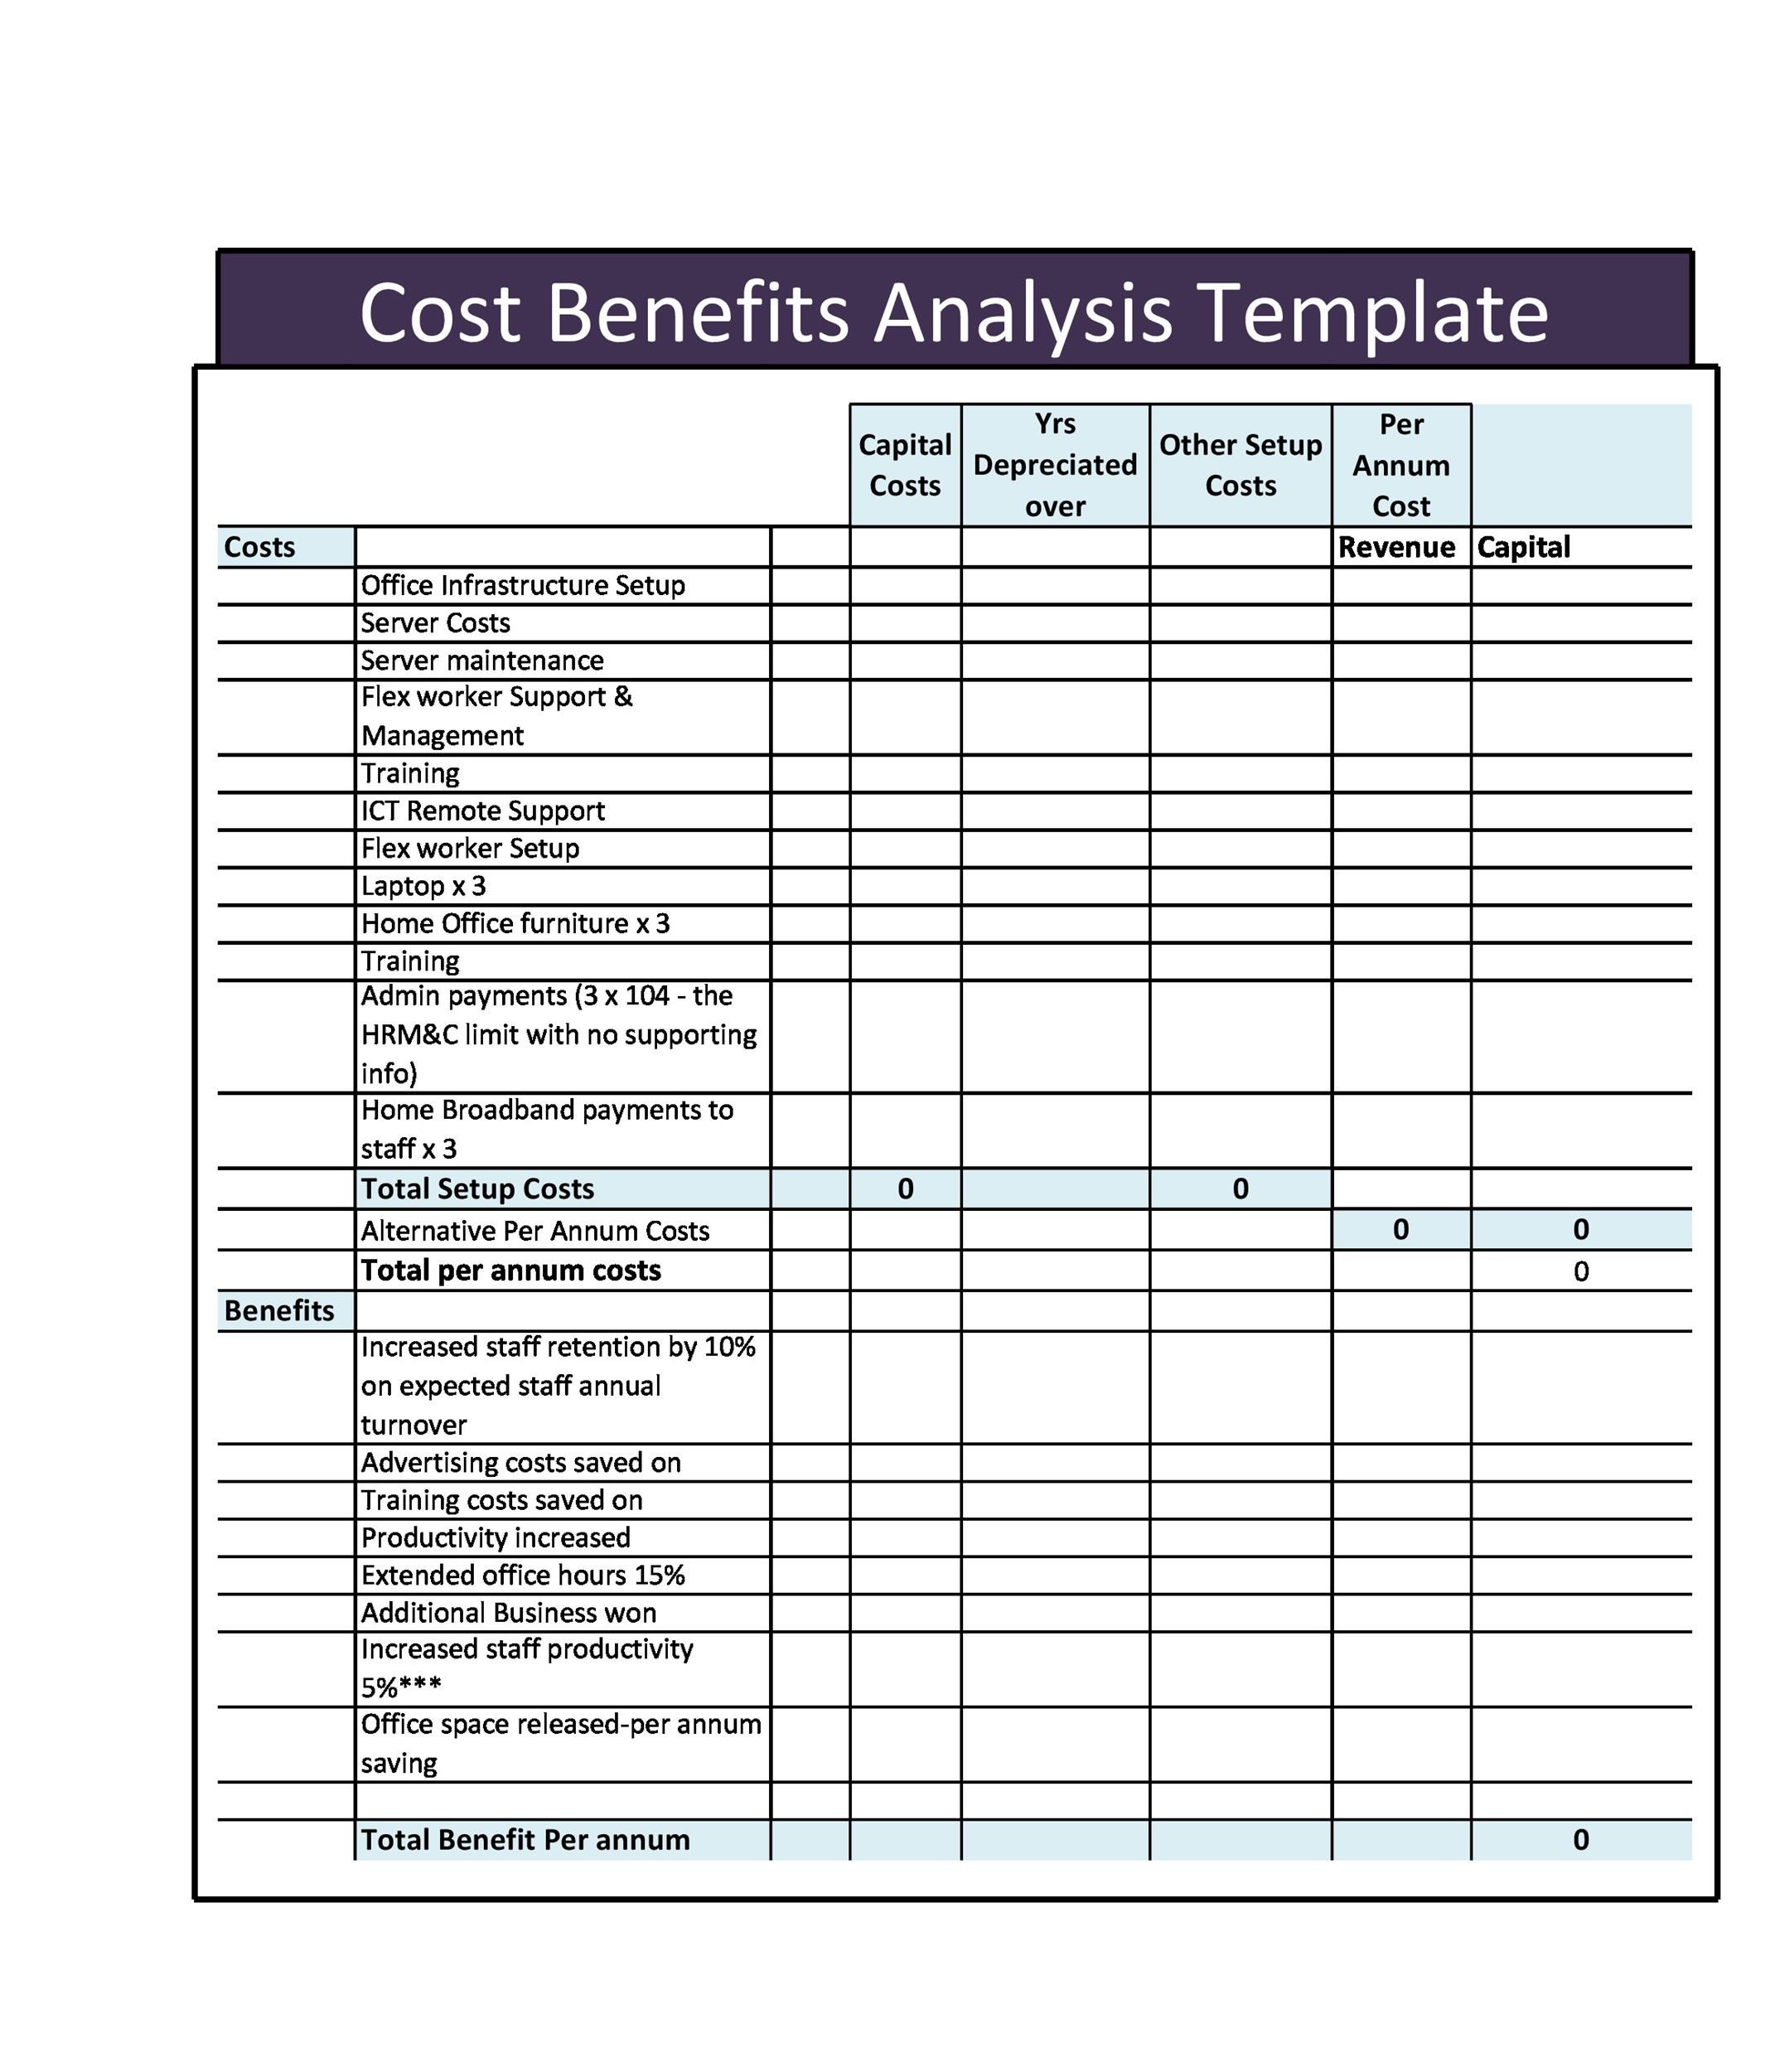
In Excel or Google Sheets, set up sections for:
- Project description and objective
- Benefit list with monetary estimates
- Cost list with detailed sub‑items
- Timeline and cash flow projection
- Discounting calculations (NPV, IRR)
- Sensitivity tables and charts
Use consistent formatting for headers, bolding totals, and highlighting key figures.
Step 4: Populate and Calculate
Insert your data and let the template perform the math. Use formulas for cumulative cash flow, present value, and profitability ratios. Double‑check for errors and ensure all cells reference the correct values.
Step 5: Review and Refine
Share the draft with stakeholders—finance teams, managers, and if appropriate, community representatives. Incorporate feedback, adjust assumptions, and iterate until consensus is reached. A collaborative review reflects the collective decision‑making culture prevalent in many Asian societies.
Real‑World Examples of CBA Applications
Case 1: A Solar Energy Initiative in Kerala
Local authorities evaluate installing rooftop solar panels in public schools. The template captures initial installation costs (~₹15 lakh), annual maintenance (~₹2 lakh), and energy savings (~₹4 lakh per year). Discounting over five years at 10% yields a net present value of approximately ₹12 lakh, justifying the investment. Sensitivity analysis shows that even if savings drop to 80%, the project remains profitable.
Case 2: Launching a Mobile Payment App in Japan
A fintech startup assesses developing a secure payment platform. Benefits include projected user growth (200,000 users in 2 years) and transaction revenue (¥5 crore). Costs encompass development (¥3 crore), marketing (¥1 crore), and compliance (¥0.5 crore). The NPV calculation suggests a positive return within 3 years, with a 25% internal rate of return. The team uses this CBA to secure investor confidence.
Case 3: Renovating a Heritage Building in Yangon
An NGO plans to convert a colonial-era structure into a community center. Benefits: cultural preservation, tourism revenue, and social cohesion. Costs: restoration labor, material sourcing, and ongoing maintenance. A sensitivity check demonstrates that securing heritage grants can reduce net cost by 30%, turning the project from marginally negative to slightly positive.
Common Pitfalls and How to Avoid Them
Overlooking Indirect Costs
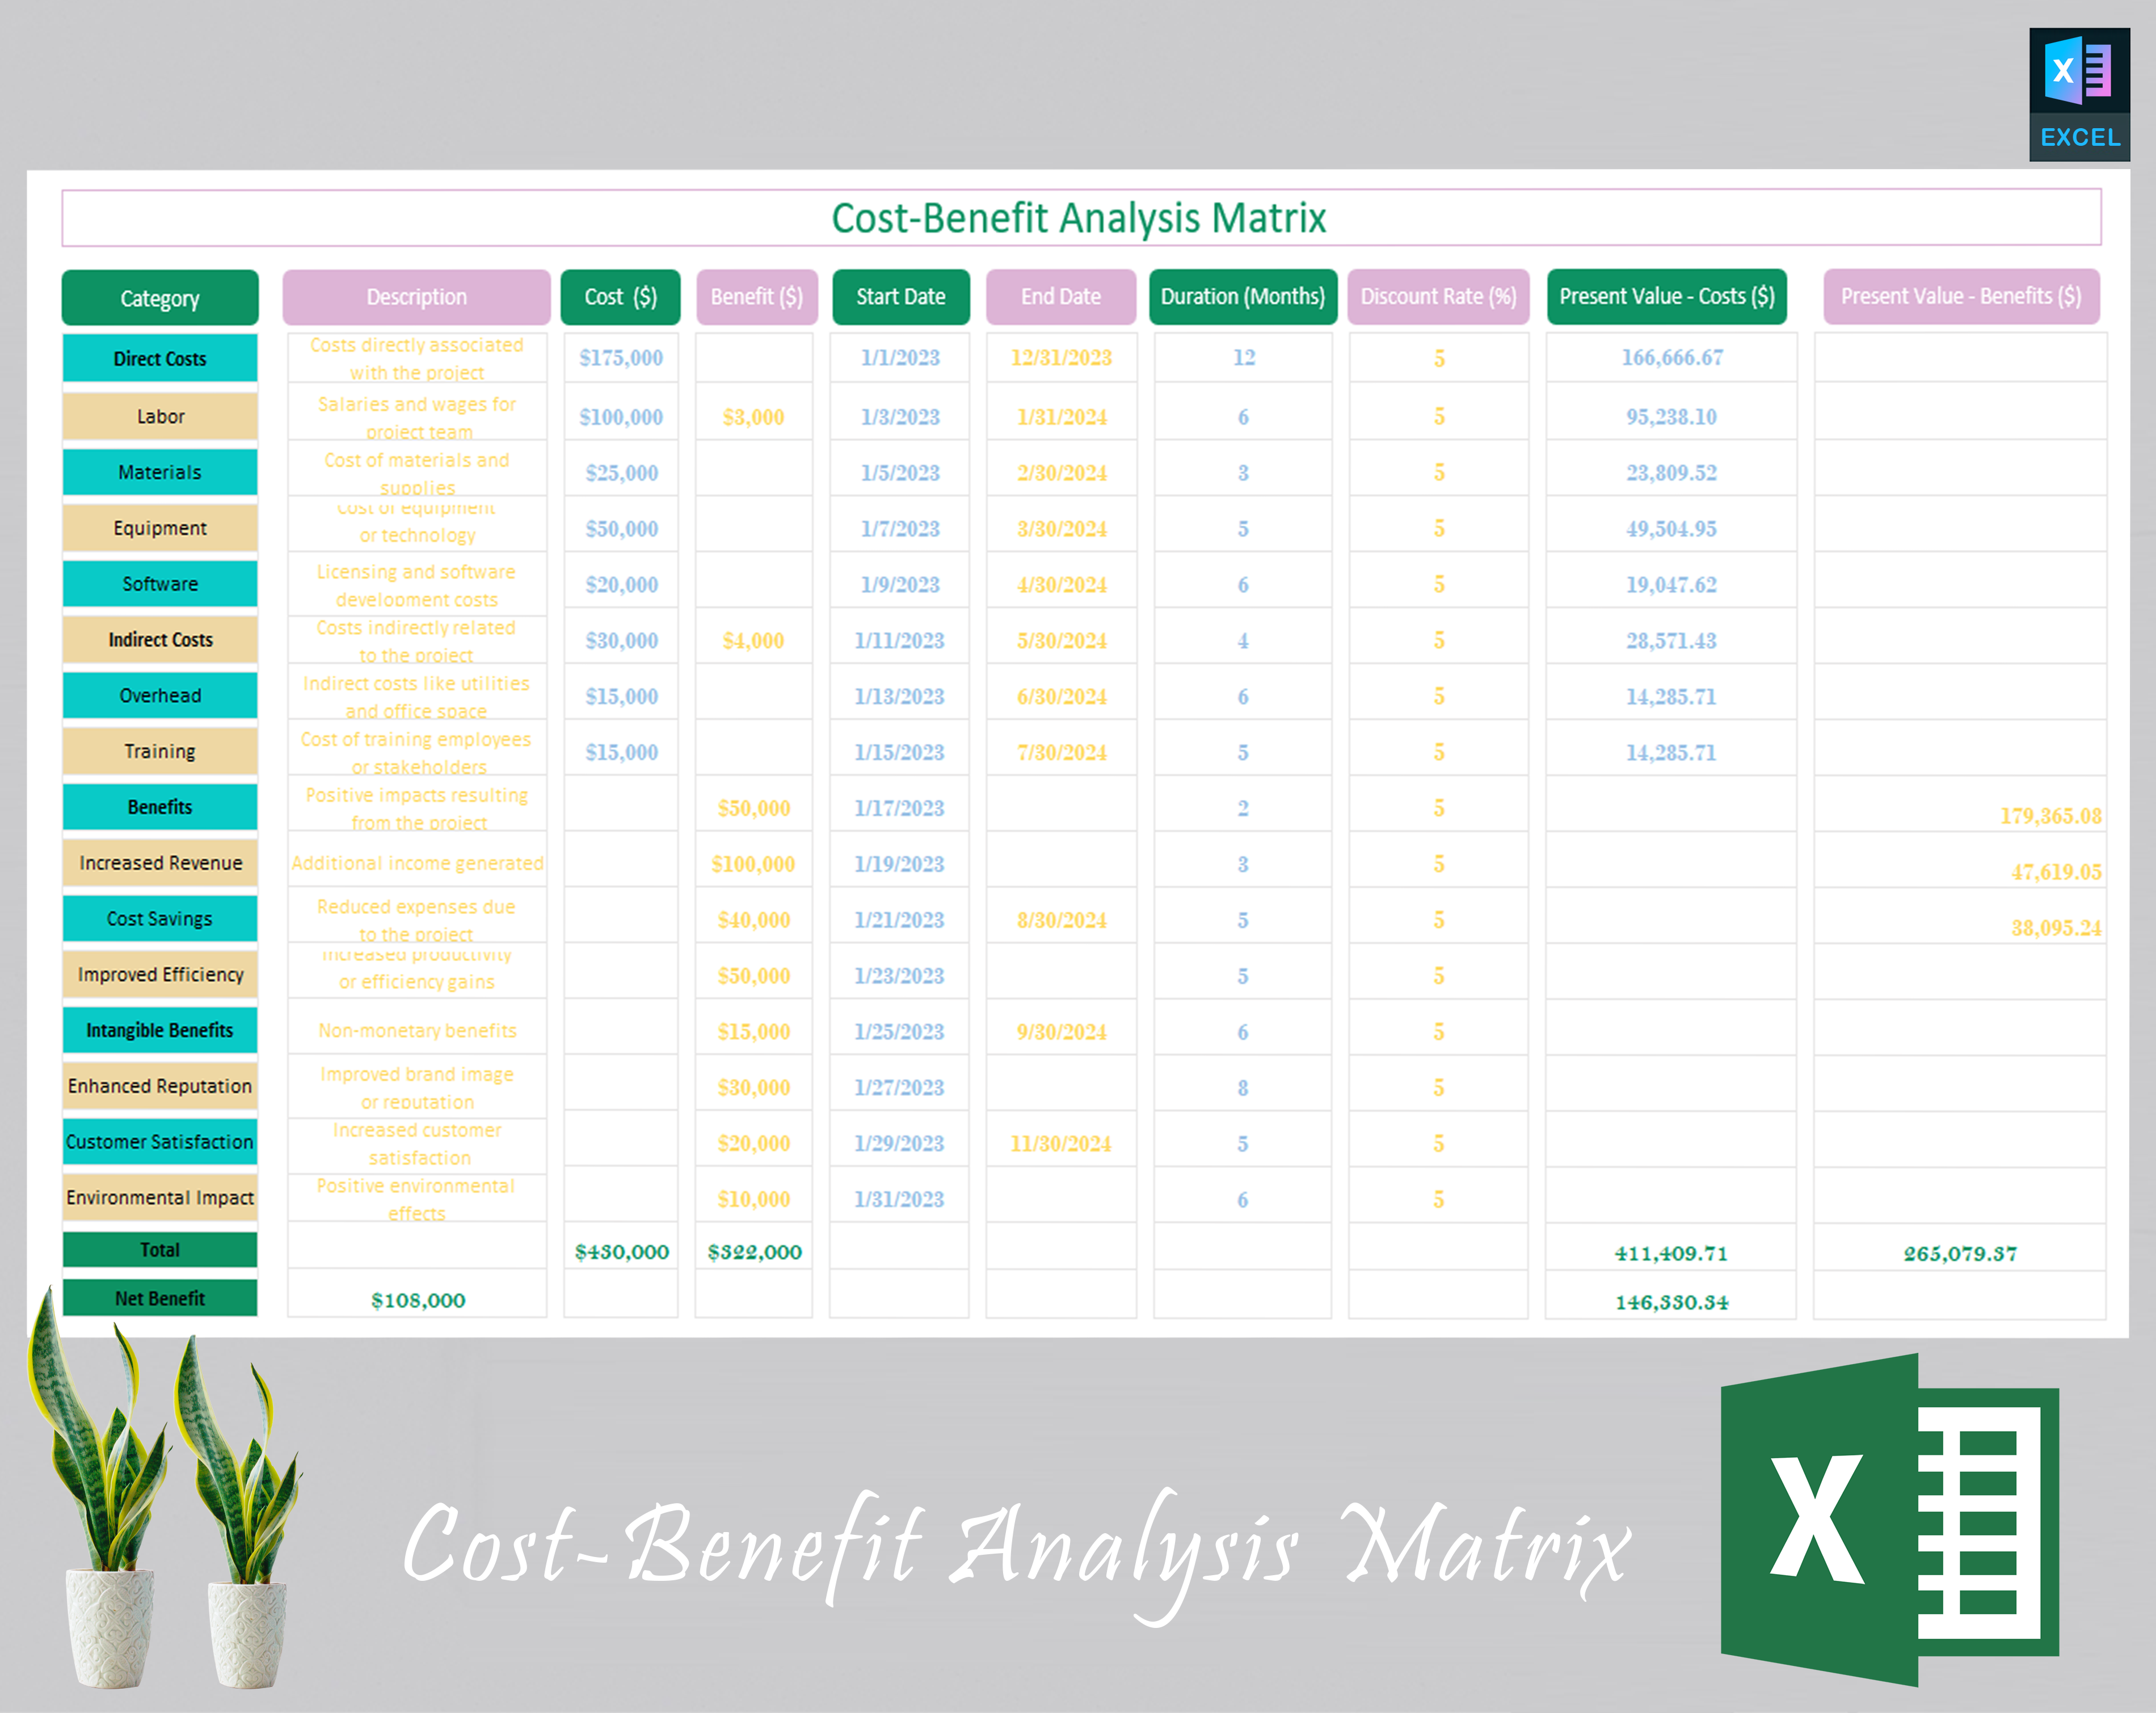
Hidden expenses like employee downtime during training or the loss of productivity during system rollout can skew results. Always list all indirect costs, no matter how small.
Assuming Static Market Conditions
Economic climates in Asia can shift rapidly due to trade policies or pandemics. Incorporate a range of market scenarios to remain agile.
Ignoring Cultural Factors
Quantitative data alone may overlook cultural acceptance or regulatory nuances. Integrate qualitative assessments—like community sentiment or political support—into the benefit section.
Using an Inflexible Template
Every project has unique attributes. Design your template to be modular so that you can add or remove rows and columns without breaking formulas.
Best Practices for Maintaining Your CBA Tool
- Update assumptions annually to reflect new data.
- Archive past analyses for benchmarking and learning.
- Train team members on Excel functions and data validation.
- Integrate with project management software for real‑time adjustments.
- Keep a backup in cloud storage for easy collaboration.
Leveraging Technology for More Accurate Analysis
Beyond traditional spreadsheets, consider specialized software like @Risk, Crystal Ball, or even custom dashboards built with Power BI. These tools offer Monte Carlo simulations, dynamic forecasting, and visual storytelling—elements that resonate well with stakeholders accustomed to data‑rich presentations.
Conclusion
By embracing a meticulous Example Cost Benefit Analysis Template, decision makers in Asia can navigate complex projects with clarity, honor cultural values of harmony and foresight, and secure tangible returns. Whether you’re assessing a high‑tech venture, a public infrastructure plan, or a simple household upgrade, the structured approach outlined above ensures that every dollar invested is weighed against every potential benefit, leading to smarter, more sustainable outcomes.

Related posts of "Example Cost Benefit Analysis Template"
