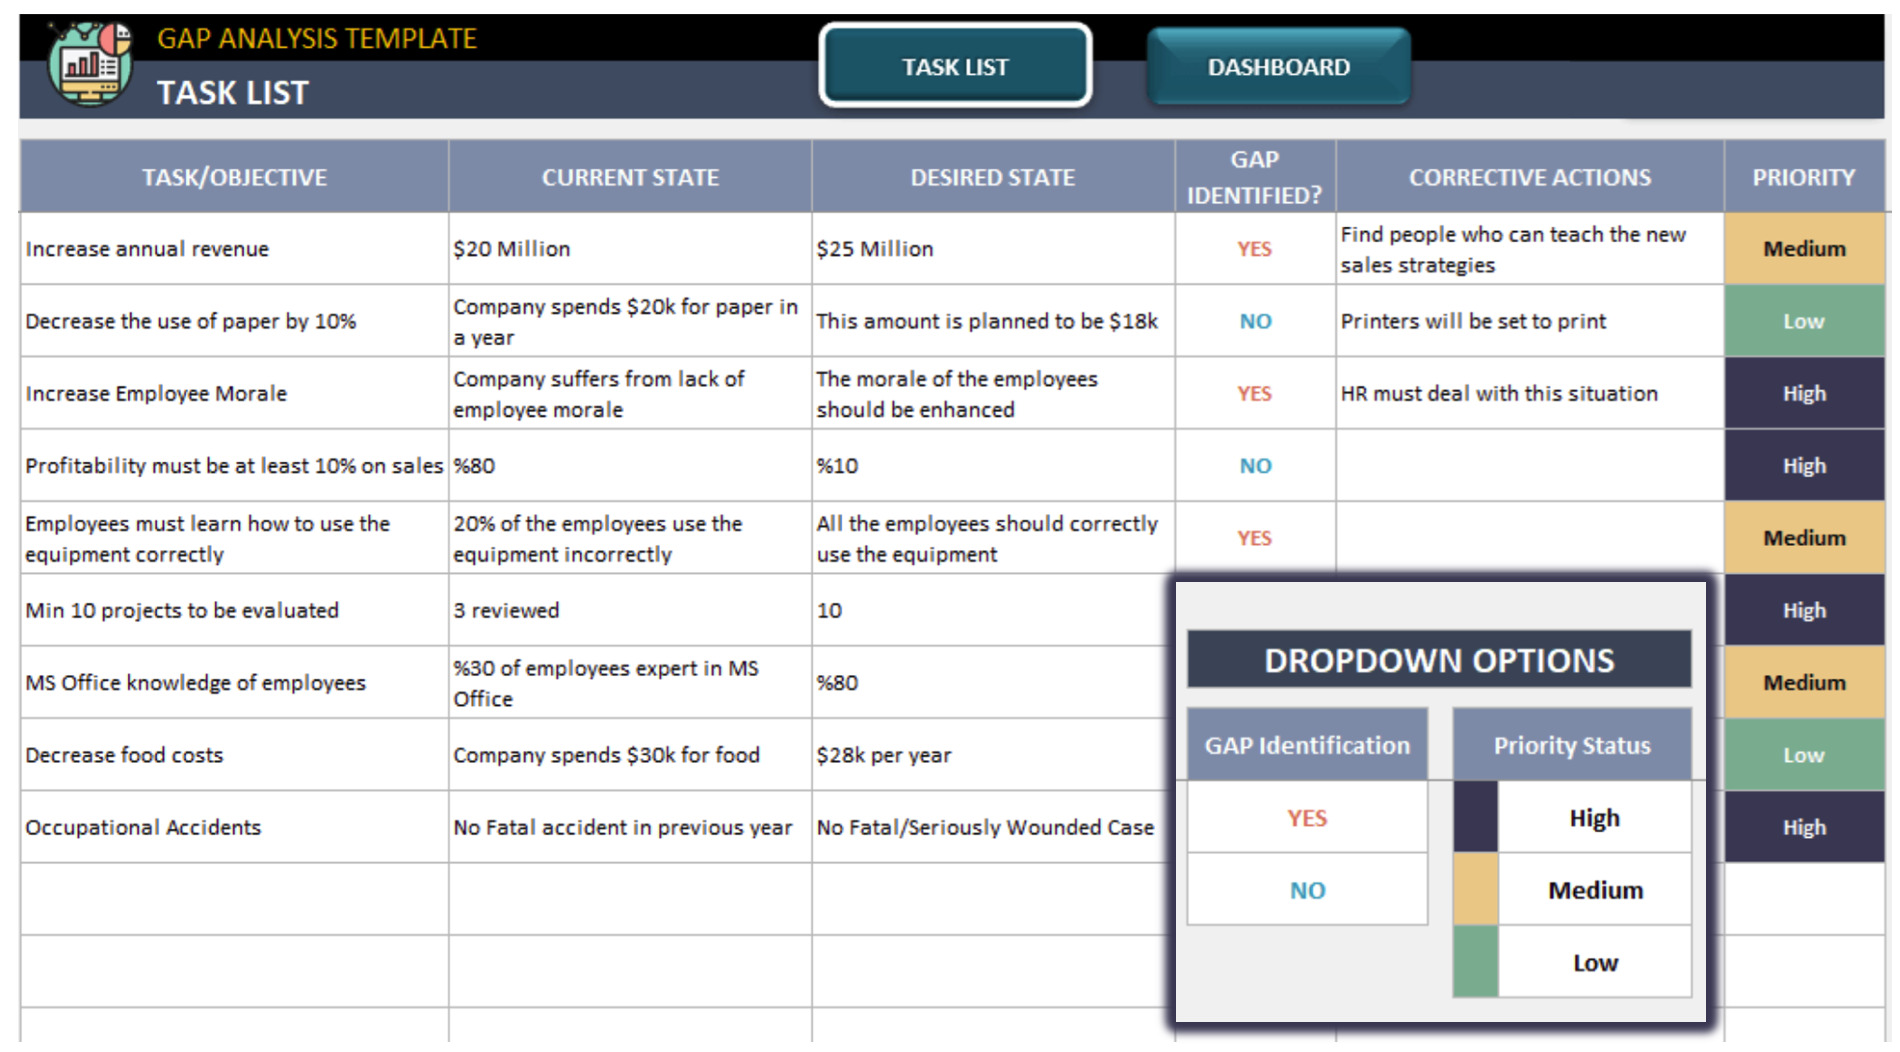
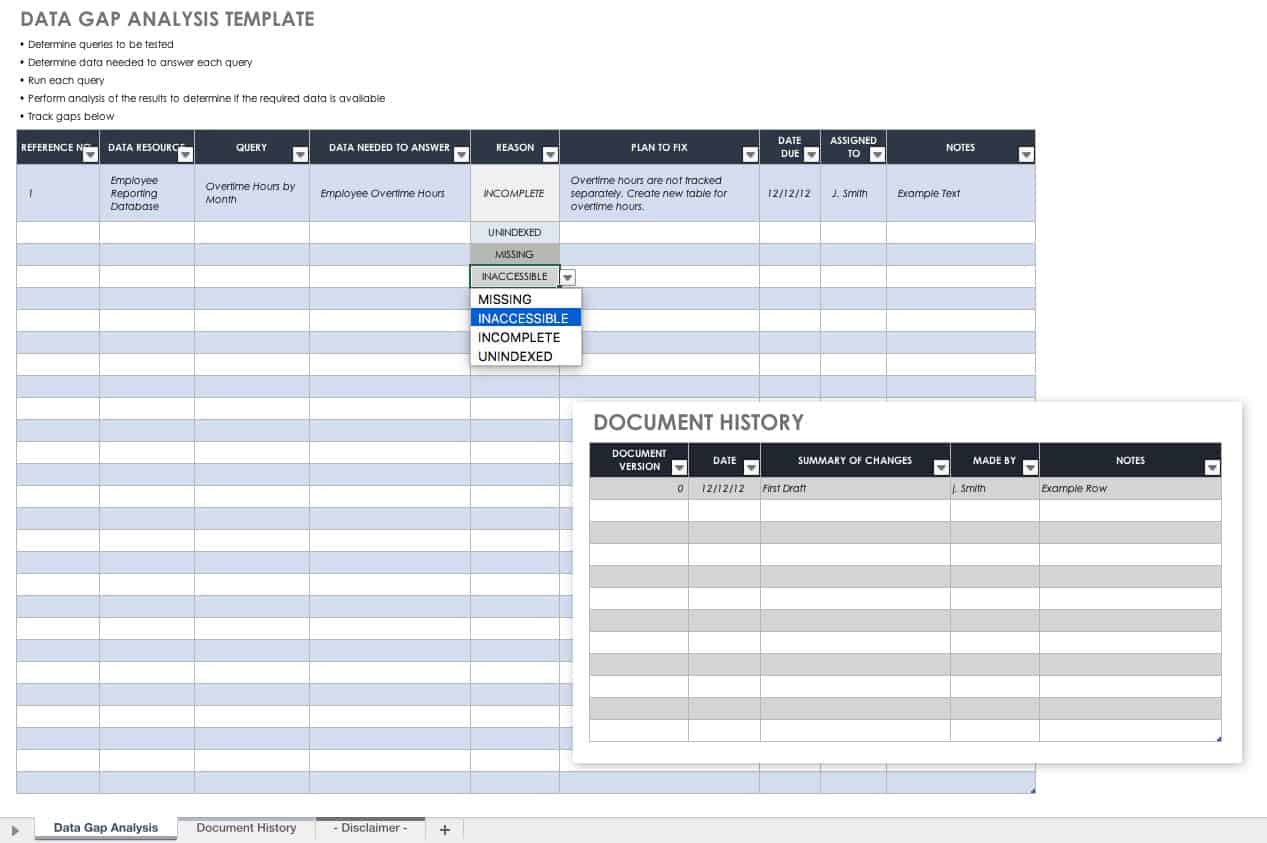
Data Gap Analysis Template Excel is your new best friend in the world of spreadsheets, turning the dreaded data voids into a playground of opportunities. Imagine a spreadsheet that not only shows you where your data is missing but does so with a wink and a chuckle, making the audit process feel less like a chore and more like a comedy improv session.
What Is a Data Gap Analysis?

A data gap analysis is a systematic review that identifies missing, incomplete, or inaccurate data in a dataset. Think of it as a detective story where the suspect is the absence of information. By pinpointing gaps, organizations can prioritize data cleansing, allocate resources efficiently, and ensure decision-making is based on complete, reliable information.
Why Your Spreadsheet Needs a Laugh
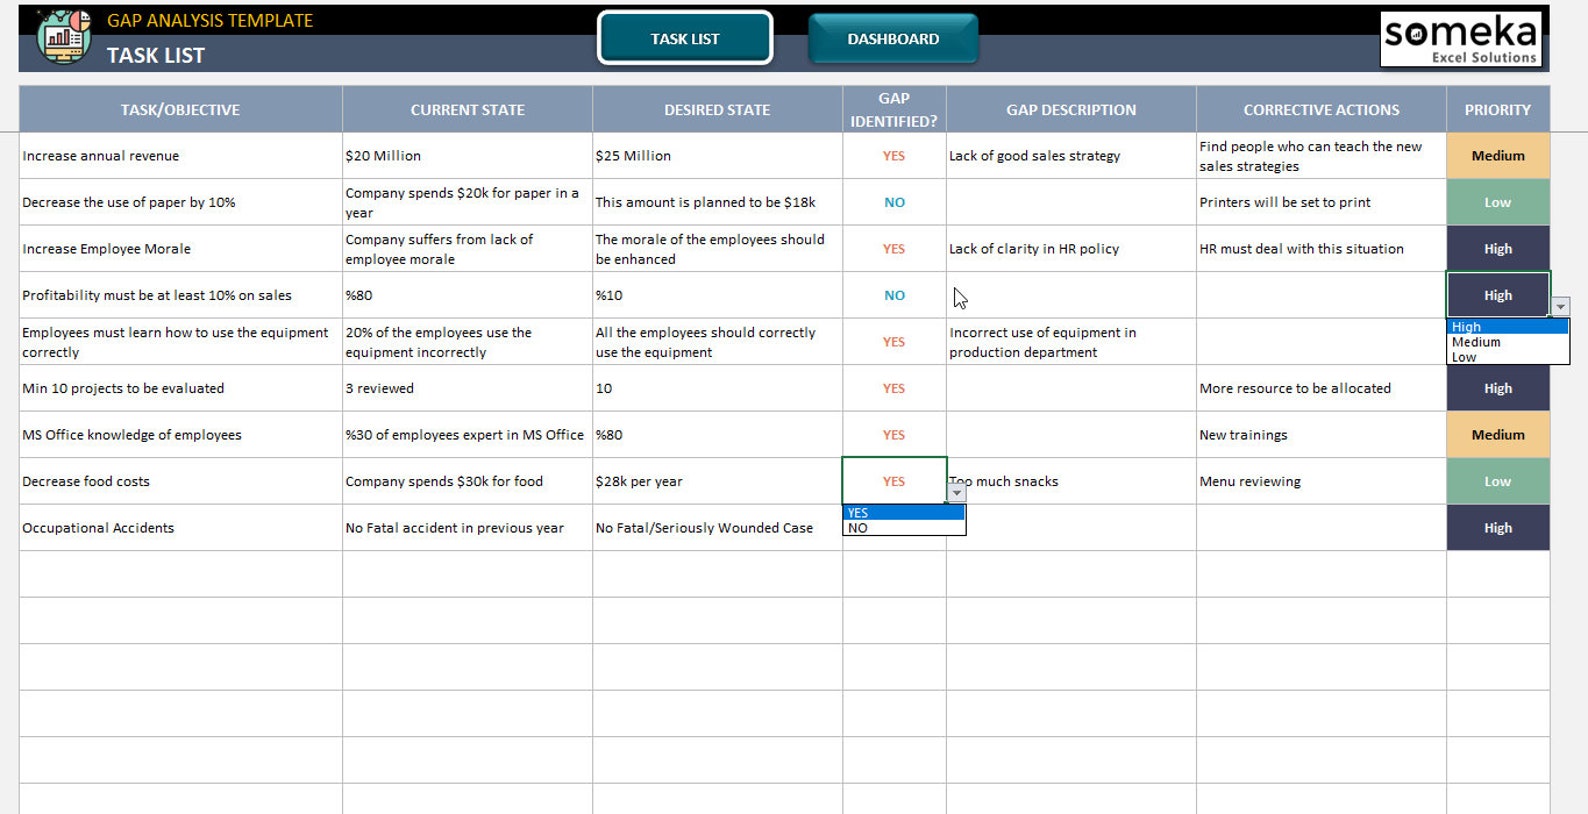
Spreadsheets are notorious for being as fun as a tax audit. Adding a humorous spin does more than entertain—it keeps stakeholders engaged and reduces the anxiety that usually accompanies data reviews. When you turn a dry audit into a lighthearted exercise, people are more willing to invest time in the process and will remember your findings long after the spreadsheet closes.
Building Your Own Excel Template from Scratch
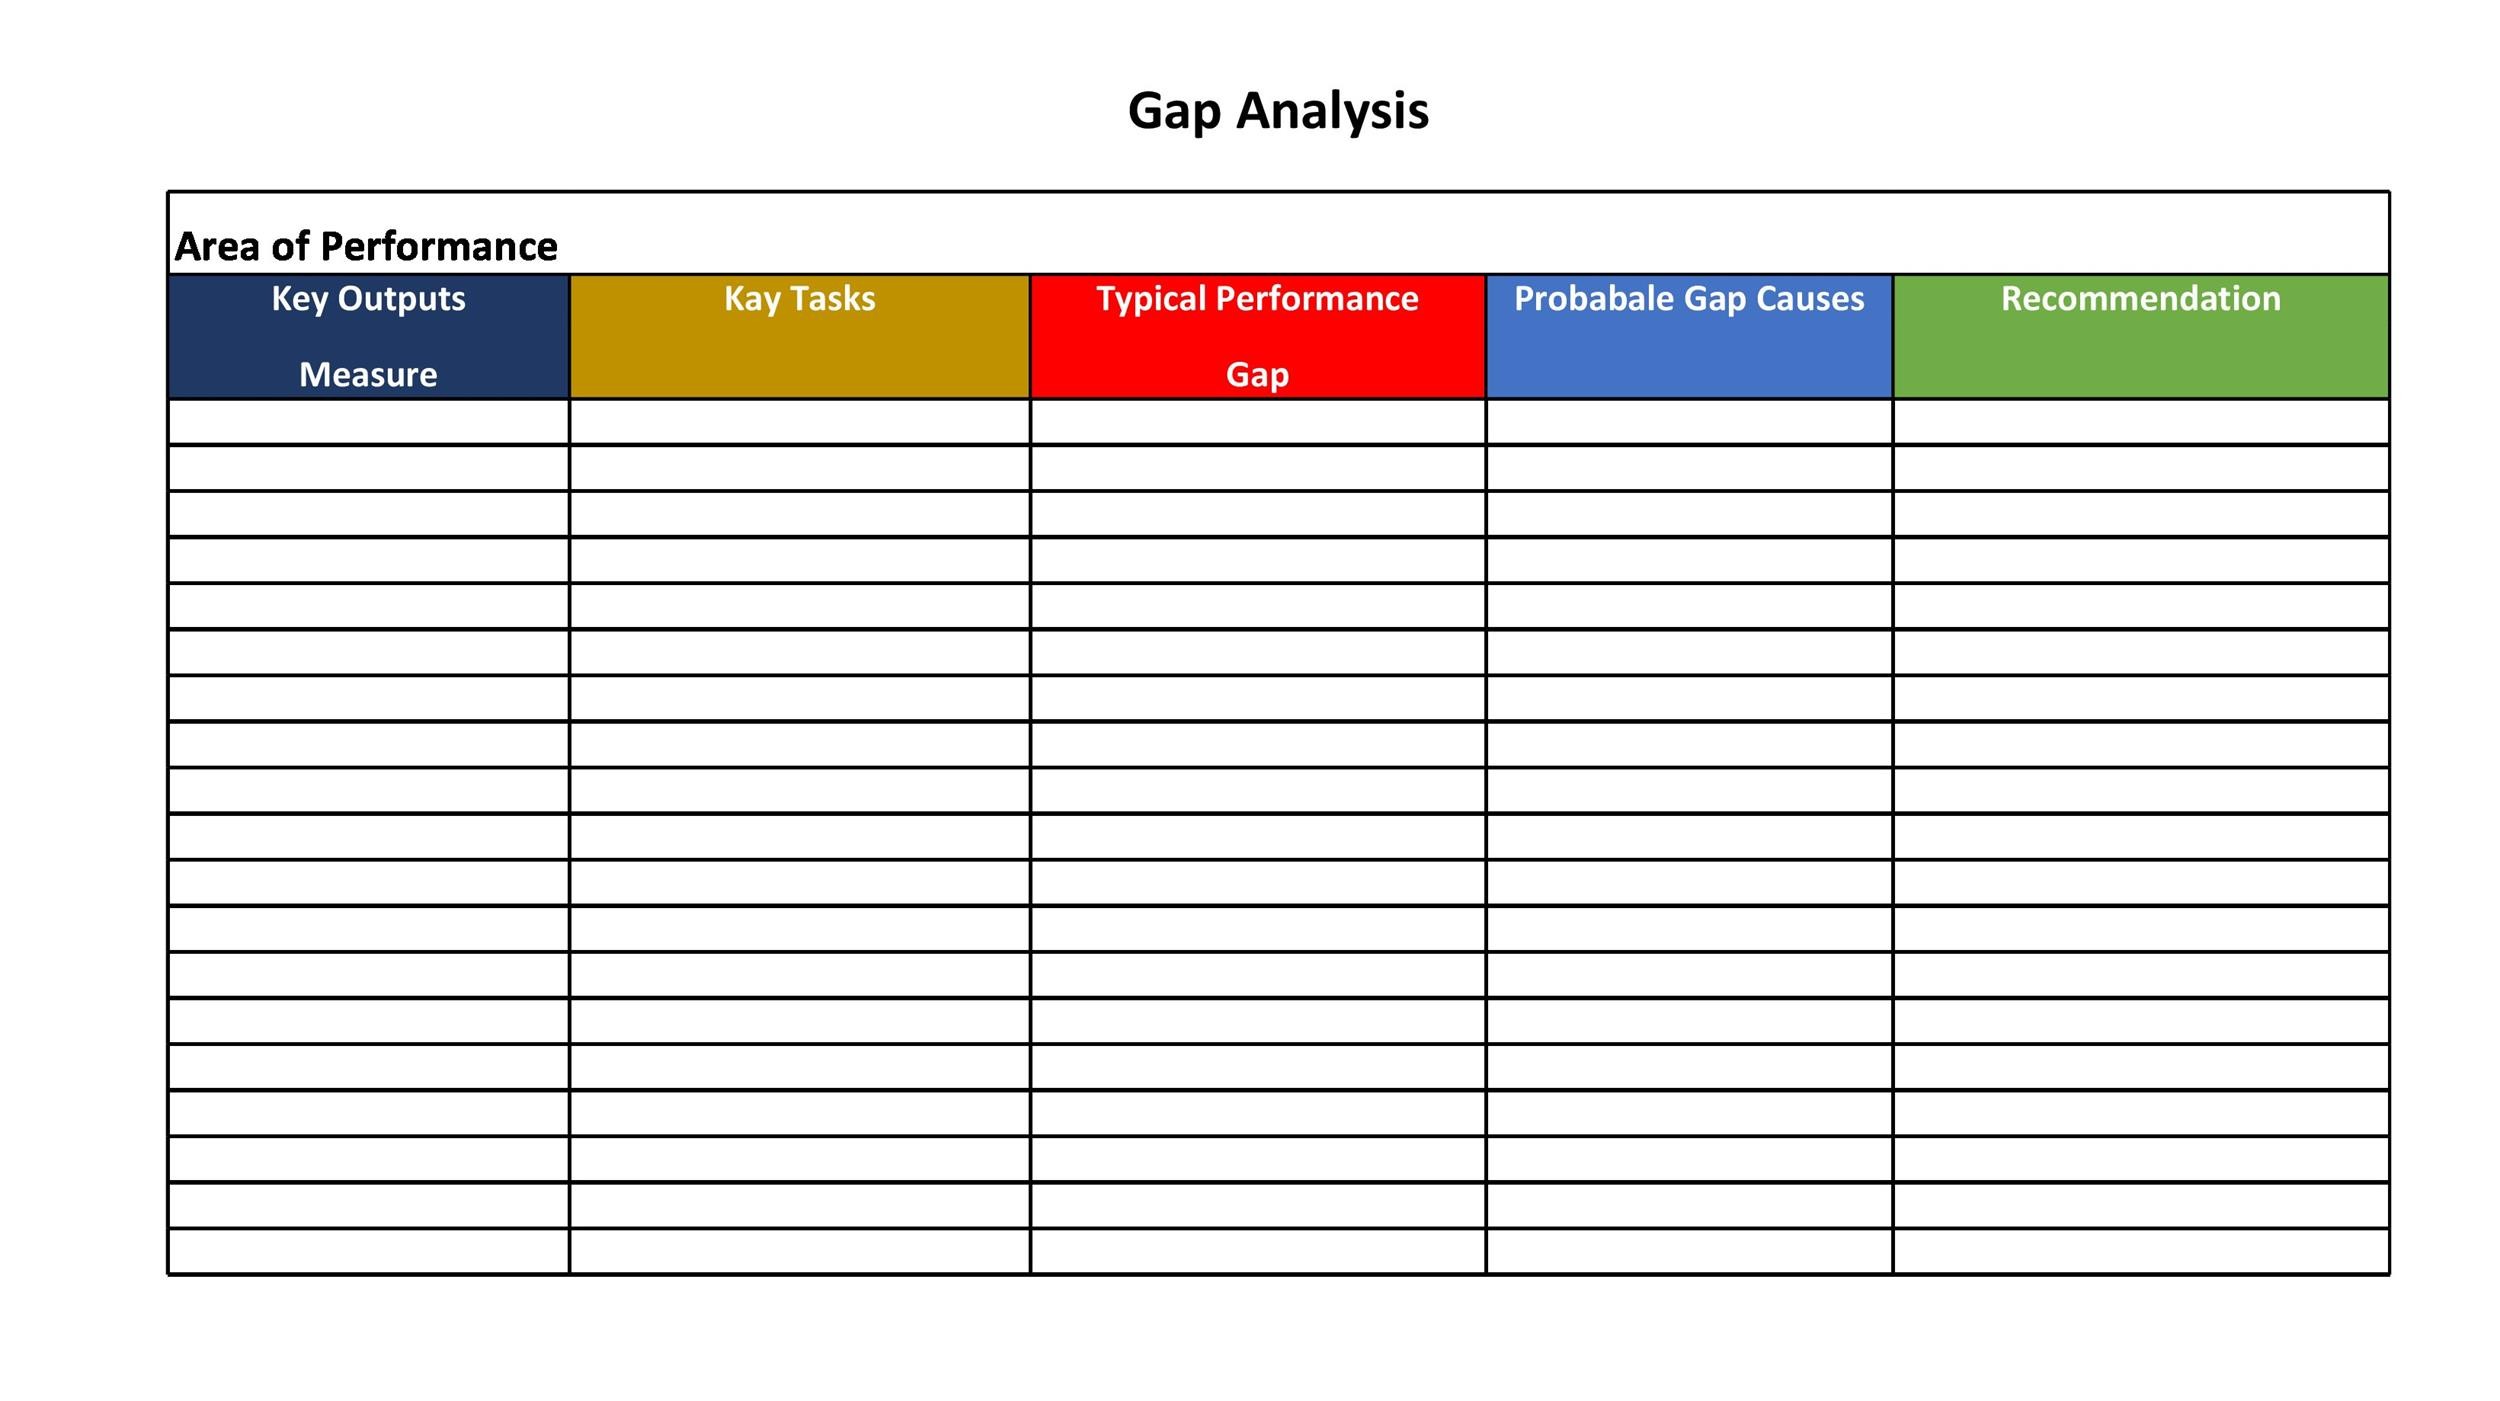
Step 1 – Define the Problem
Start with a clear question: What data do we need that we don’t have? List the key data points that are critical to your analysis or reporting. For example, a marketing team might need customer age, purchase frequency, and preferred channel. Write these out in a column labeled Required Field. Keep the list short—only the data that genuinely impacts decisions.
Step 2 – Gather the Data
Pull in all available data sources. Whether you’re scraping CSV files, connecting to a database, or manually copying from a CRM, bring everything into a single worksheet. Label each source in a column called Source to track where the data originates.
Step 3 – Create the Gap Matrix
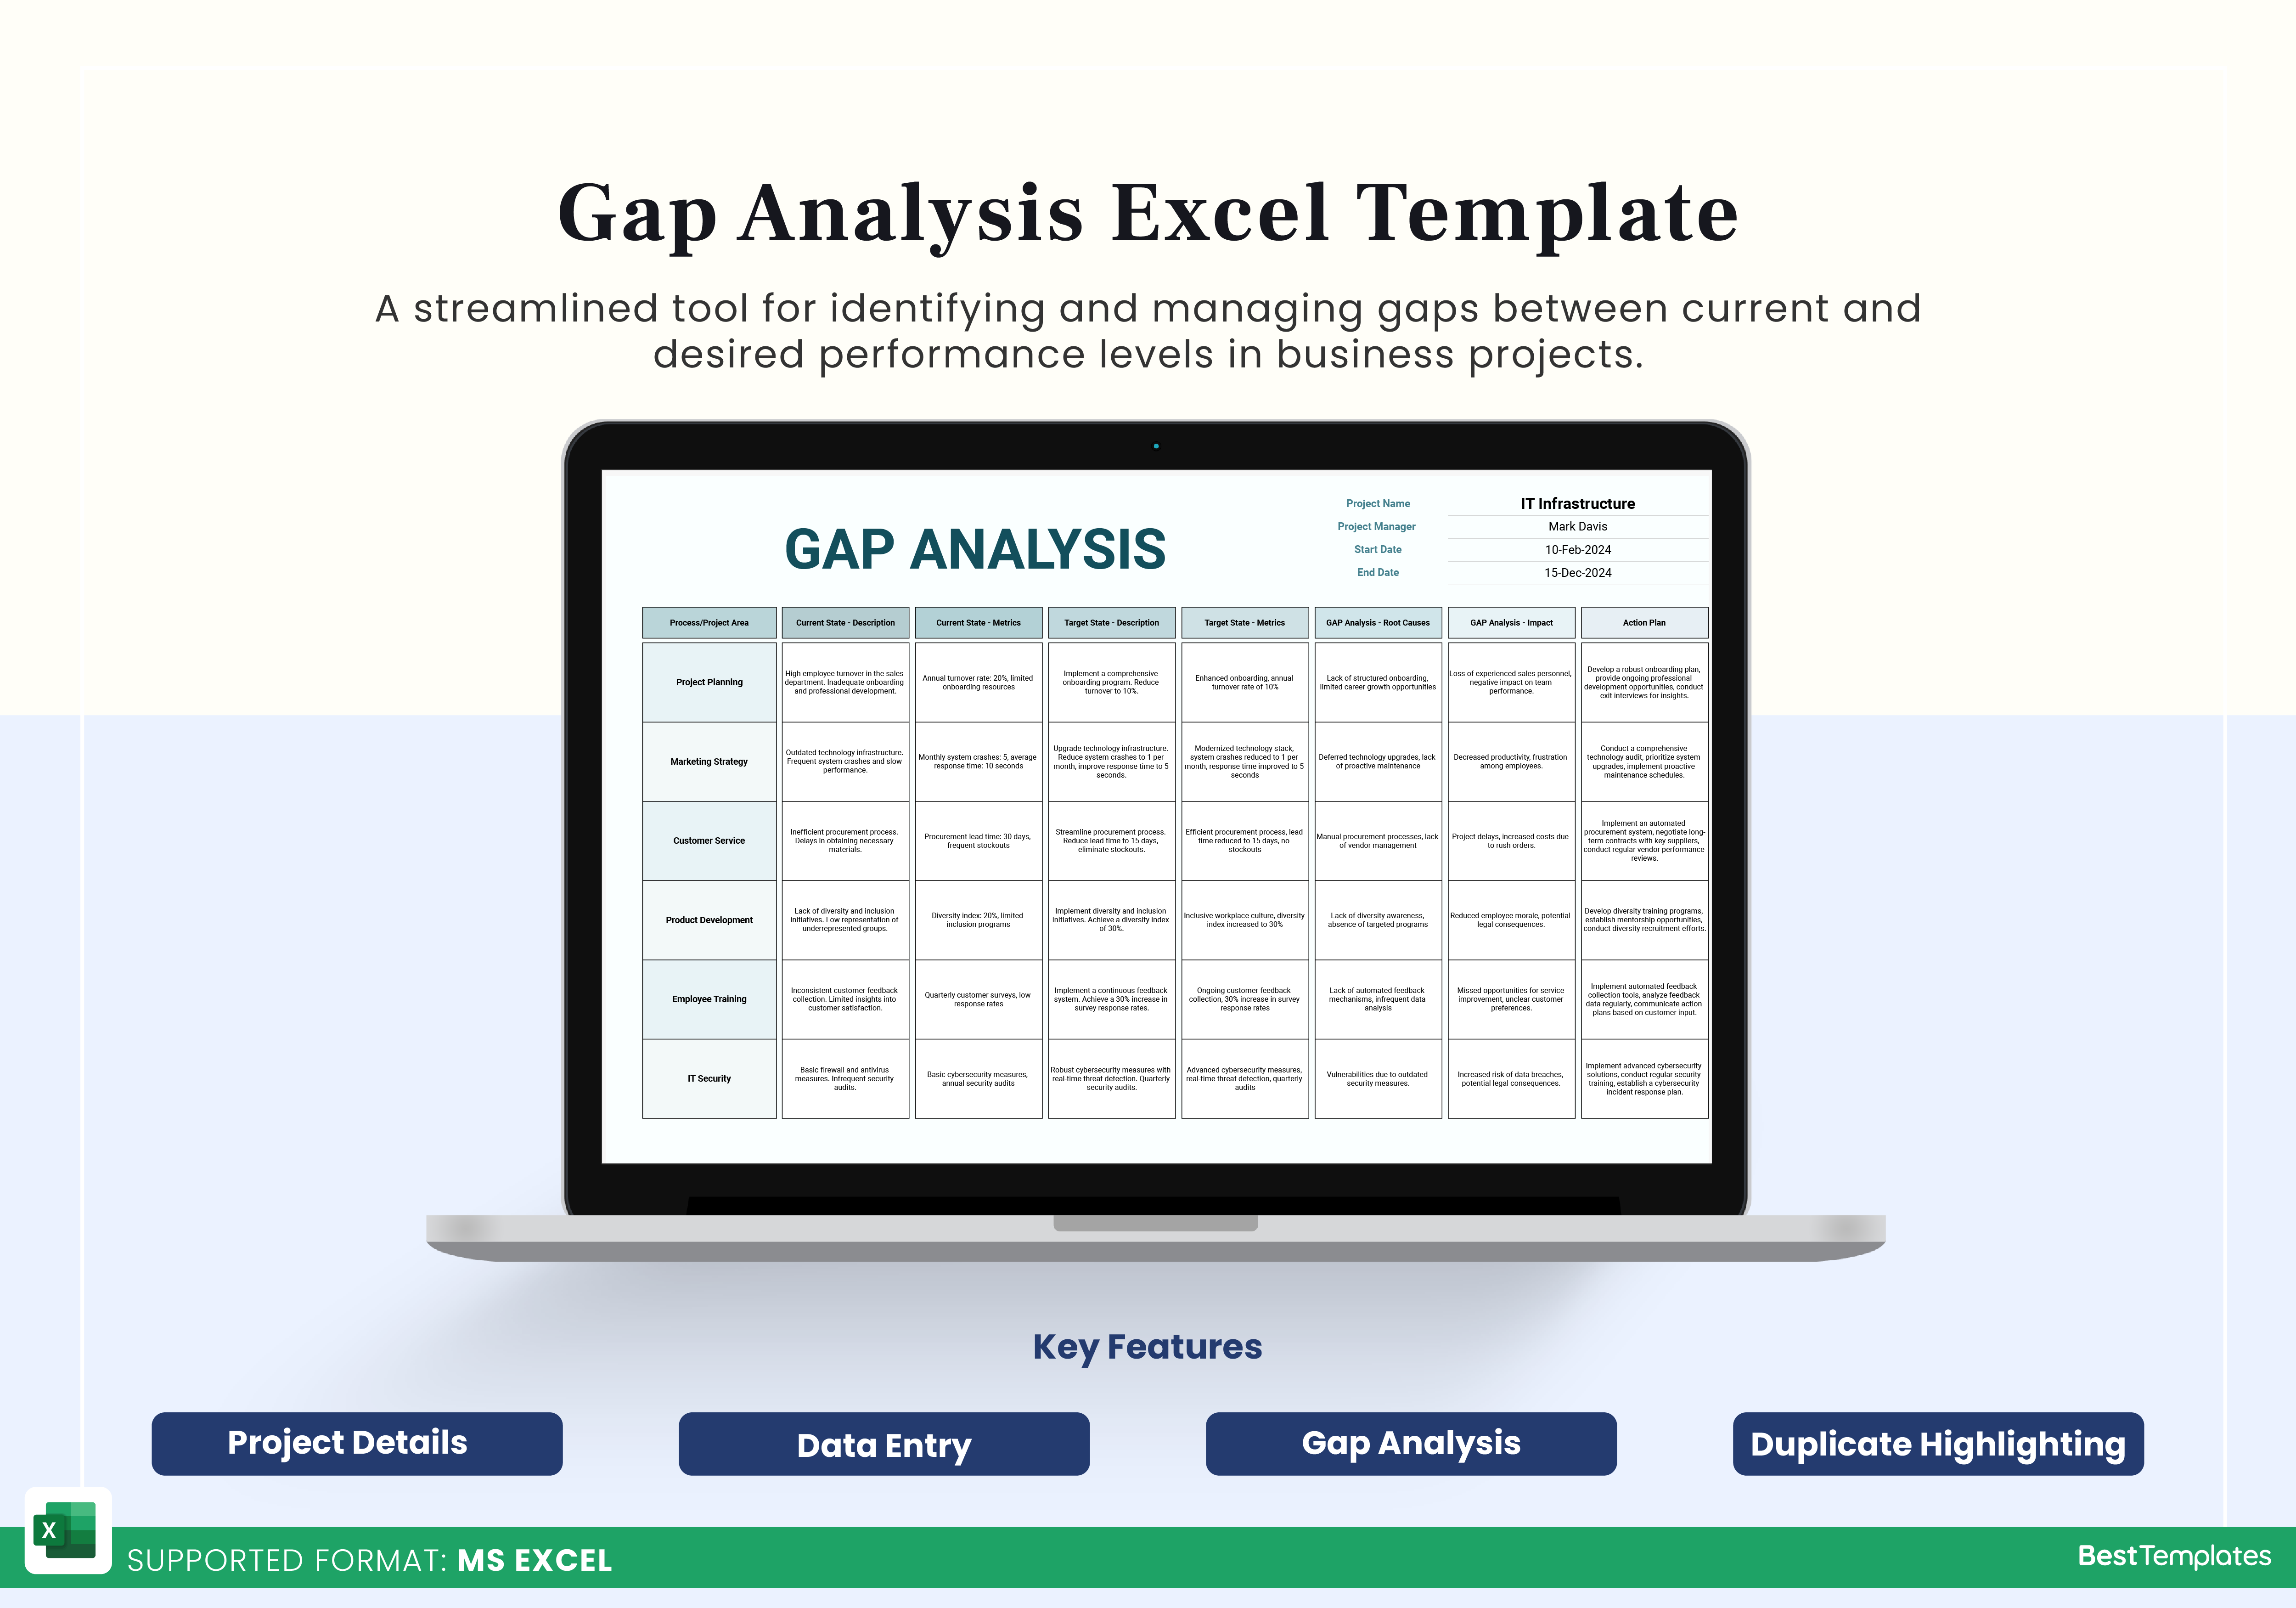
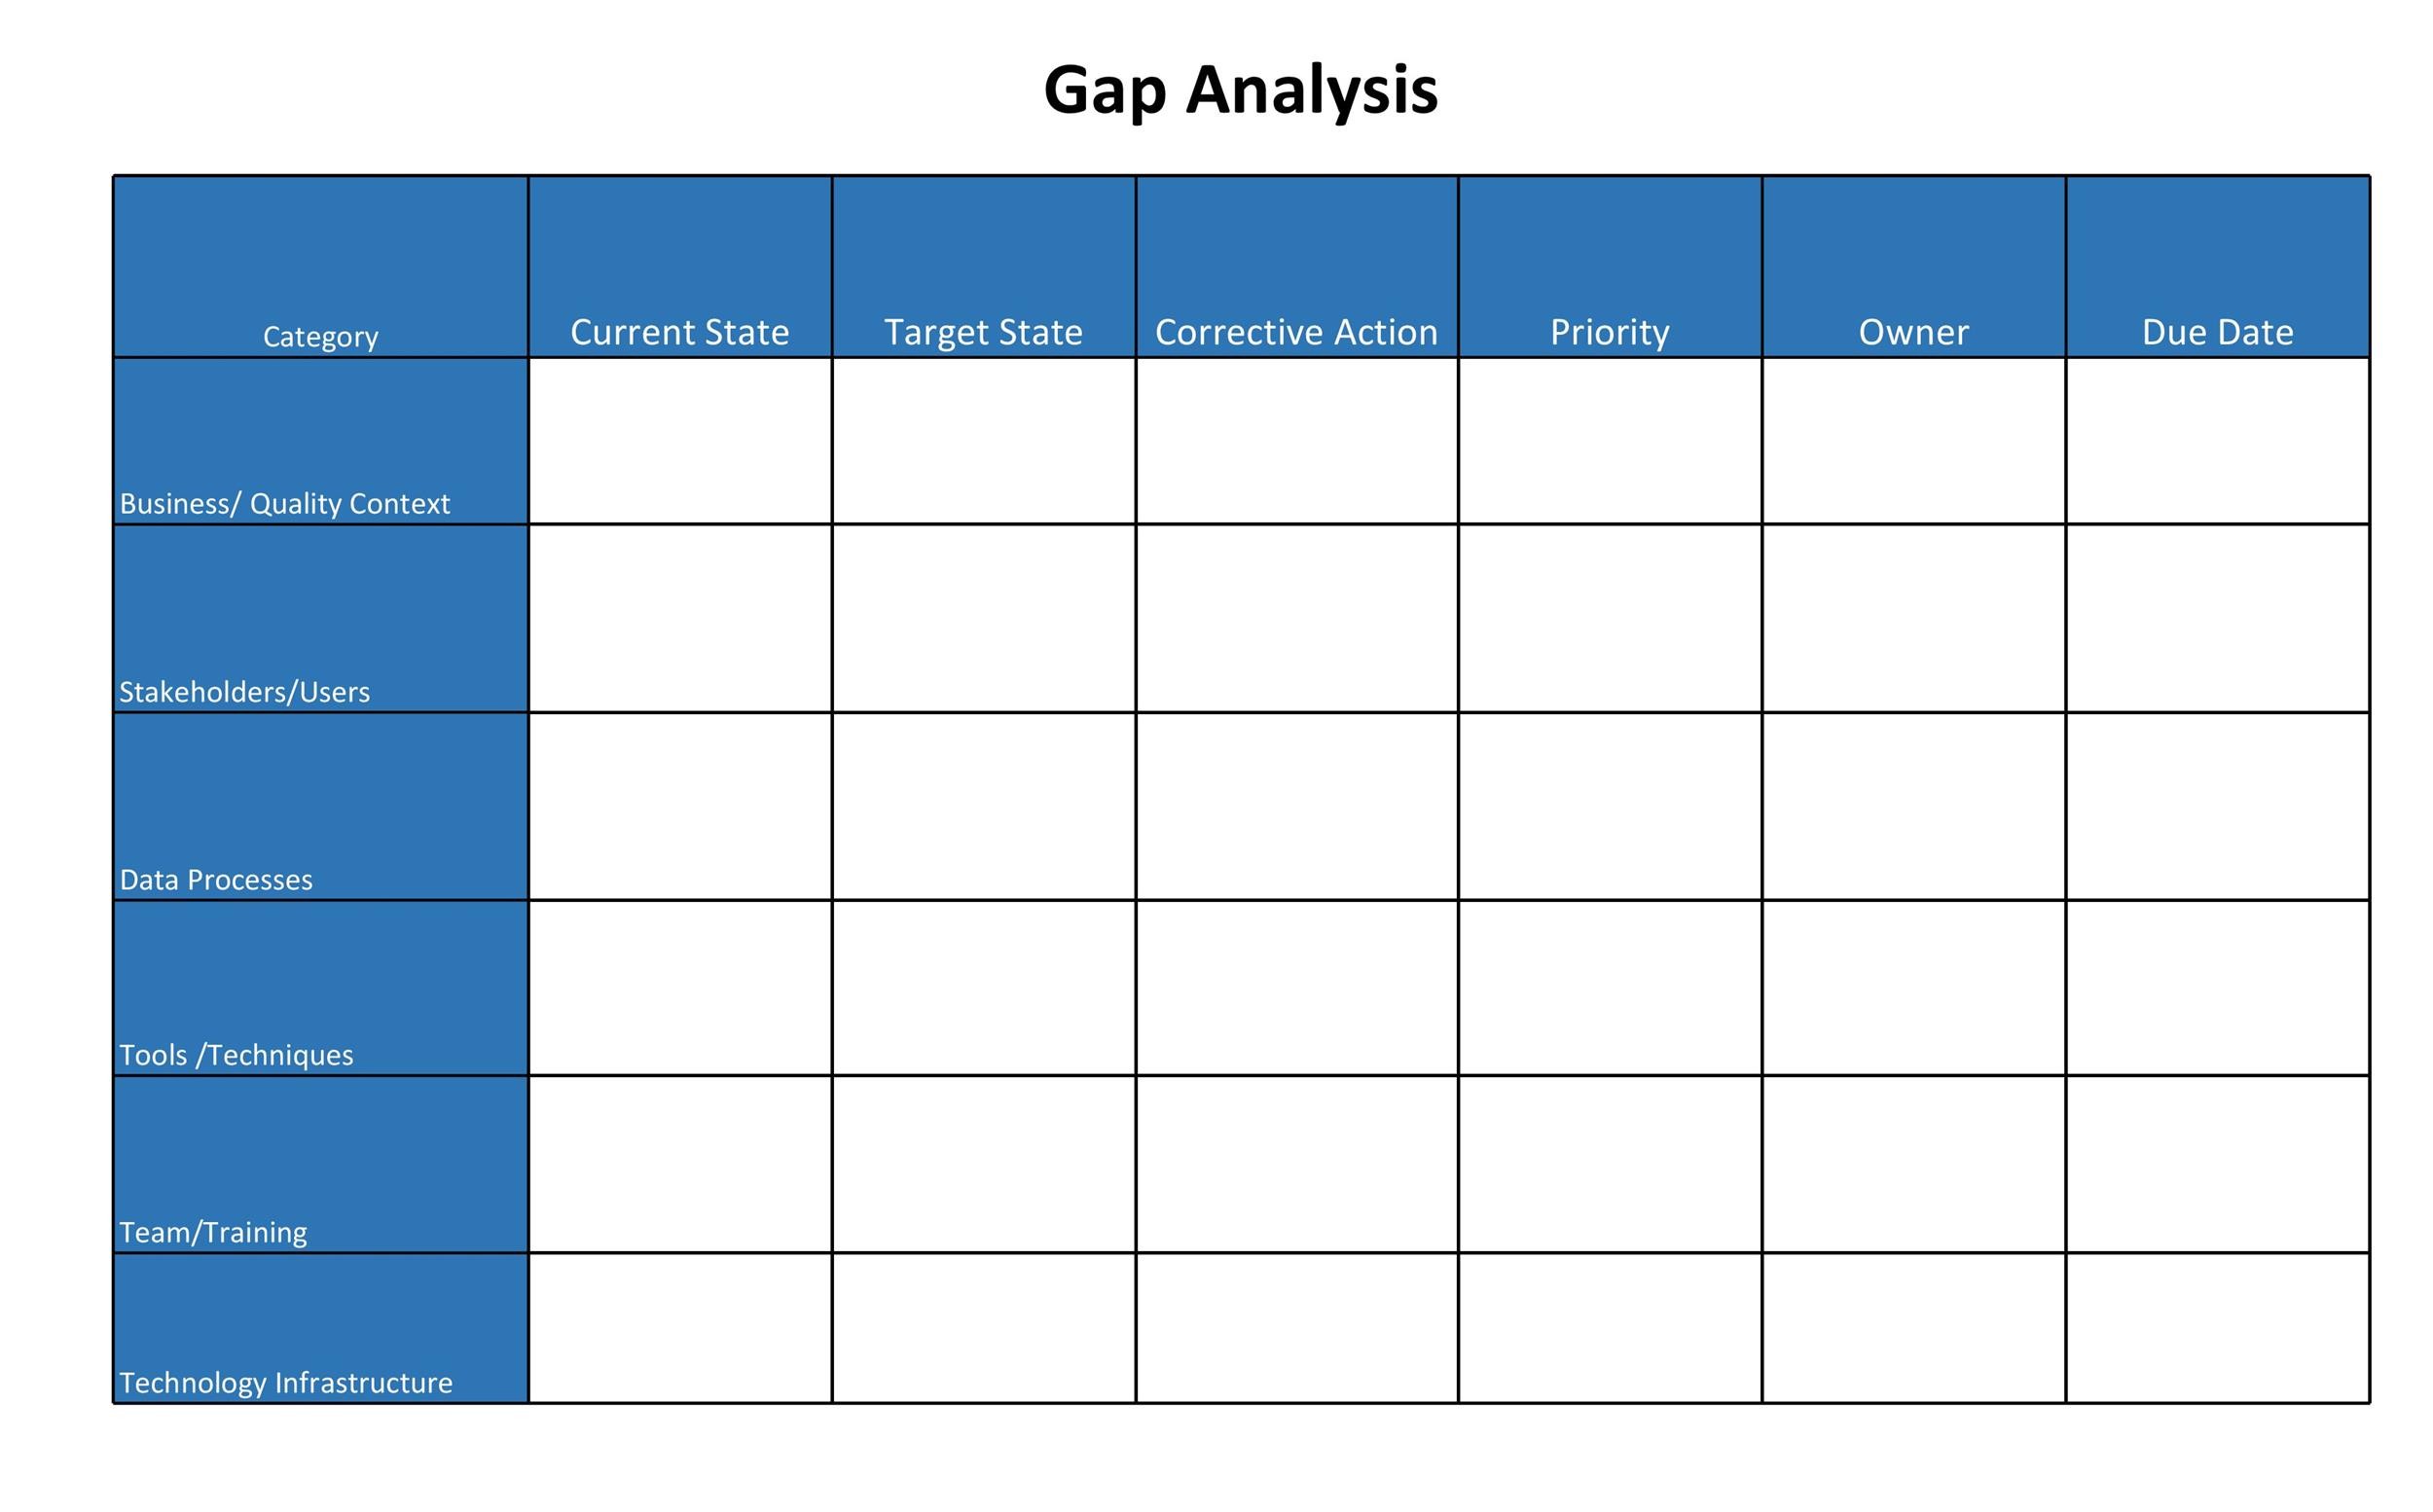
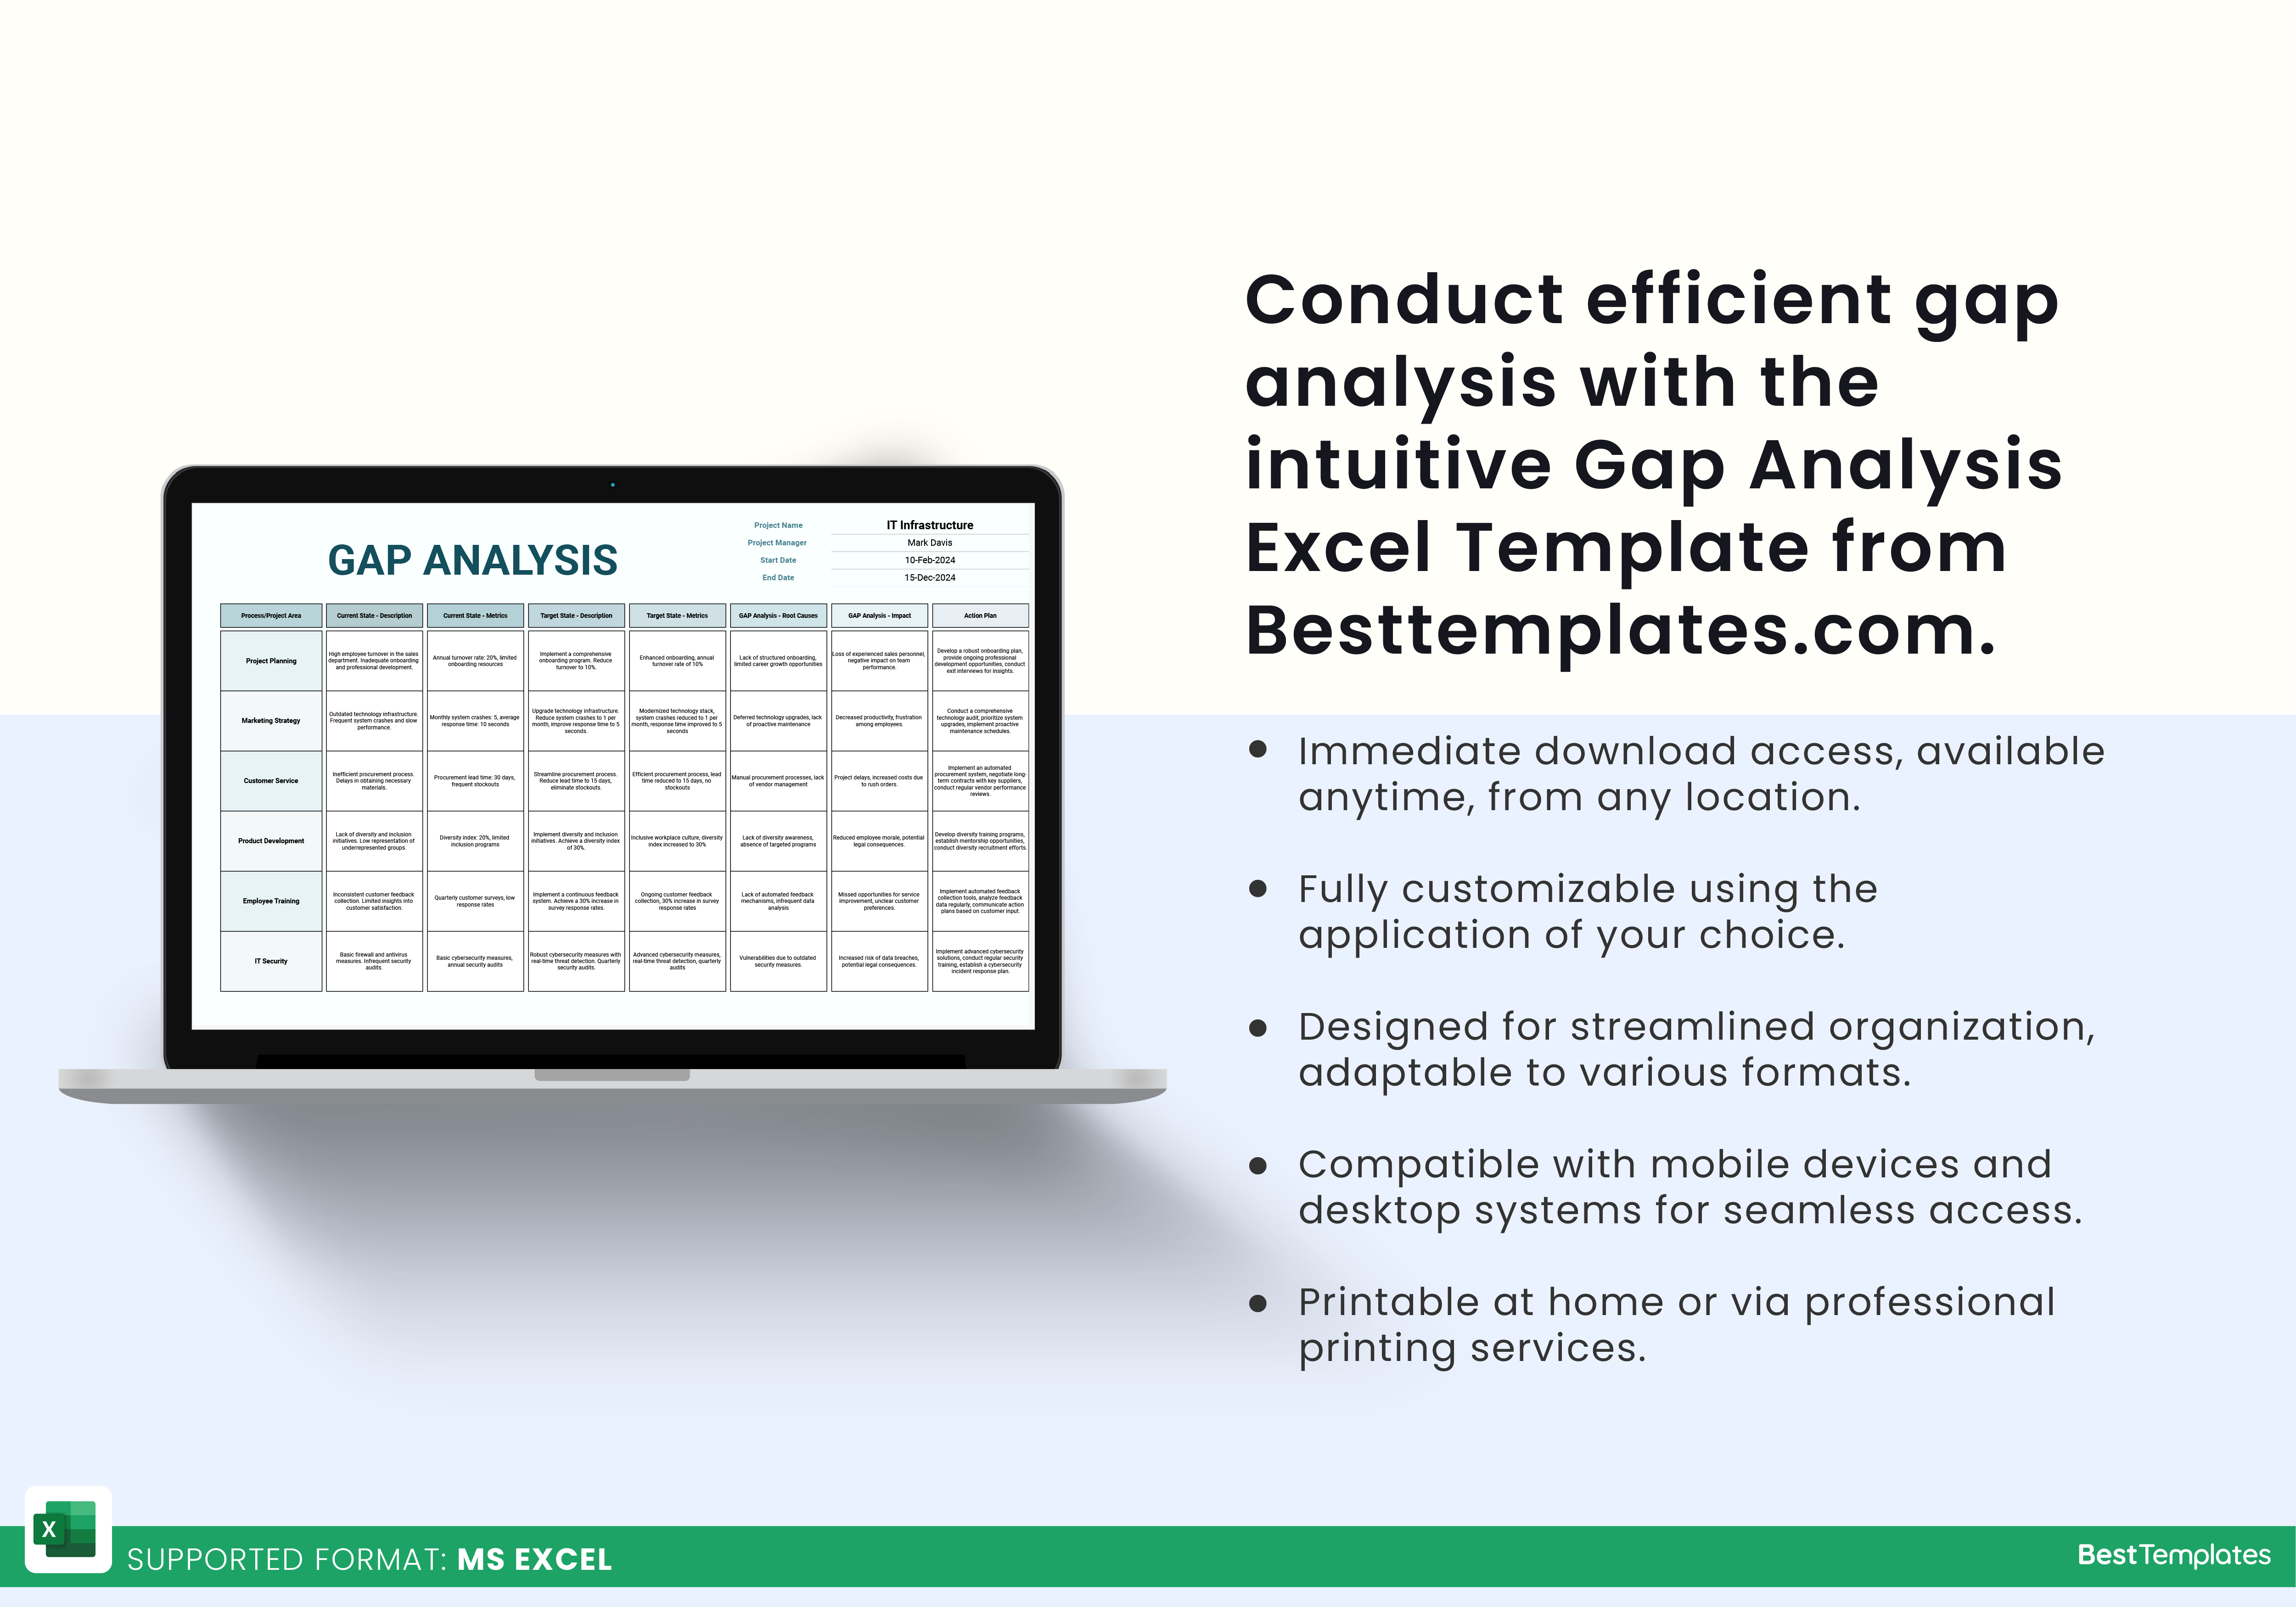
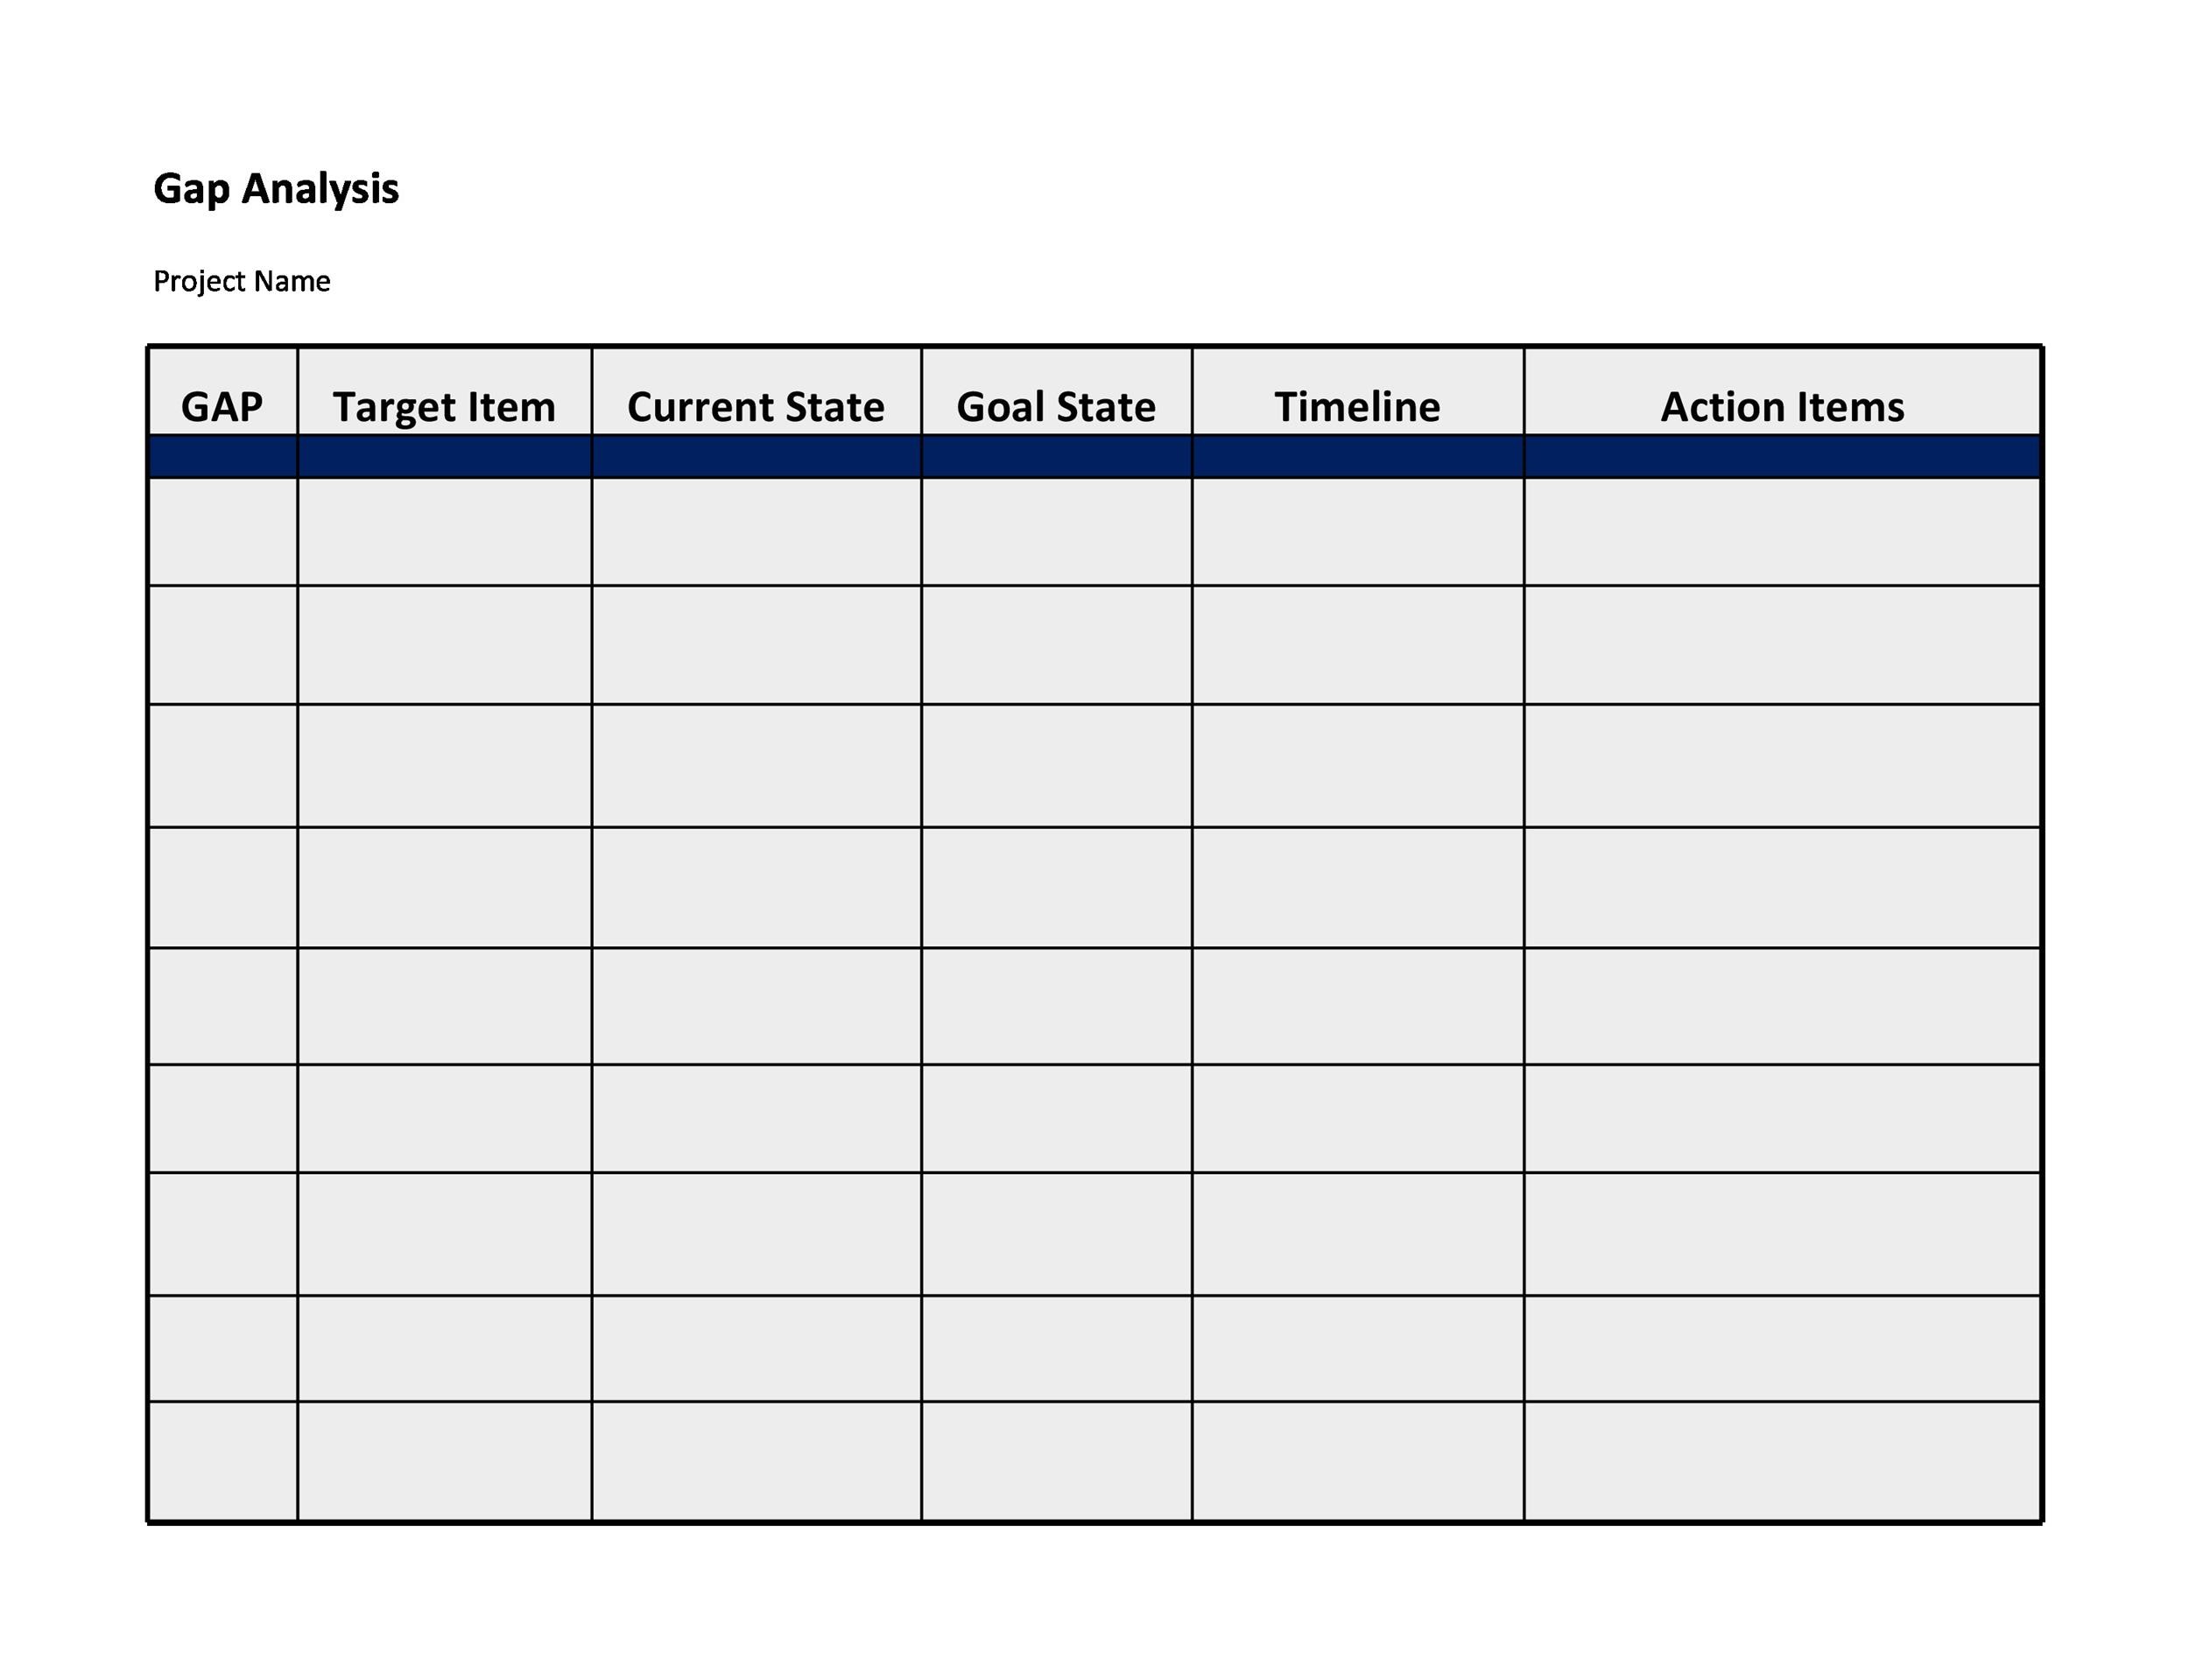
Create a new sheet called Gap Matrix. The layout should include the following columns:
- Field – the data point you’re checking.
- Source – where the data comes from.
- Presence (%) – percentage of records that contain the field.
- Missing (%) – percentage of records that lack the field.
- Gap Severity – qualitative assessment (Low, Medium, High).
- Action Needed – what to do about the gap.
Use the COUNTA function to count non-blank entries and divide by the total number of rows to get your percentages. For example: =COUNTA(B2:B1000)/COUNTA($B$2:$B$1000) gives the presence rate.
Step 4 – Color Coding and Conditional Formatting
To make the spreadsheet self-explanatory, apply conditional formatting:
- Green for Presence > 90%.
- Yellow for Presence 70%–90%.
- Red for Presence < 70%.
Use the Format > Conditional Formatting menu and set up three rules based on the percentage column. This visual cue instantly tells you which fields need attention.
Real-World Example: The Pizza Delivery Company
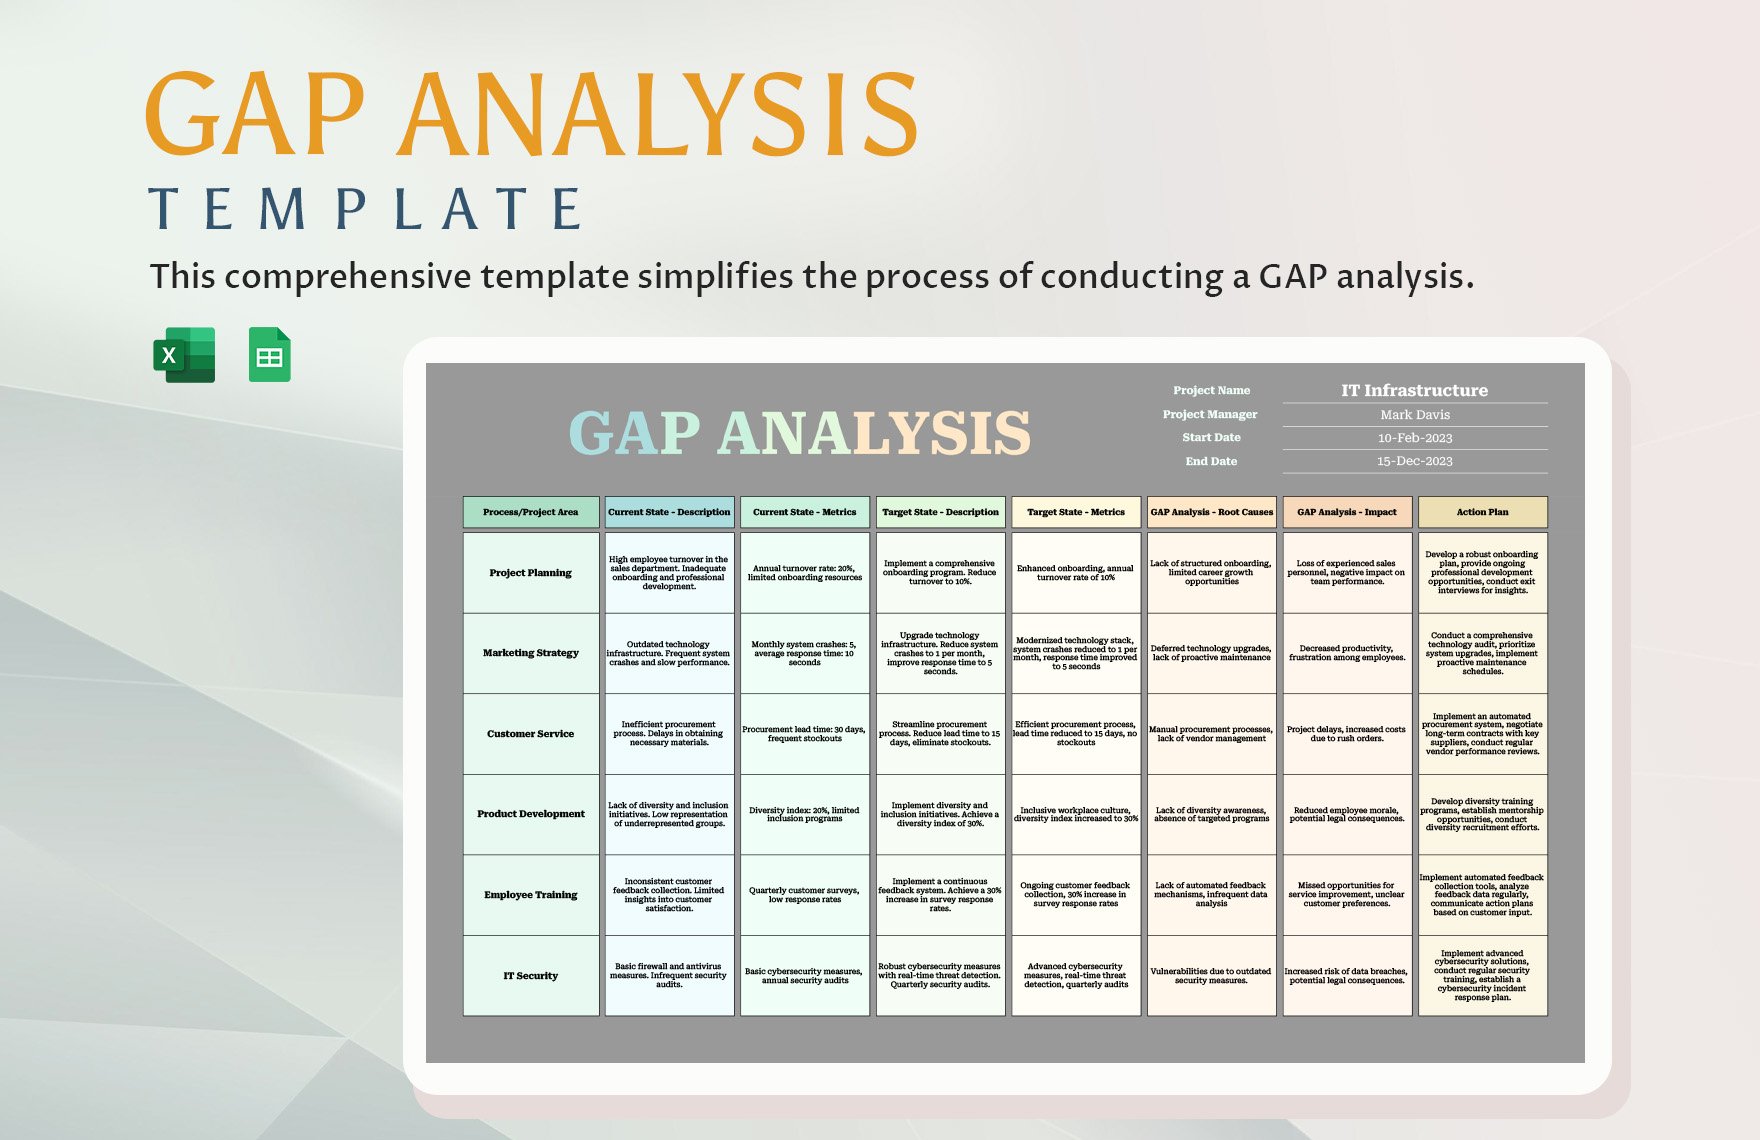
Picture a pizza delivery startup that wants to improve its customer experience. Their data gap analysis reveals:
- Customer Age – 80% missing, high impact on targeted promotions.
- Last Order Date – 95% present, low impact.
- Preferred Delivery Time – 60% missing, medium impact.
The team decides to:
- Integrate a quick age field into the ordering form.
- Ask customers to select a preferred delivery time during checkout.
- Automate reminders to collect missing preferences.
Result? A 15% increase in repeat orders within three months—a win that would make even the most stoic CEO chuckle.
Common Pitfalls and How to Avoid Them

Pitfall 1 – Overcomplicating the Sheet
It’s tempting to add every imaginable column—source metadata, validation status, comments, audit trail. While thoroughness is good, it can overwhelm users. Stick to the essentials: the field name, source, presence, and action. If you need more detail, keep it in a separate appendix.
Pitfall 2 – Ignoring Data Quality
Missing values are not the only problem. Inconsistent formats, duplicate entries, and out-of-range values can mislead analysis. After completing the gap matrix, run a quick data quality audit with:
- Remove Duplicates (Data > Remove Duplicates).
- Text to Columns to split combined fields.
- Validation rules to enforce data entry standards.
Remember: a gap in data quality is just another gap.
Tips for Sharing and Collaborating
Using Comments and Notes
Excel’s Comments feature lets team members add context without cluttering the sheet. For example, if a field is missing due to a recent policy change, add a comment so others know why the gap exists. Use Notes for quick reminders, like “Update next quarter.”
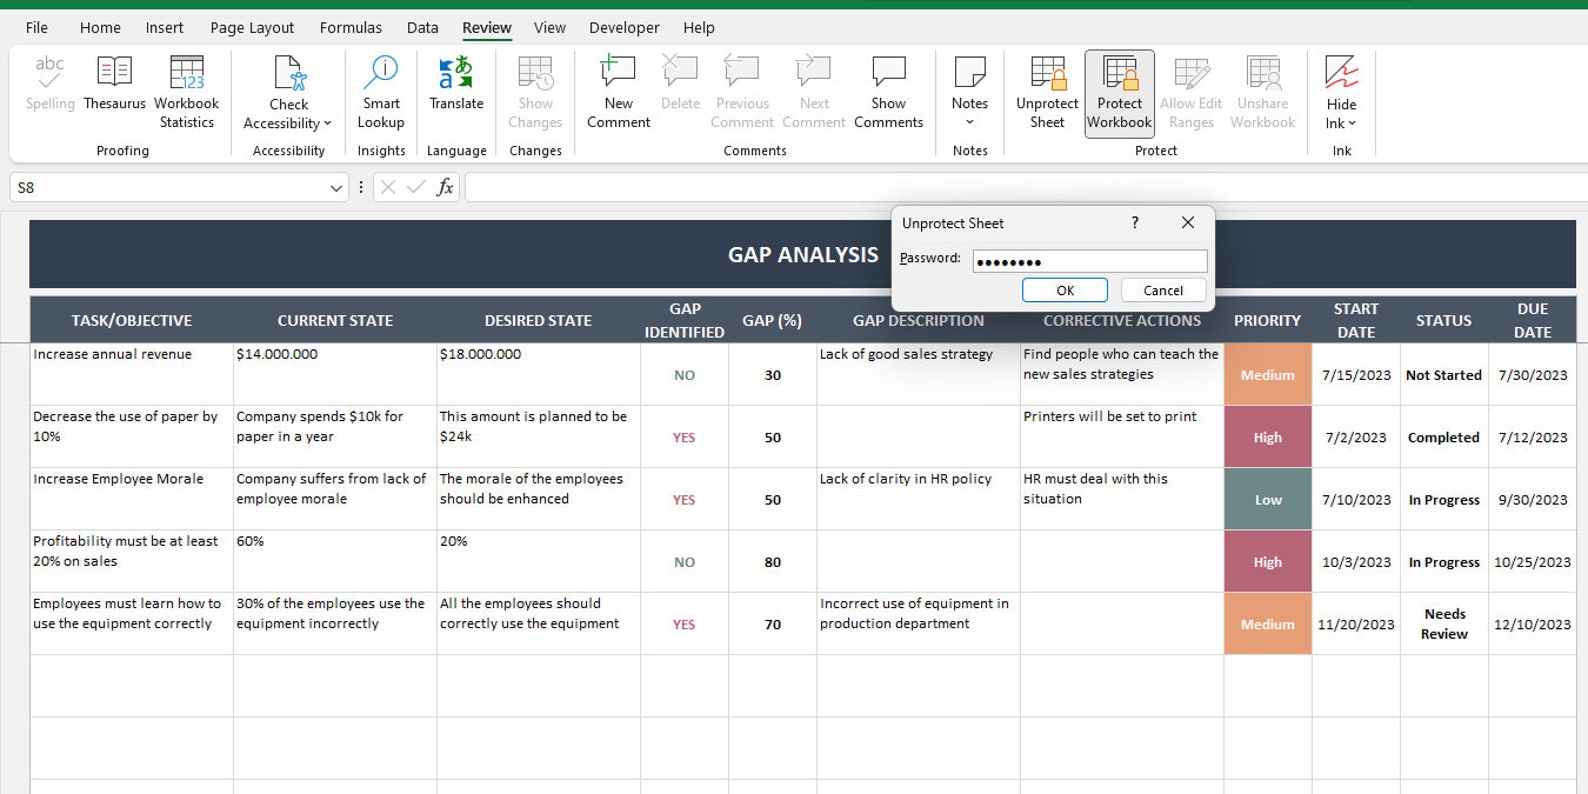
Protecting Your Workbook
To prevent accidental deletions, lock the formula cells:
- Select the cells with formulas.
- Right-click, choose Format Cells > Protection > check Locked.
- Go to Review > Protect Sheet, set a password, and specify allowed actions.
Protected sheets maintain the integrity of your gap analysis while still allowing collaboration.
Bonus: Add Some Automation with Macros

Simple VBA to Highlight Gaps
If you’re comfortable with a bit of code, a macro can automate the conditional formatting every time you refresh your data. Here’s a quick snippet:
Sub HighlightGaps()
    Dim ws As Worksheet
    Set ws = ThisWorkbook.Sheets("Gap Matrix")
    ws.Range("C2:C1000").FormatConditions.Delete
    ws.Range("C2:C1000").FormatConditions.Add Type:=xlCellValue, _
        Operator:=xlLess, Formula1:="0.7"
    ws.Range("C2:C1000").FormatConditions(1).Interior.Color = vbRed
End Sub
Run this macro whenever you import new data to instantly refresh your visual cues.
Wrapping Up

With a Data Gap Analysis Template Excel that balances functionality and humor, you transform a mundane data review into a dynamic, engaging activity. By clearly defining required fields, gathering sources, constructing a gap matrix, and applying conditional formatting, you’ll spot missing data at a glance. Avoid common pitfalls like overcomplication and quality neglect, and keep your workbook collaborative yet protected. Add a dash of automation, and you’re ready to deliver insights that not only inform but also entertain.


Related posts of "Data Gap Analysis Template Excel"
