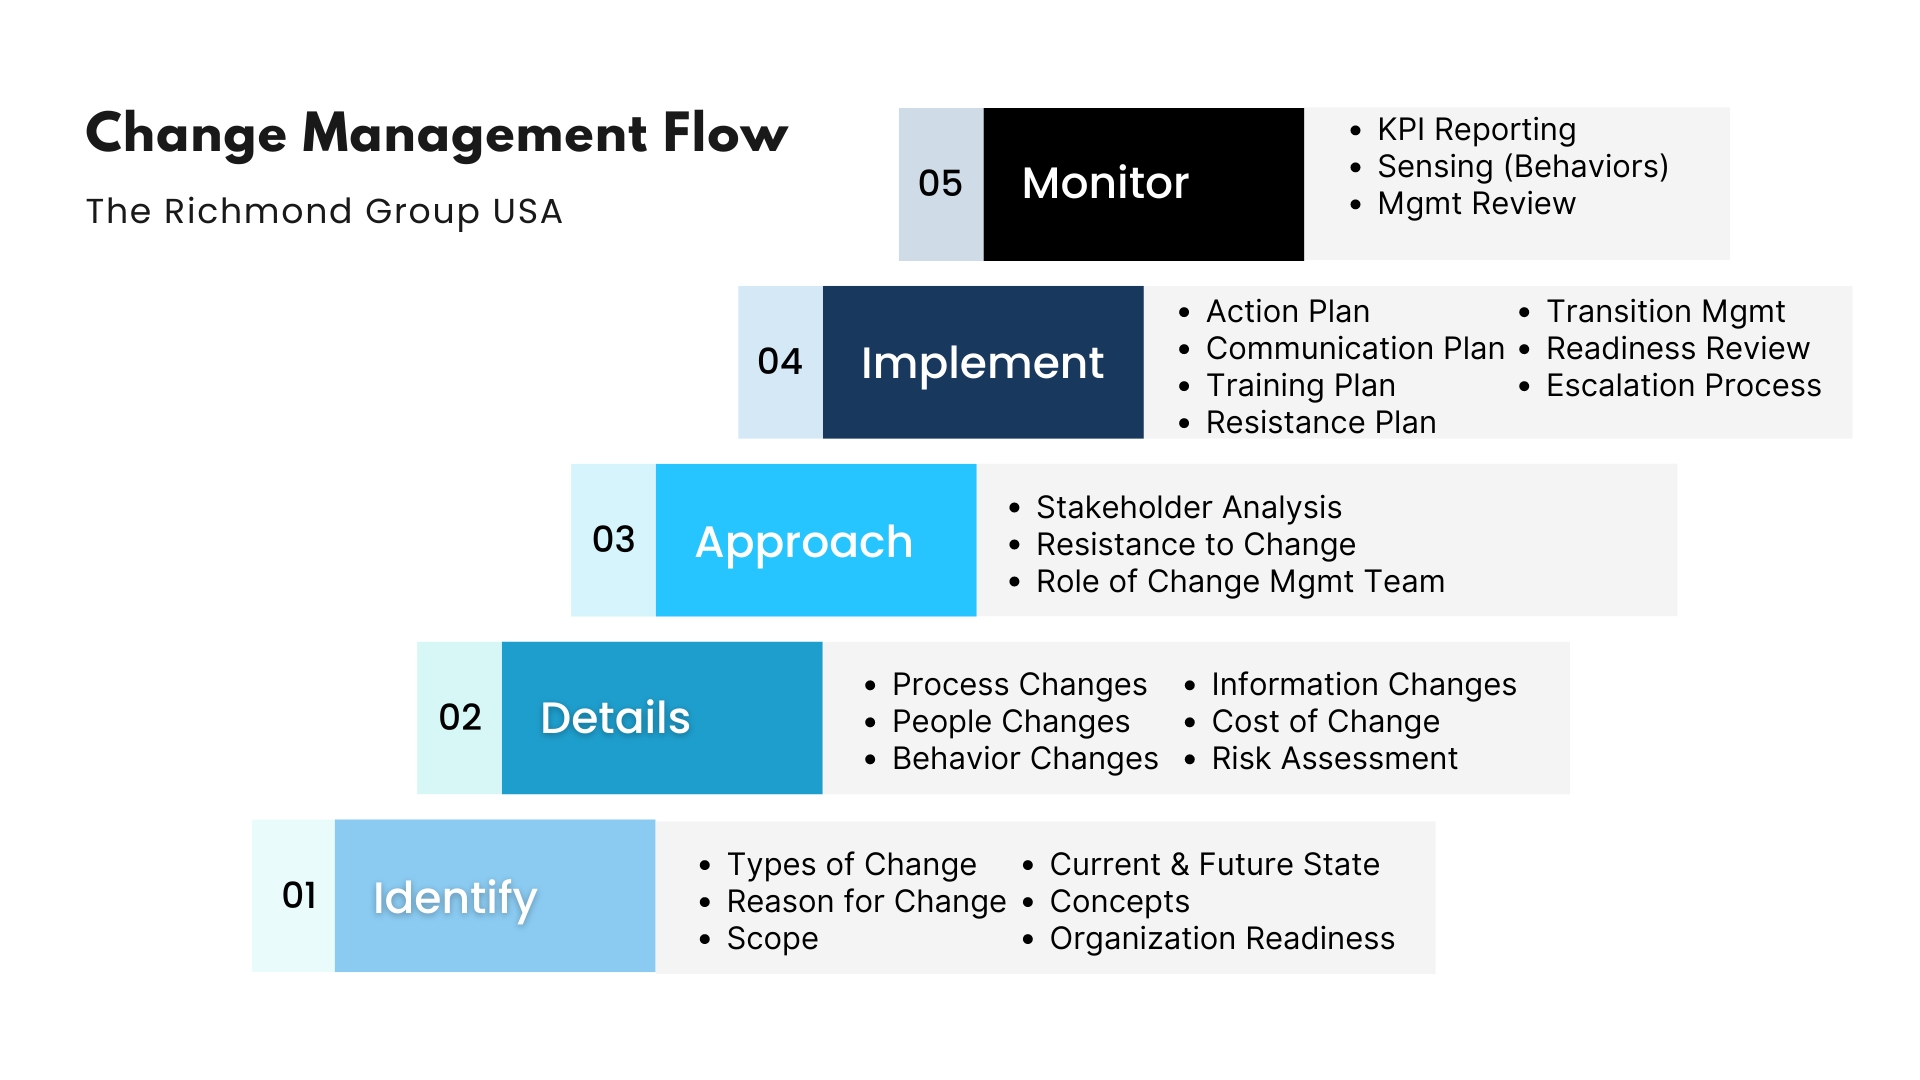
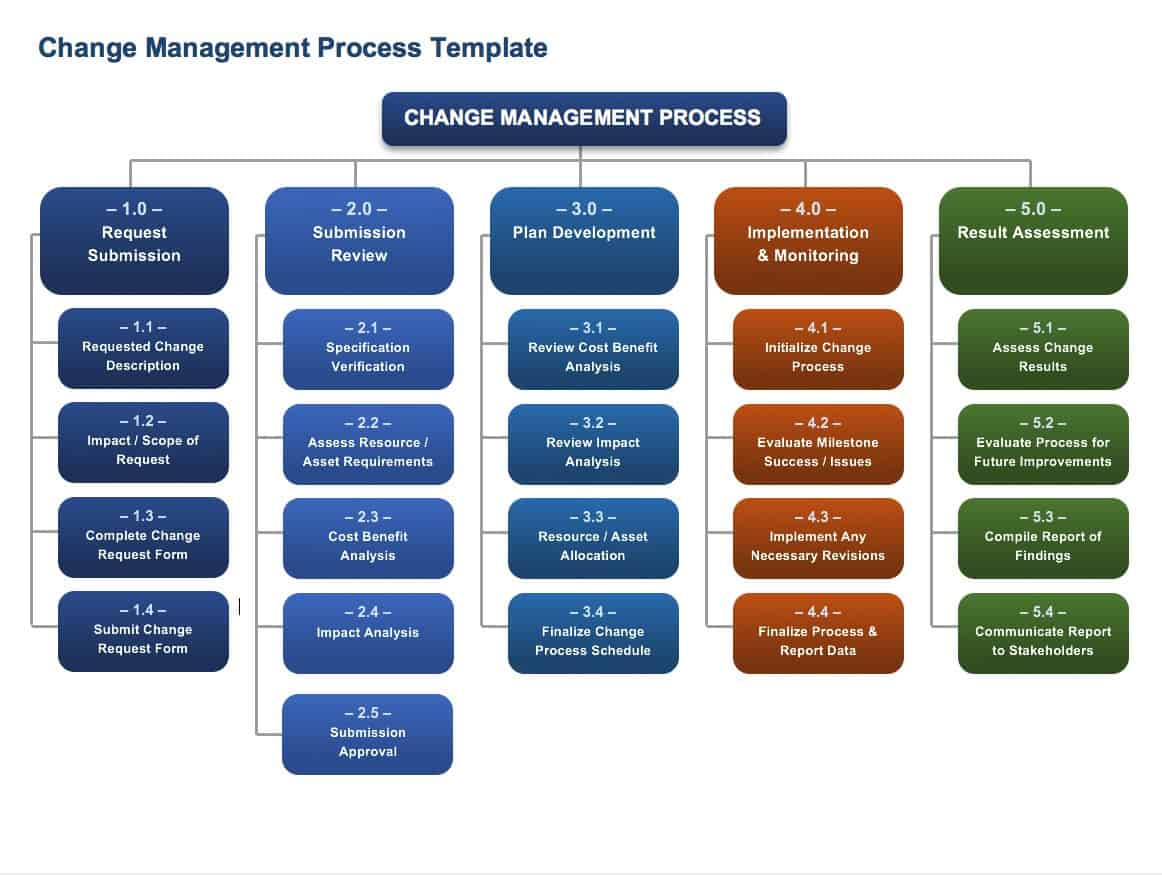
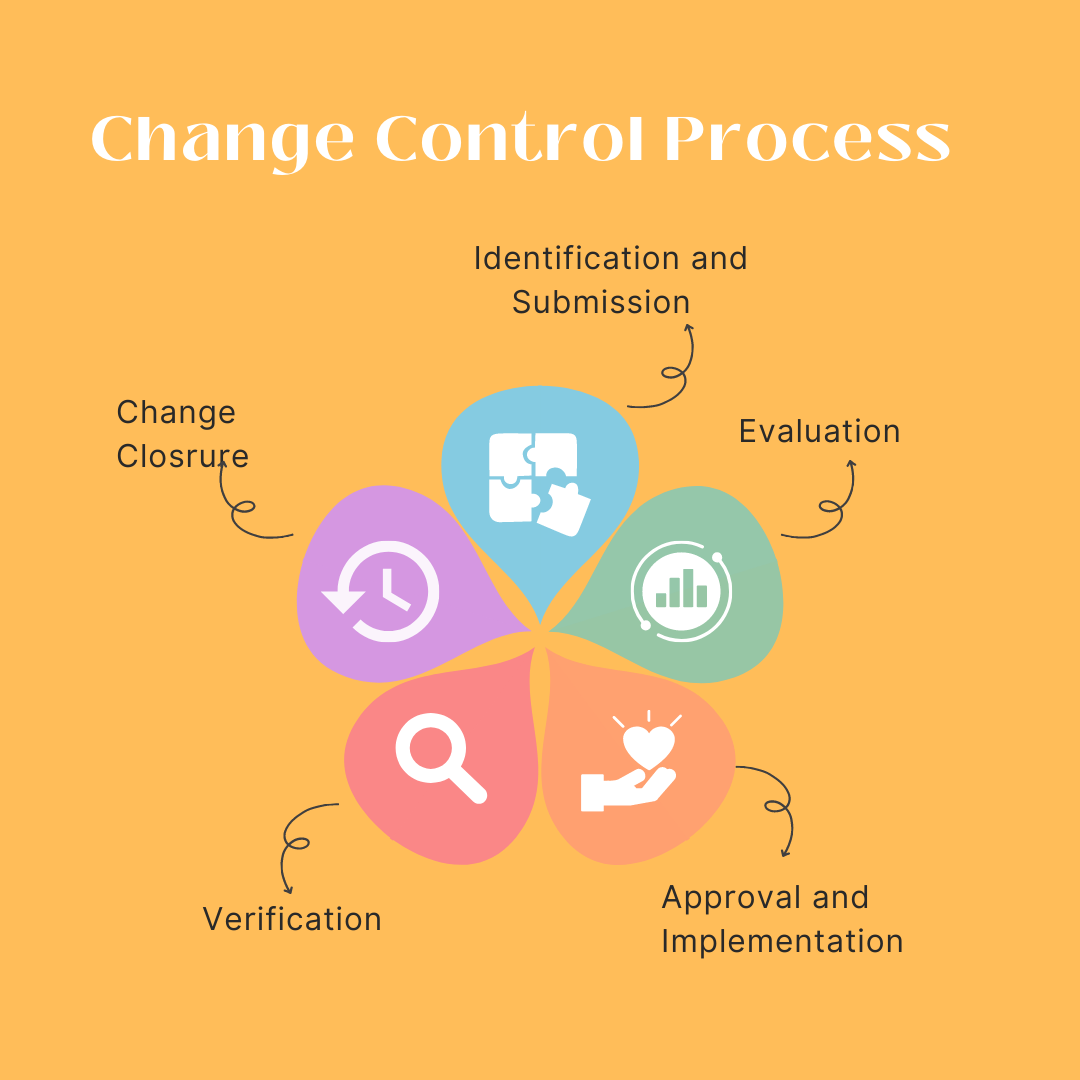
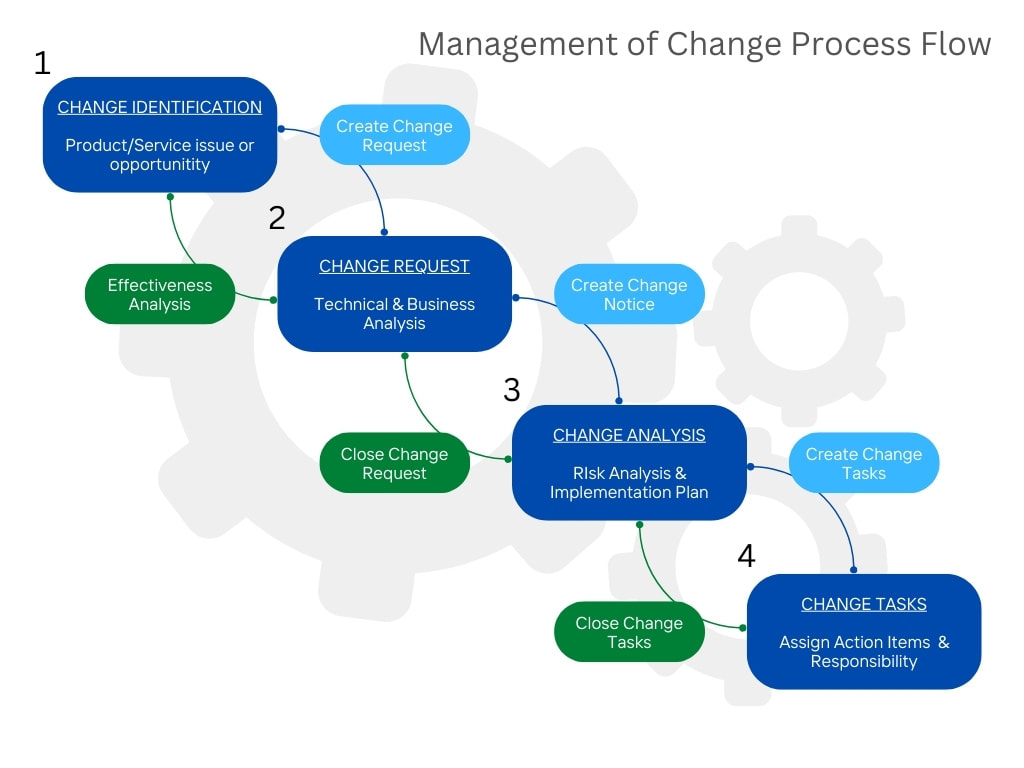
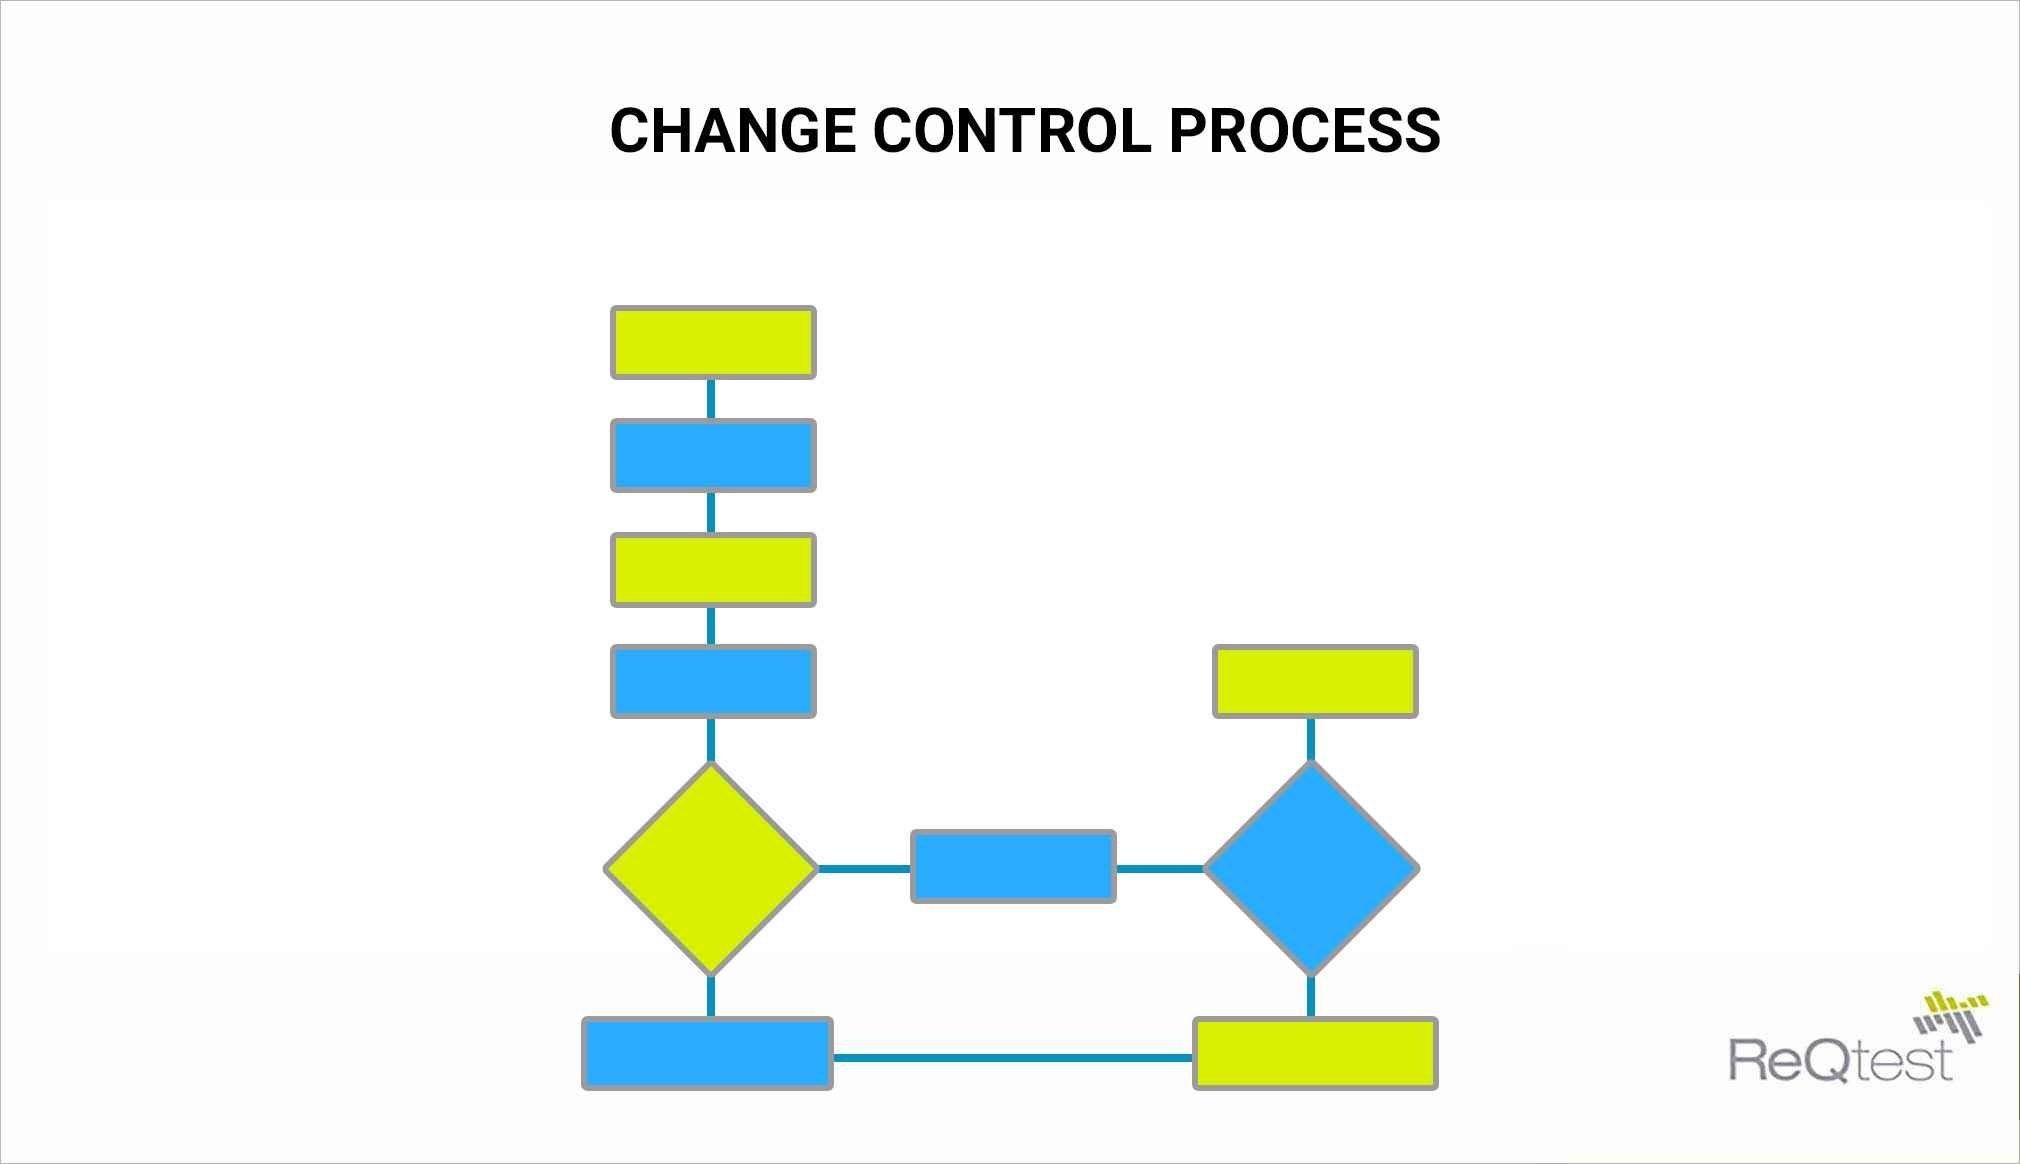
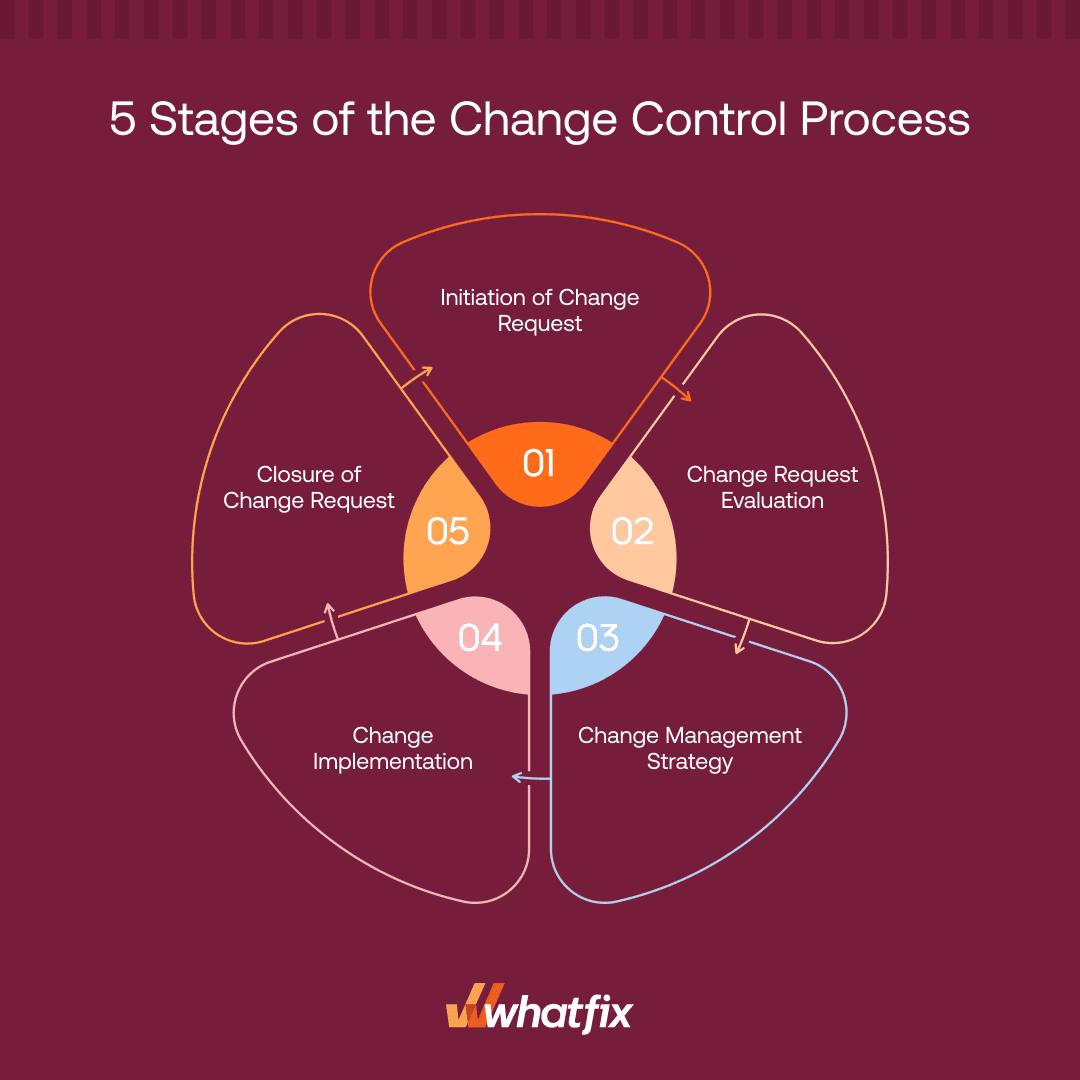
Change Control Process Flow Chart Template is the superhero cape that keeps your projects from turning into chaotic spaghetti bowls. Imagine a world where every tweak to your software, hardware, or workflow is captured in a clear, step‑by‑step diagram that even your grandma could follow. That world exists, and it’s called the Change Control Process Flow Chart Template. In this guide, we’ll explore how to build, tweak, and master this template with a dash of humor, real‑world examples, and practical advice so you’ll never lose your way when the next change request lands on your desk.
What Is a Change Control Process Flow Chart Template?

Think of the template as a recipe book for change. It lists all the necessary ingredients—who, what, when, and why—so that each step in the change lifecycle is transparent and auditable. In a nutshell, it’s a visual representation of the process that governs how changes are requested, reviewed, approved, implemented, and closed.
Key Components
- Initiation: The moment a stakeholder says, “We need a new feature!”
- Assessment: The team crunches numbers, weighs risks, and decides whether the change is worth it.
- Approval: The gatekeepers—often senior managers or change advisory boards—give the green light.
- Implementation: The developers, testers, and ops folks actually make the change.
- Verification: The change is tested, validated, and confirmed to meet the original requirements.
- Closure: Documentation is updated, and the change is formally closed.
Why It Matters
Without a clear flow chart, your team can fall into a “who did what” vortex that leads to delays, duplicated work, and, worst of all, the dreaded “We’re on a tight deadline” crisis. A well‑crafted template turns chaos into a predictable, repeatable process. Plus, it makes the audit trail so tidy that compliance folks will thank you with a smile (and maybe a donut).
Anatomy of an Effective Template

Creating an effective template is like assembling a high‑quality pizza: each topping must complement the others, or you’ll end up with a culinary disaster. Here’s how to get every slice just right.
Step 1: Initiation
When someone proposes a change, capture the following details:
- Change title and description
- Requester and stakeholder list
- Business justification (ROI, compliance, or simply “It’s cooler”)
- Estimated effort and timeline
Use a simple form or a shared document so that the request is documented immediately, not after the coffee machine breaks.
Step 2: Assessment
Now that the change is on the table, bring the squad in for a quick evaluation. Key questions:
- What is the impact on scope, cost, and schedule?
- What are the risks? (Think of them as the spicy peppers that could ruin the dish if left unchecked.)
- Do we have the resources to support the change?
Summarize findings in a one‑page impact matrix so the decision makers can see the trade‑offs at a glance.
Step 3: Approval
Depending on your organization’s policy, approvals can be handled by:
- Change Advisory Board (CAB)
- Project Sponsor
- Risk Management Team
- Executive Steering Committee
Each approval node should be represented by a distinct symbol in the flow chart—think of it as a traffic light system. Green means go, yellow means “hold up, we’re still assessing,” and red means “no, thank you, this change is out of scope.”
Step 4: Implementation
Once approved, the change moves into the implementation phase. The flow chart should include checkpoints such as:
- Code development or configuration
- Unit and integration testing
- Staging environment deployment
- User Acceptance Testing (UAT) sign‑off
Keep the flow simple; too many branches confuse more than they help. If you need more granularity, add a sub‑diagram linked from the main chart.
Step 5: Verification
After implementation, verify that the change meets the original acceptance criteria. This step often involves:
- Regression testing to ensure nothing else broke
- Performance testing if the change could affect load times
- Security audit if the change touches sensitive data
Only after passing all verification tests does the change proceed to closure.
Step 6: Closure
Close the loop by updating documentation, archiving artifacts, and conducting a post‑mortem review. Capture lessons learned and store them in a central repository so future change requests can benefit from past experiences. A clean closure also satisfies auditors and gives the team a chance to celebrate—because everyone deserves a cake after a successful rollout.
Common Pitfalls and How to Avoid Them

Even the best templates can suffer if you ignore a few common mistakes. Here’s what to watch out for and how to keep your flow chart from becoming a tangled knot.
Overcomplicating the Diagram
Too many arrows and boxes can turn your flow chart into a maze. Keep the diagram focused on the critical path. Use colors to differentiate phases, but avoid a rainbow of hues that make the chart look like a disco floor.
Ignoring Stakeholder Input
A template that only the change management team drafts will miss practical insights from developers, QA, and end users. Invite representatives from each stakeholder group to review the draft. Their feedback can surface hidden dependencies and realistic timelines.
Skipping Documentation
Remember: the flow chart is a living document. If you skip updating it when the process evolves, you’ll be explaining a “historic” version to auditors. Set a quarterly review cadence to keep the template current.
Real‑World Example: Office Software Roll‑Out

Let’s walk through a relatable scenario: a mid‑size company wants to switch from a legacy HR system to a modern SaaS platform. The change control process flow chart helps the team navigate this transition smoothly.
The Scenario
Company X has a legacy HR system that has been in use for 15 years. It’s slow, lacks mobile support, and has data silos. The IT steering committee decides to move to a cloud‑based solution to improve user experience and compliance with new data protection regulations.
The Flow Chart in Action
1. **Initiation**: HR requests the new system, citing productivity gains and compliance. The change request is logged with a business justification score of 9/10.
2. **Assessment**: IT estimates a 12‑week effort, 20% budget increase, and potential downtime of 4 hours during migration. Risk analysis identifies data migration failures as the highest risk.
3. **Approval**: The CAB reviews the request, approves the change, and assigns a risk mitigation plan.
4. **Implementation**: IT sets up the SaaS environment, migrates data, and conducts unit tests.
5. **Verification**: Post‑migration, HR conducts UAT, confirms data integrity, and passes compliance audit checks.
6. **Closure**: The change is documented, training materials are updated, and a post‑mortem highlights that the migration went smoother than expected because of the thorough risk plan.
Lessons Learned
- Early involvement of data specialists reduces migration time.
- Transparent risk documentation builds trust among stakeholders.
- Celebrating success boosts morale for future change initiatives.
Tips for Customizing Your Template
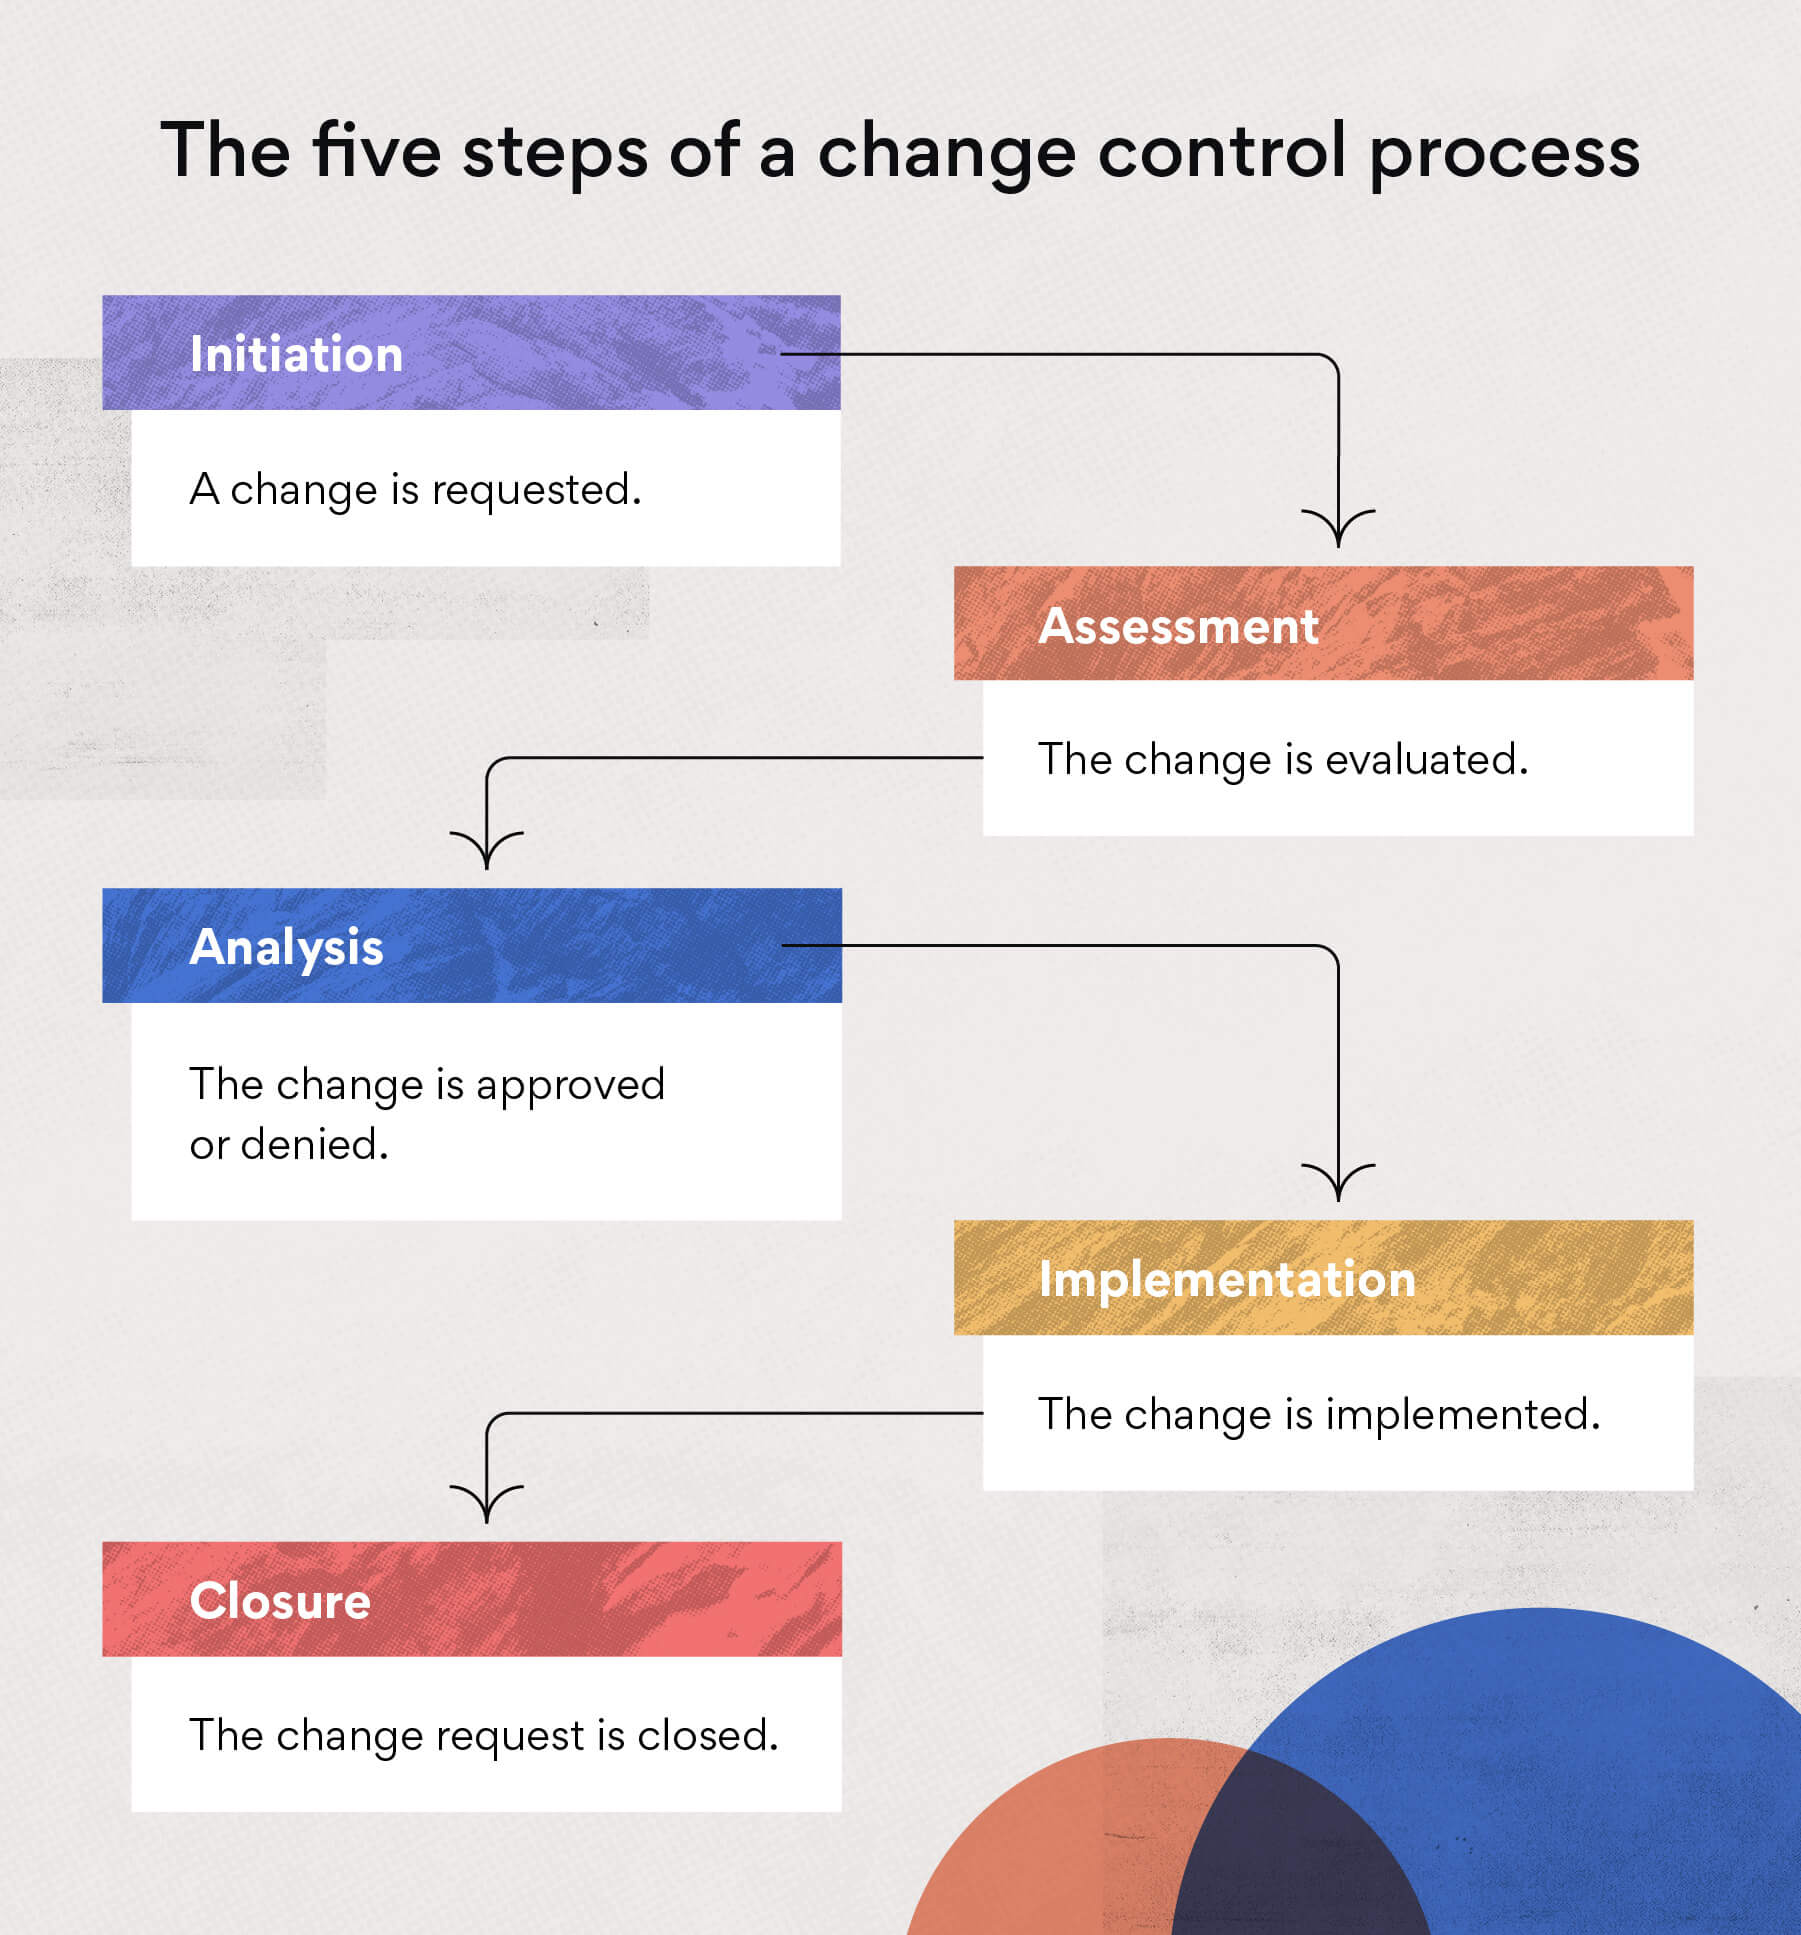
Every organization has its quirks. Tailor your flow chart to fit your culture, processes, and tooling ecosystem. Here are a few customization strategies.
Aligning with Agile
If your team follows Agile, embed the change control process within the sprint cycle. Treat each change request as a user story with acceptance criteria, and use a Kanban board to visualize the flow. The template can include sprint gates for approval and verification.
Using Visual Tools
Leverage diagramming tools that support collaborative editing—think Lucidchart, Draw.io, or Microsoft Visio. These tools allow you to create reusable shapes, link to detailed documentation, and version the diagram automatically.
Maintaining Consistency
Use a style guide for shapes, colors, and labels. Consistency reduces cognitive load and helps new team members onboard quickly. Store the template in a shared drive or wiki where it can be versioned and referenced across projects.
Frequently Asked Questions

How many steps should I include?
Focus on the critical milestones that provide value and accountability. A typical template ranges from six to ten steps. Too many steps can overwhelm, while too few may miss important checks.
Can I combine with risk management?
Absolutely. Embed risk assessment nodes within the flow chart. Use icons or color coding to indicate high‑risk areas, and link to detailed risk registers when necessary.
What if approvals are delayed?
Include a contingency buffer in the timeline. Document the reason for the delay and re‑prioritize tasks accordingly. Transparency keeps stakeholders informed and reduces frustration.
Conclusion

The Change Control Process Flow Chart Template is not just a diagram—it’s the backbone of disciplined, transparent, and efficient change management. By clearly defining initiation, assessment, approval, implementation, verification, and closure, you empower teams to handle changes with confidence, avoid costly mistakes, and keep projects on track. Customizing the template to fit your Agile cadence or traditional waterfall, incorporating stakeholder input, and regularly revisiting the diagram ensures it stays relevant and effective. So next time a change request lands on your desk, open your flow chart, follow the steps, and remember: a well‑charted change is a happy change.