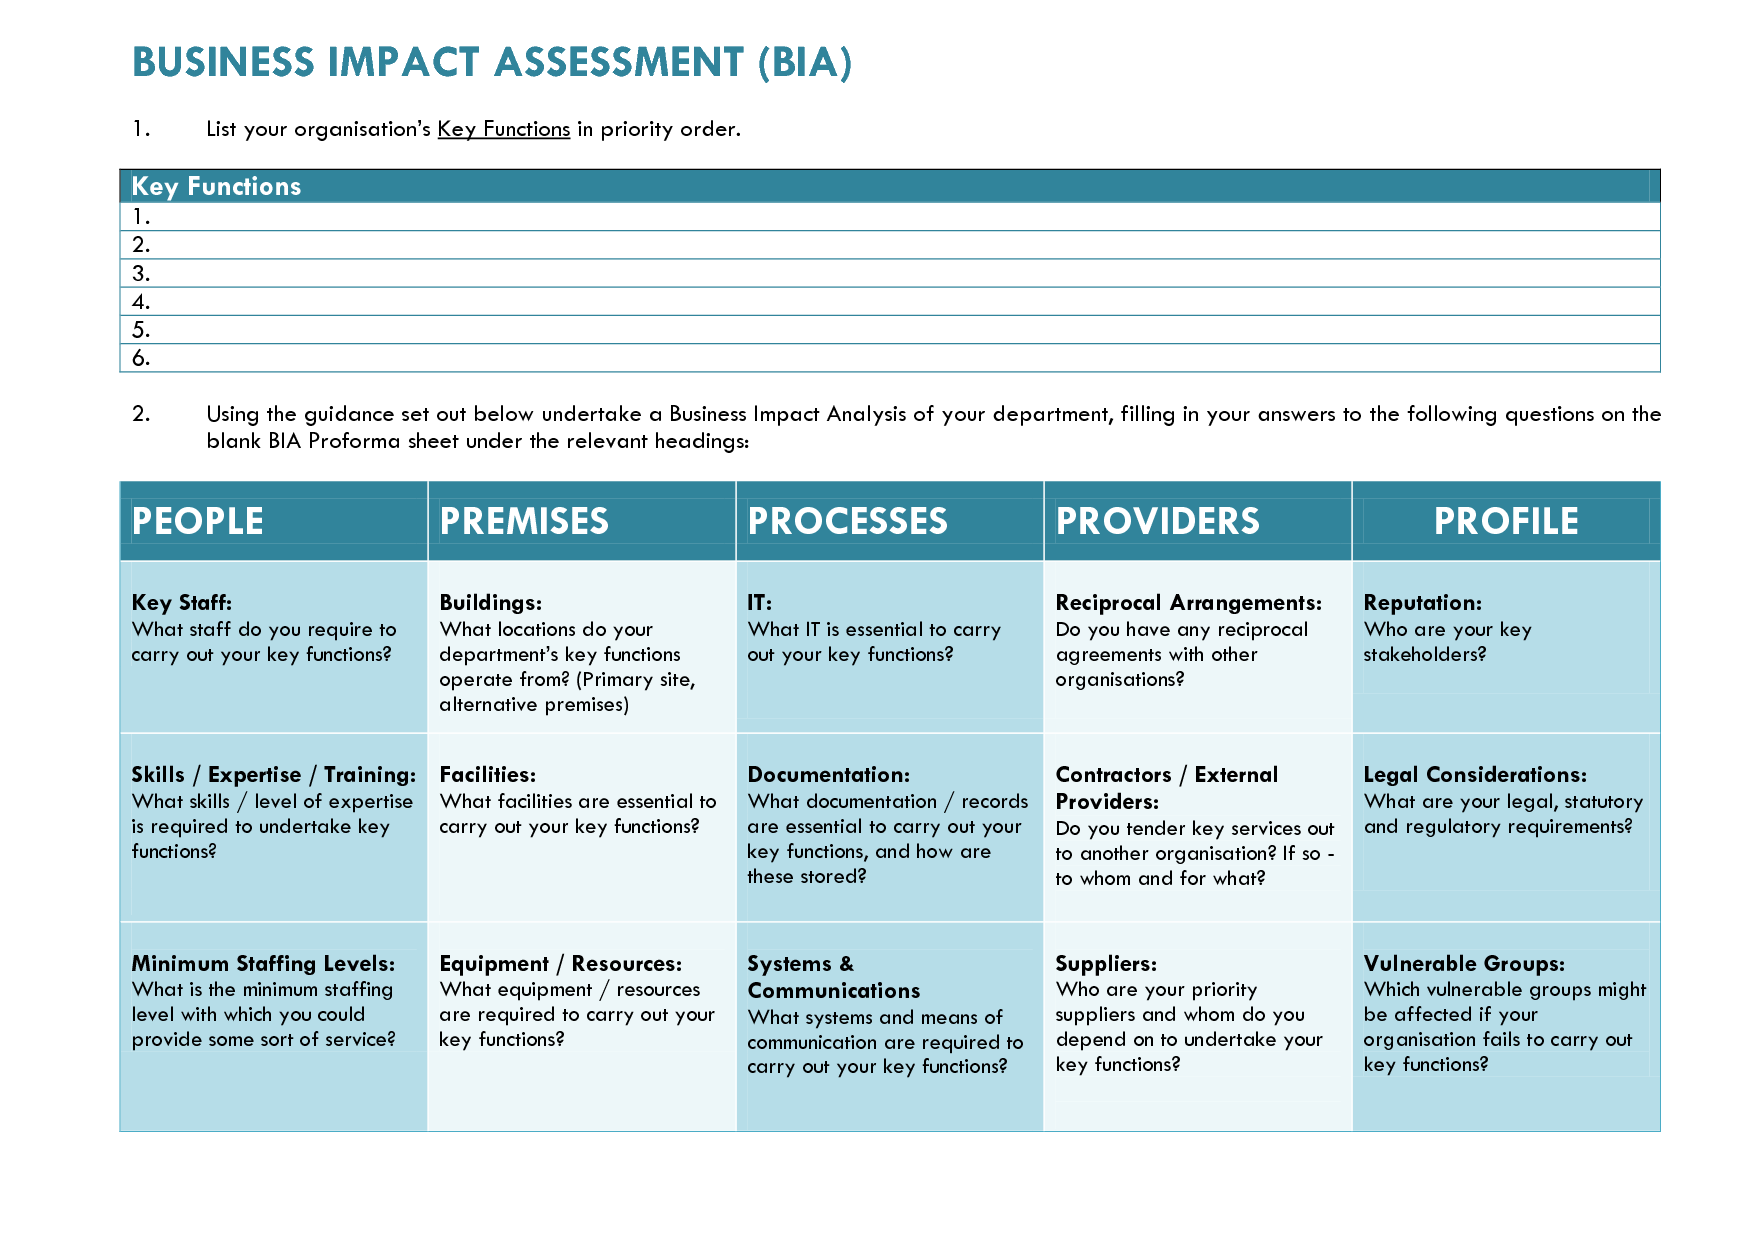
The Business Impact Analysis Report Template is more than a simple checklist; it’s the blueprint that translates risk assessment into actionable recovery strategies. By capturing critical functions, dependencies, and recovery priorities, this template empowers organizations to anticipate disruptions, protect revenue streams, and maintain stakeholder confidence.
Understanding Business Impact Analysis
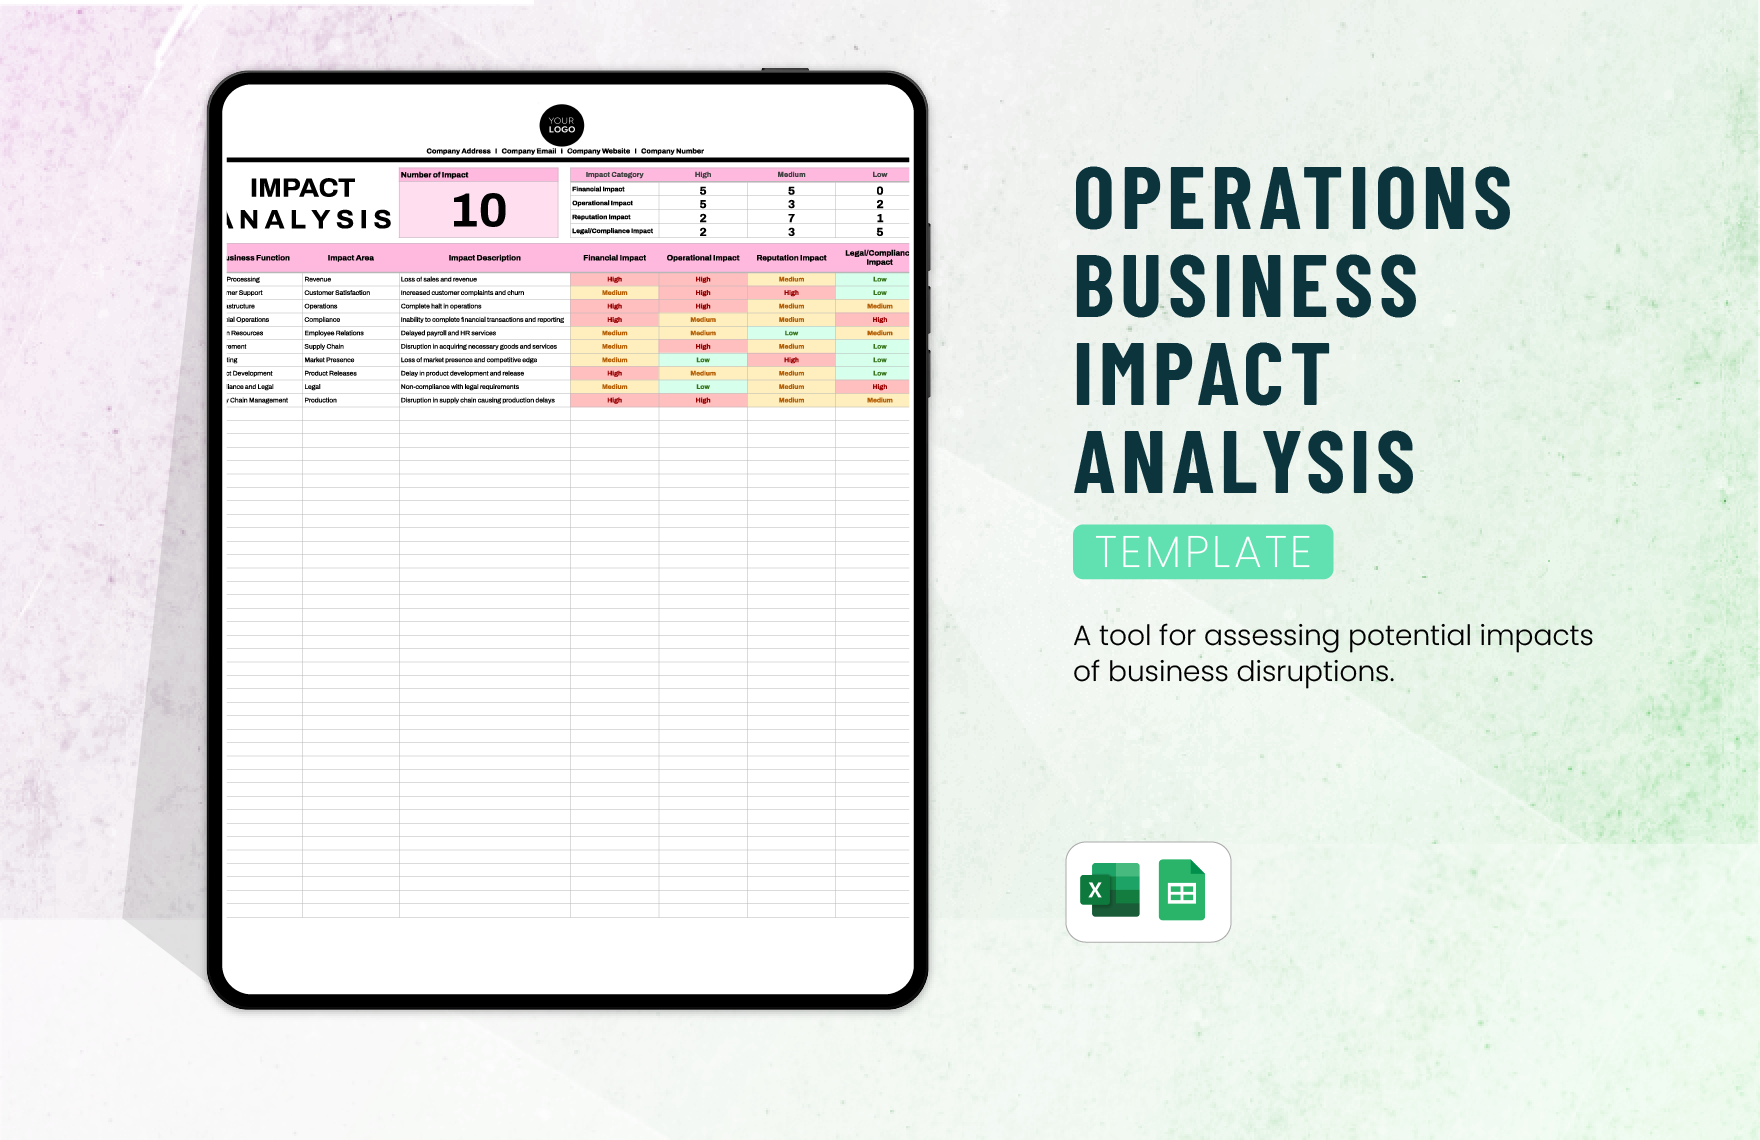
Business Impact Analysis (BIA) is a systematic approach to identify and evaluate the effects of business interruptions on an organization’s operations, finances, and reputation. Unlike generic risk assessments, BIA focuses on the *impact* of disruptions, quantifying how long an interruption can last before it becomes financially or legally unacceptable.
Core Objectives of BIA
- Identify essential processes and supporting resources.
- Determine critical thresholds such as Maximum Tolerable Downtime (MTD) and Recovery Time Objectives (RTO).
- Establish Recovery Point Objectives (RPO) that define acceptable data loss.
- Prioritize recovery efforts and resource allocation.
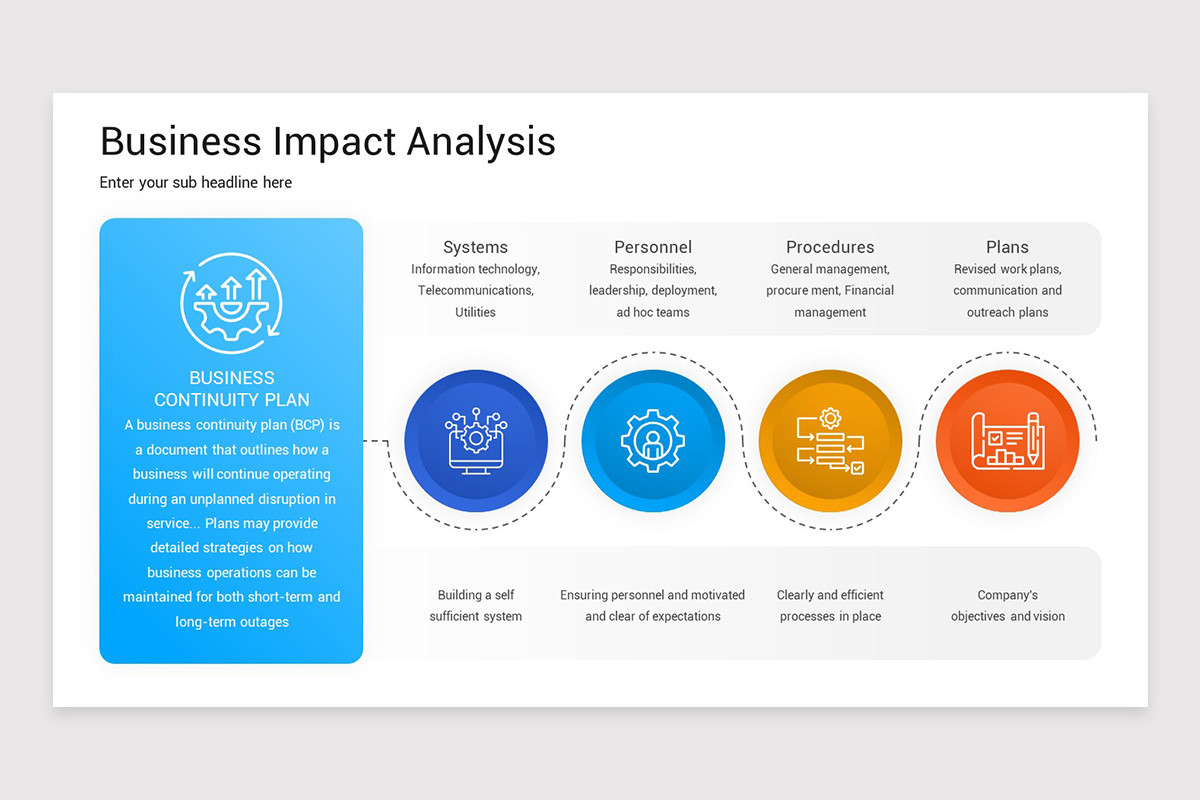
- Inform the development of a robust Business Continuity Plan (BCP).
Why a Report Template Matters
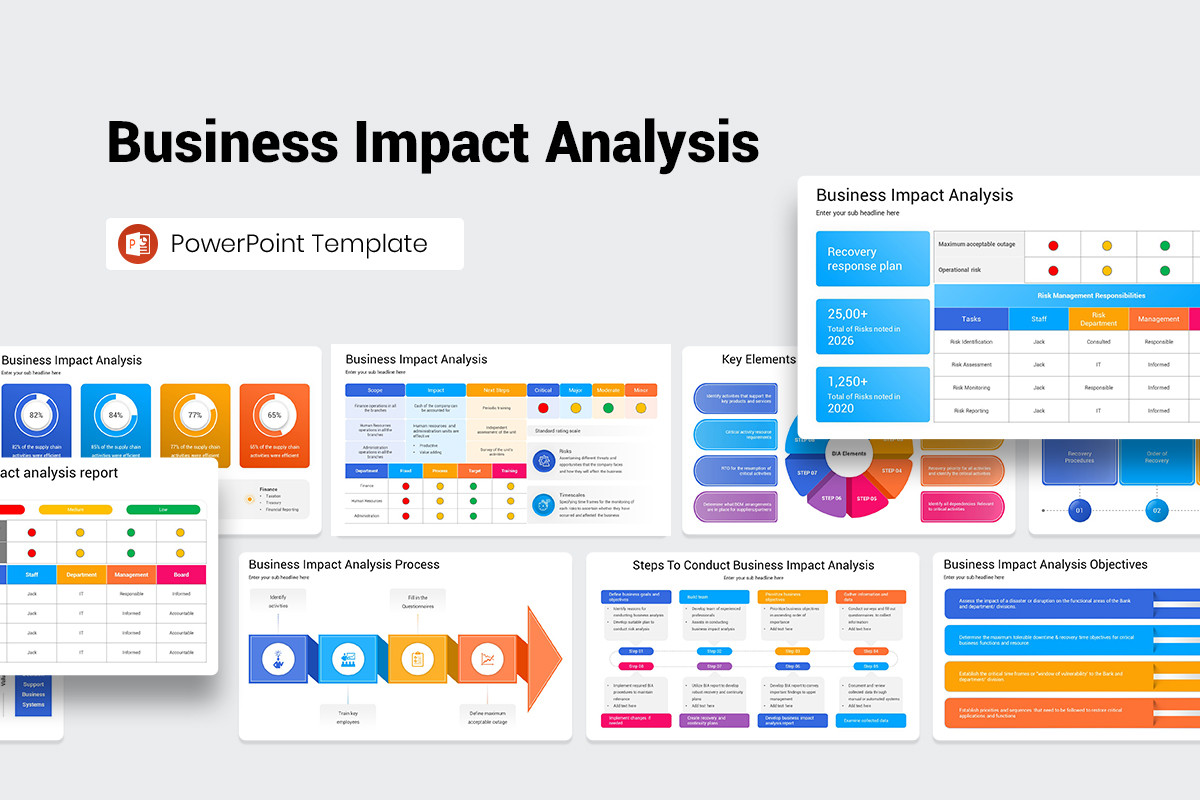
Creating a BIA from scratch is time‑consuming and error‑prone. A ready‑made template standardizes data collection, ensures completeness, and speeds up reporting. Additionally, it creates a common language for stakeholders—from executives to IT staff—making it easier to align on priorities and budgets.
Benefits of a Structured Template
- Consistent terminology and metrics across departments.
- Reduced risk of omitting critical data points.
- Facilitates regular updates and version control.
- Enables quick comparison of scenarios and historical trends.
Key Components of an Effective Template
A high‑quality template balances detail with usability. Below are the essential sections every BIA report must contain.
1. Executive Summary
Summarize the scope, methodology, and primary findings. This section should allow a C‑suite reader to grasp the impact scores and recommended actions within a few minutes.
2. Scope & Assumptions
Define the boundaries of the analysis—time horizon, geographic coverage, and included business units. State any assumptions about data availability or technology constraints.
3. Methodology
Describe how information was gathered: interviews, surveys, automated tools, or historical incident analysis. Clarify scoring systems, such as a 1‑10 impact scale.
4. Process Inventory
- List all core processes with unique identifiers.
- Include process owners, stakeholders, and involved systems.
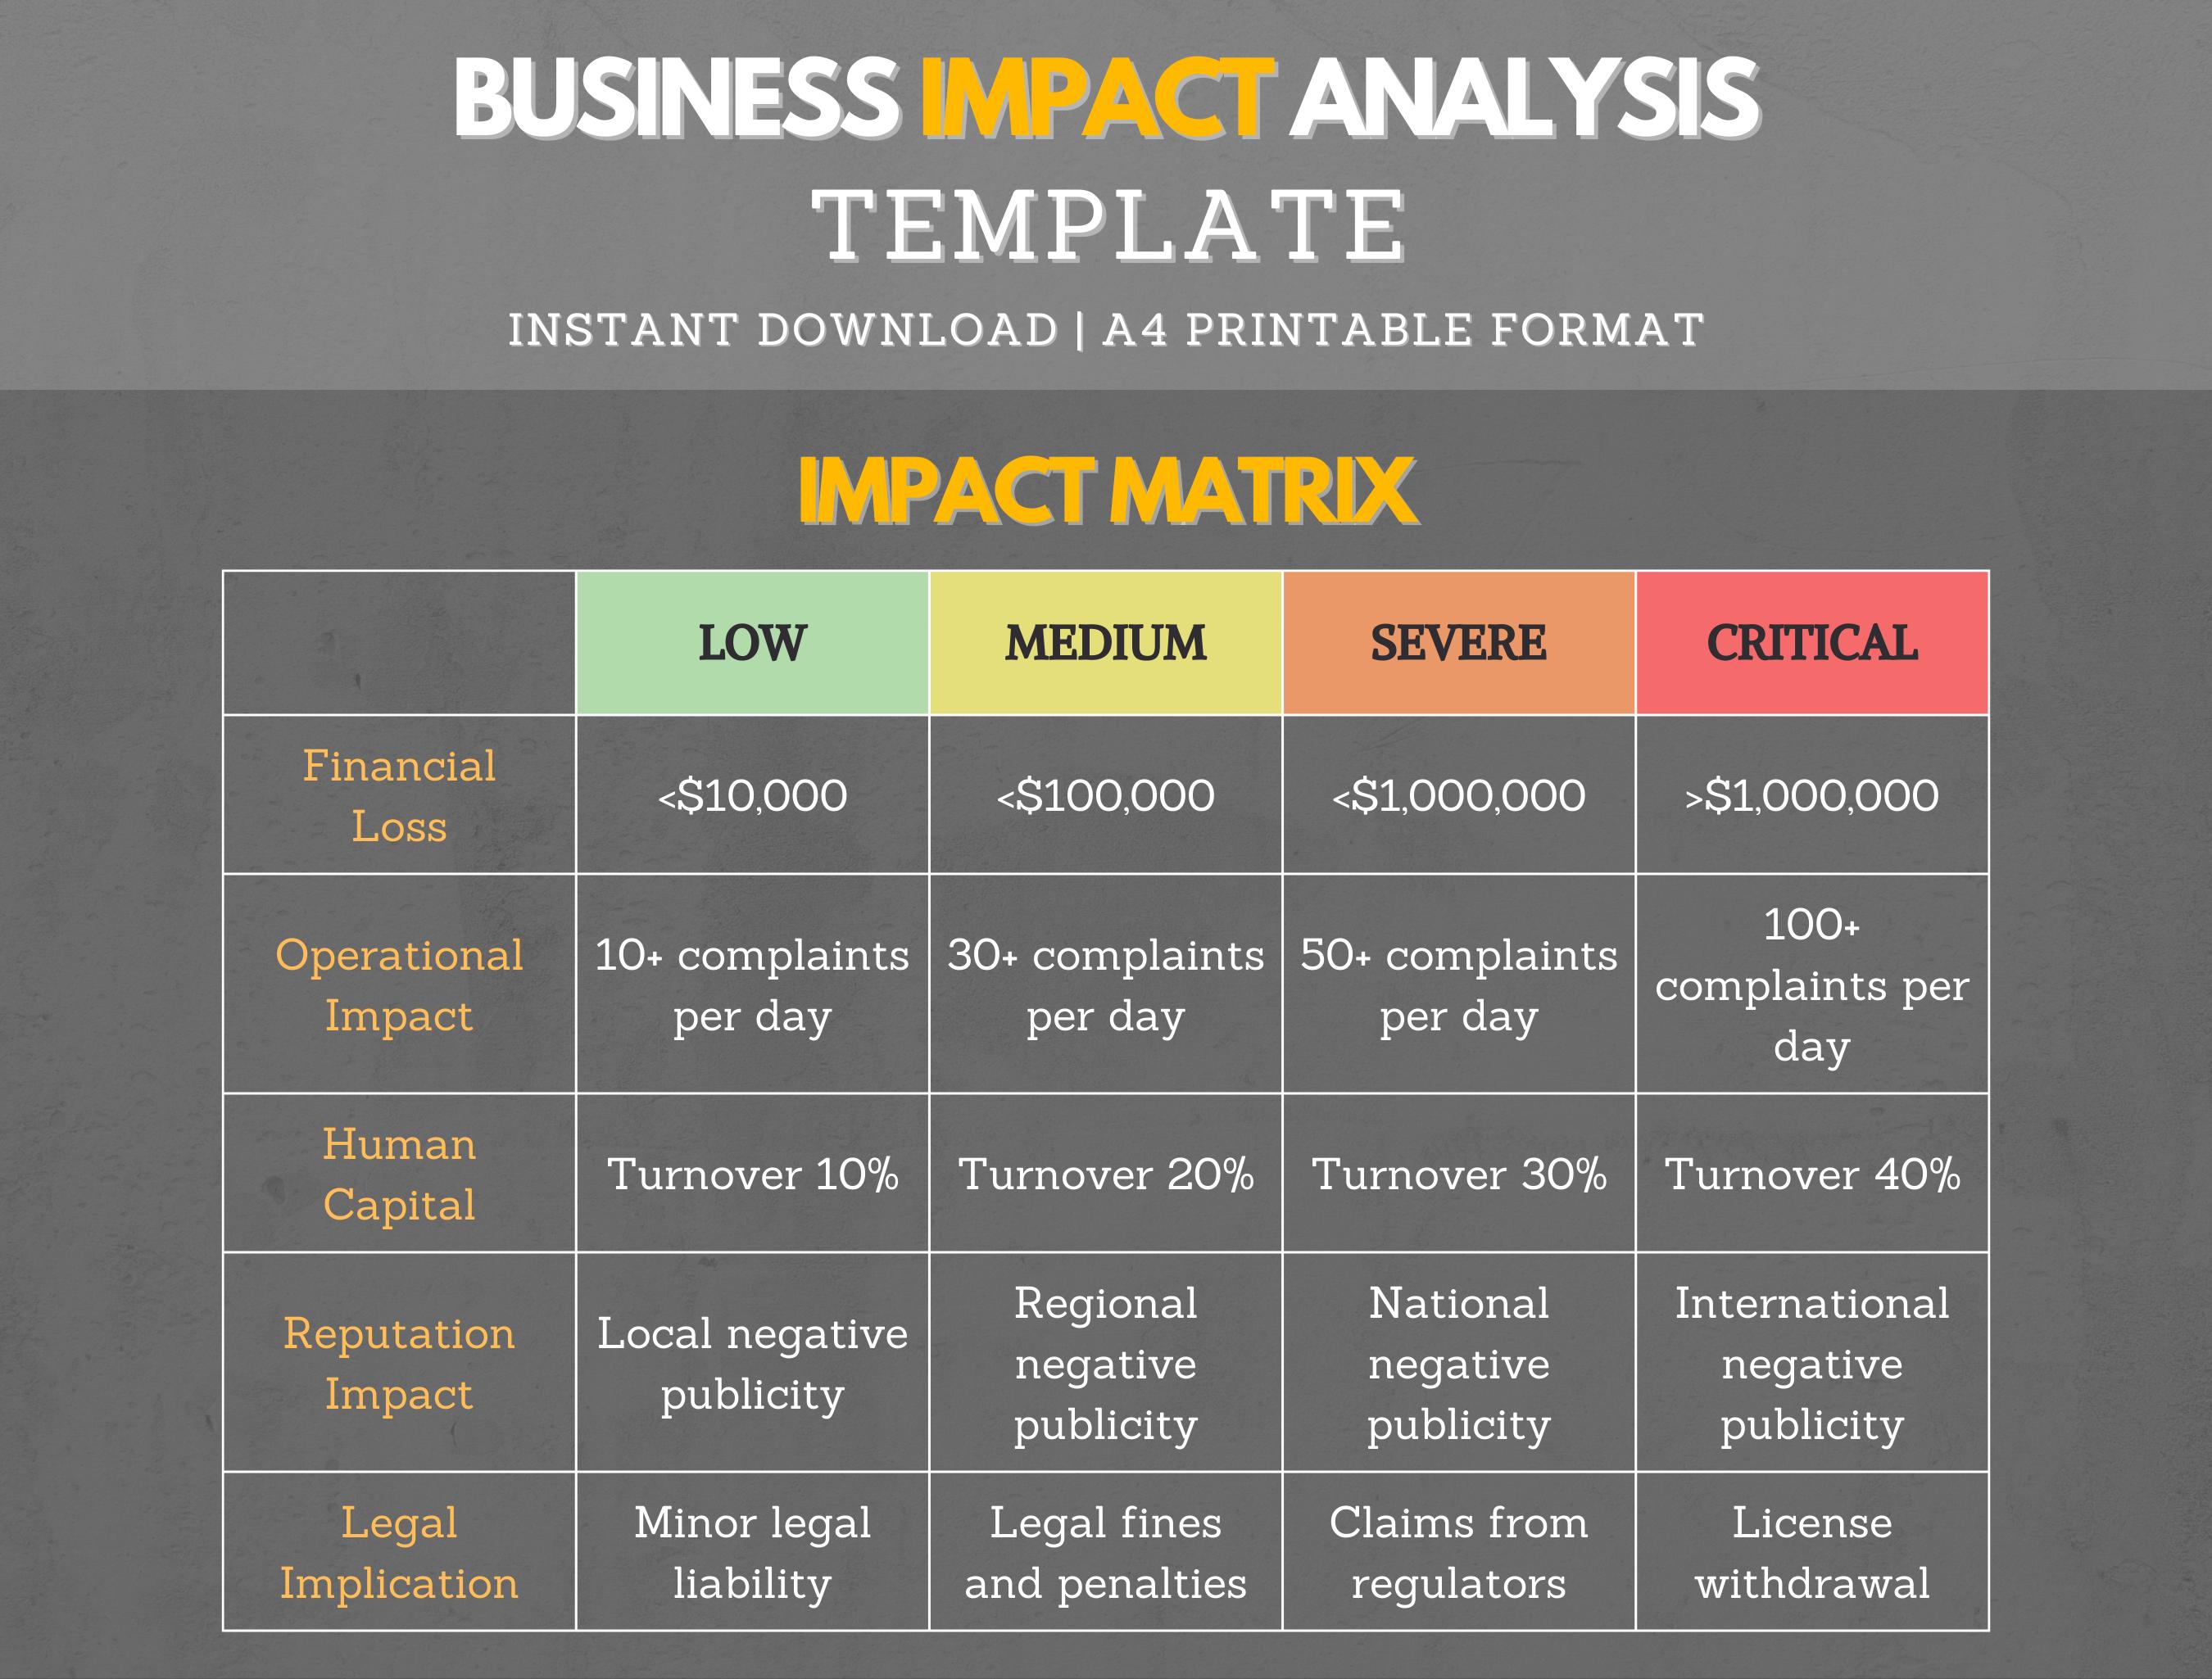
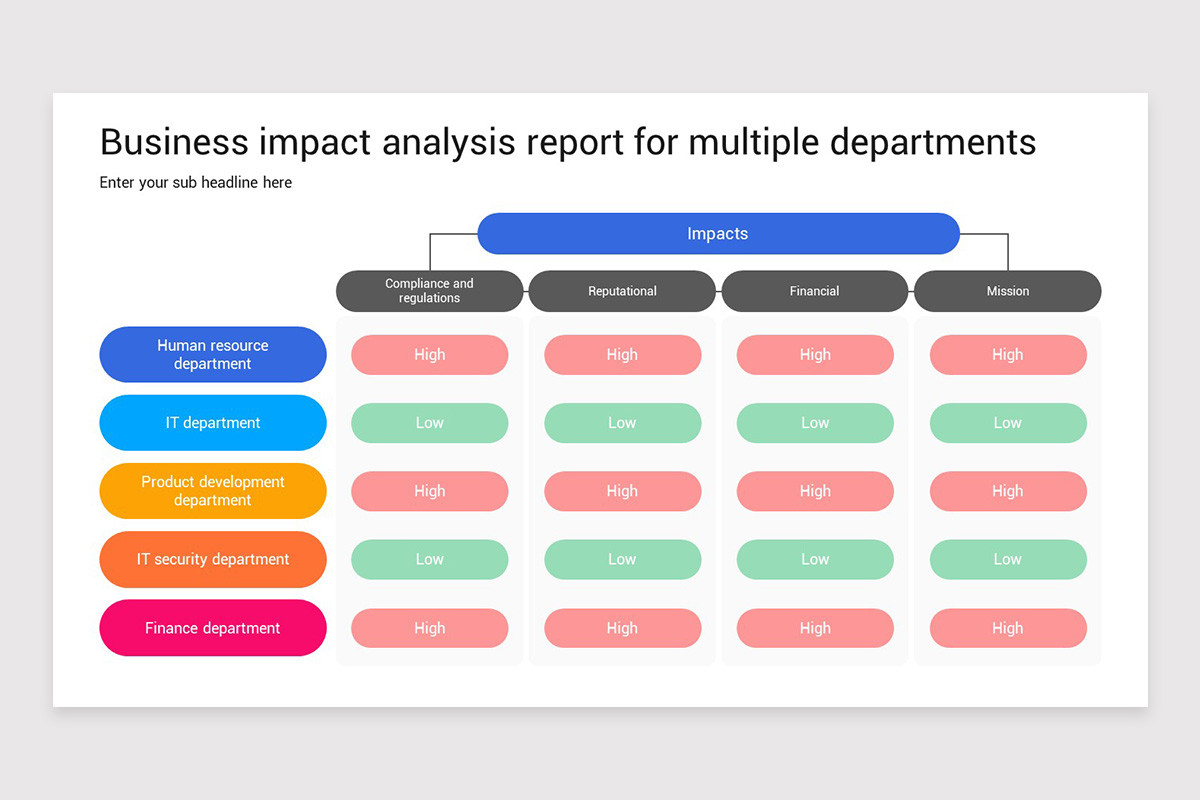
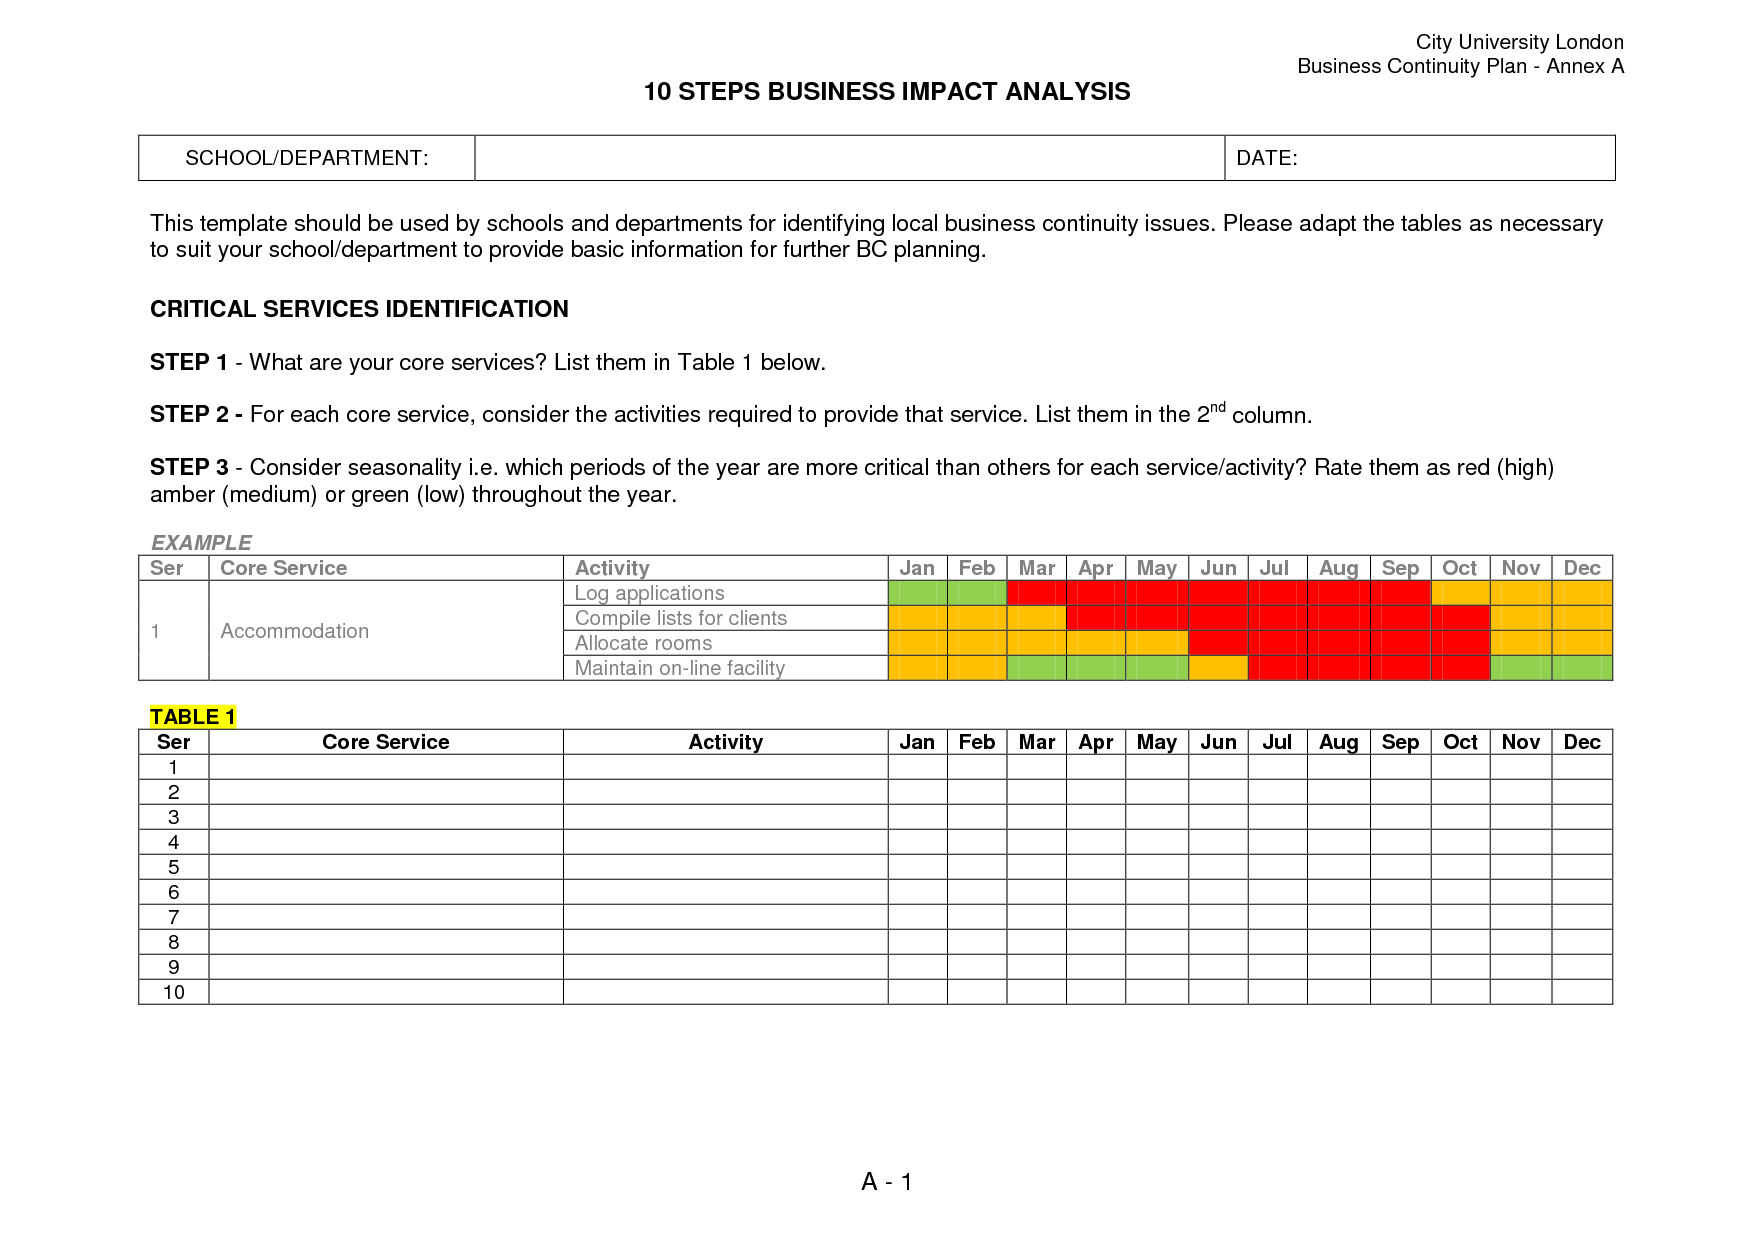
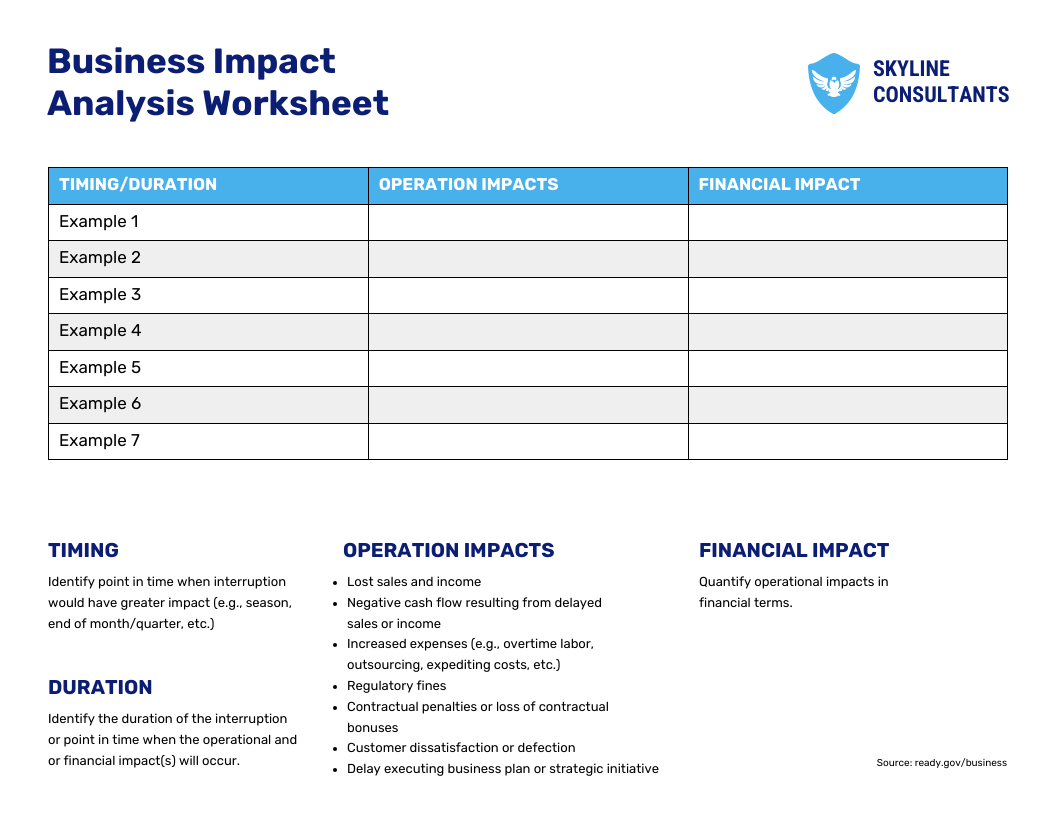
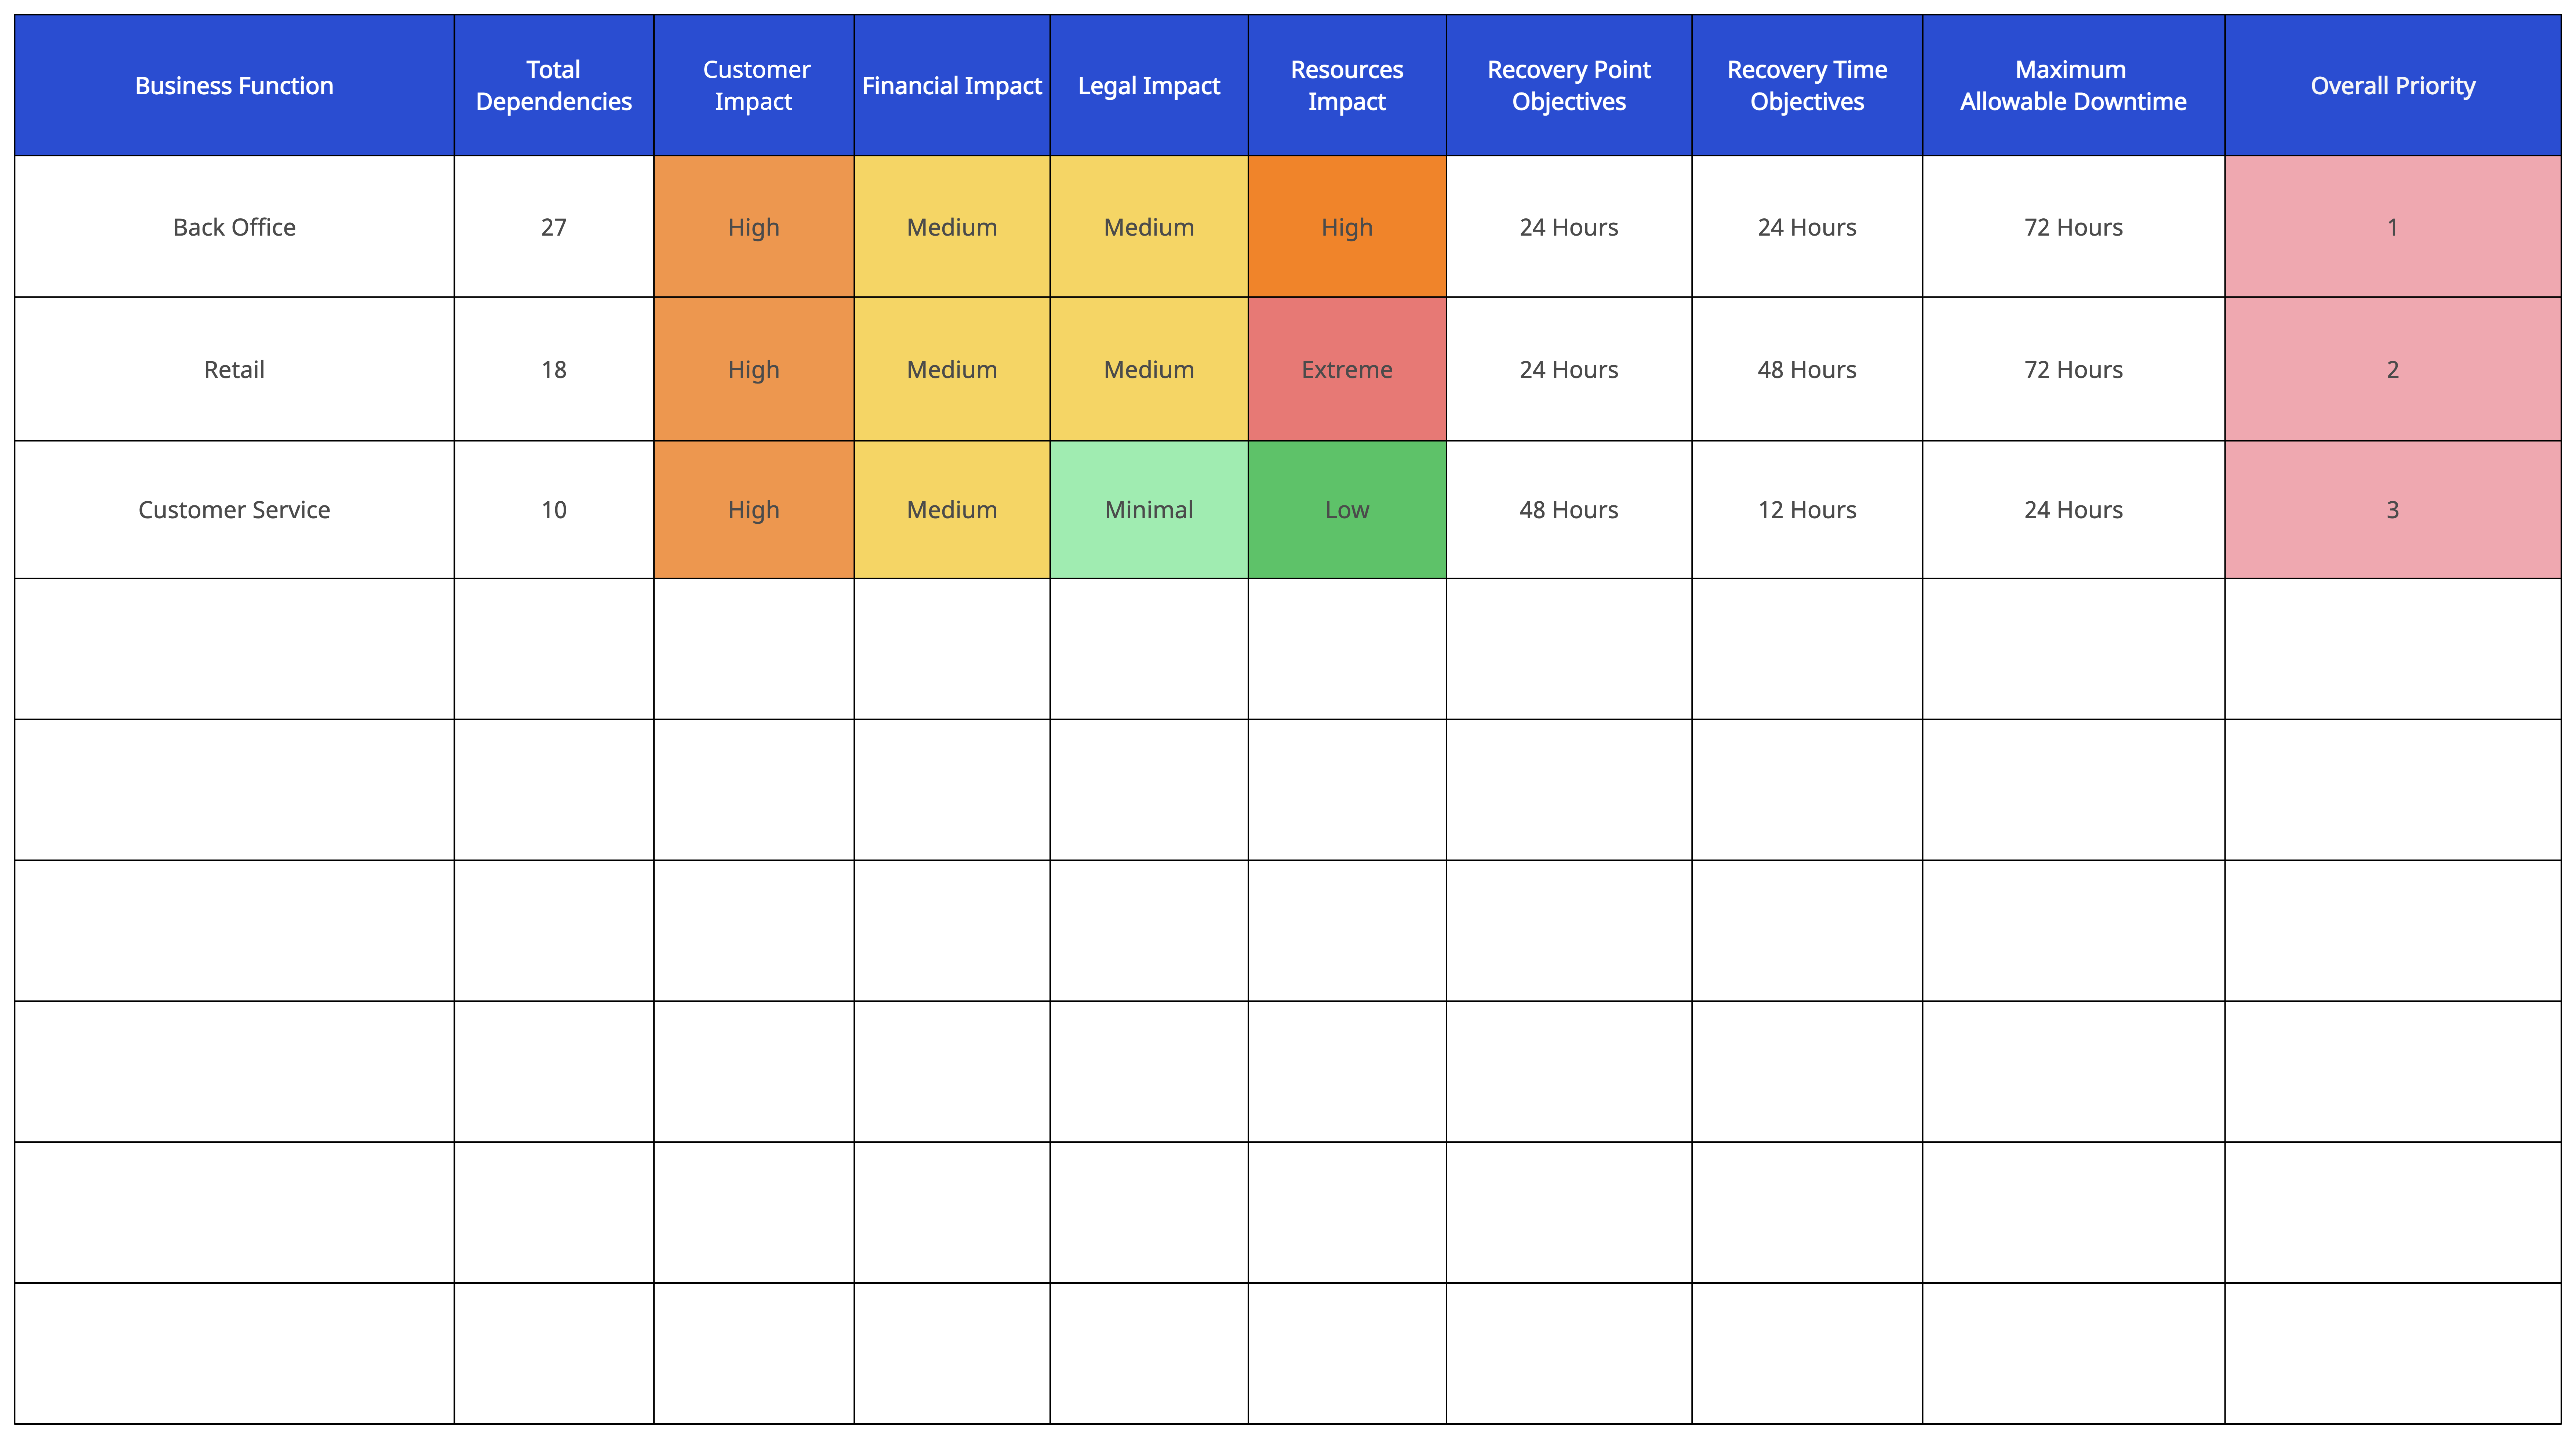
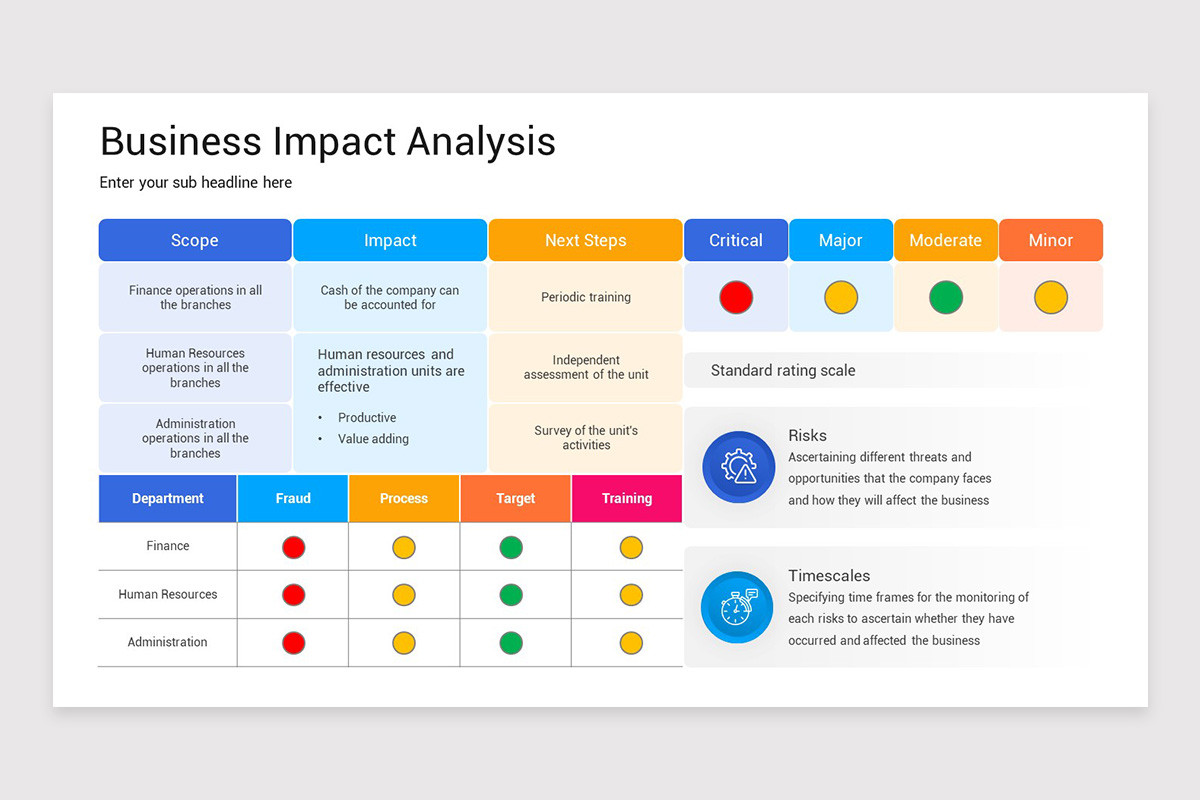
5. Impact Assessment Grid
For each process, assess:
- Financial impact (direct and indirect loss).
- Operational impact (service level degradation).
- Regulatory impact (non‑compliance penalties).
- Reputational impact (customer trust erosion).
6. Dependencies and Critical Resources
Identify people, equipment, third‑party services, and data repositories that support each process. Highlight any single points of failure.
7. Recovery Time and Point Objectives
Specify RTO and RPO values based on acceptable downtime and data loss thresholds. Align these with business priorities.
8. Mitigation Strategies
For each high‑impact process, propose recovery actions, responsible parties, and required resources. Include fallback plans and escalation paths.
9. Cost-Benefit Analysis
Estimate the cost of implementing each mitigation strategy versus the potential loss if the strategy is not enacted.
10. Action Plan & Timeline
Create a phased roadmap for implementing mitigation measures, assigning owners and deadlines.
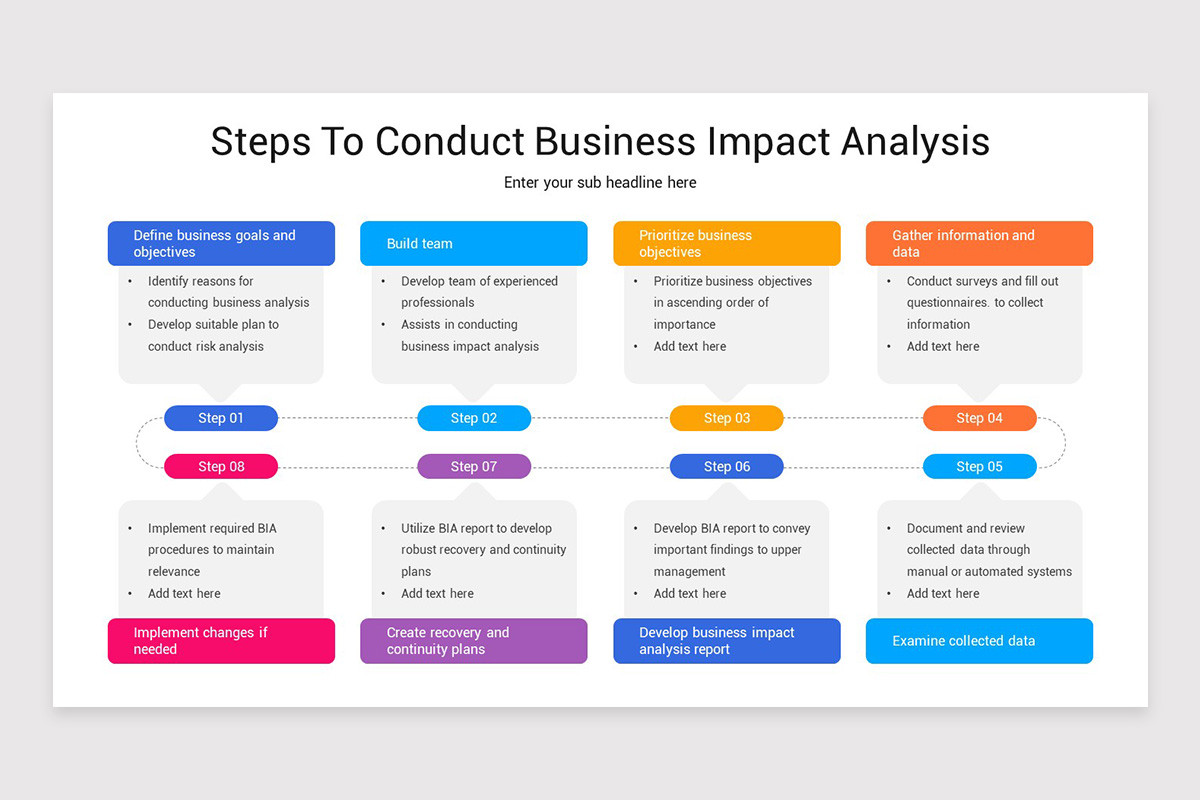
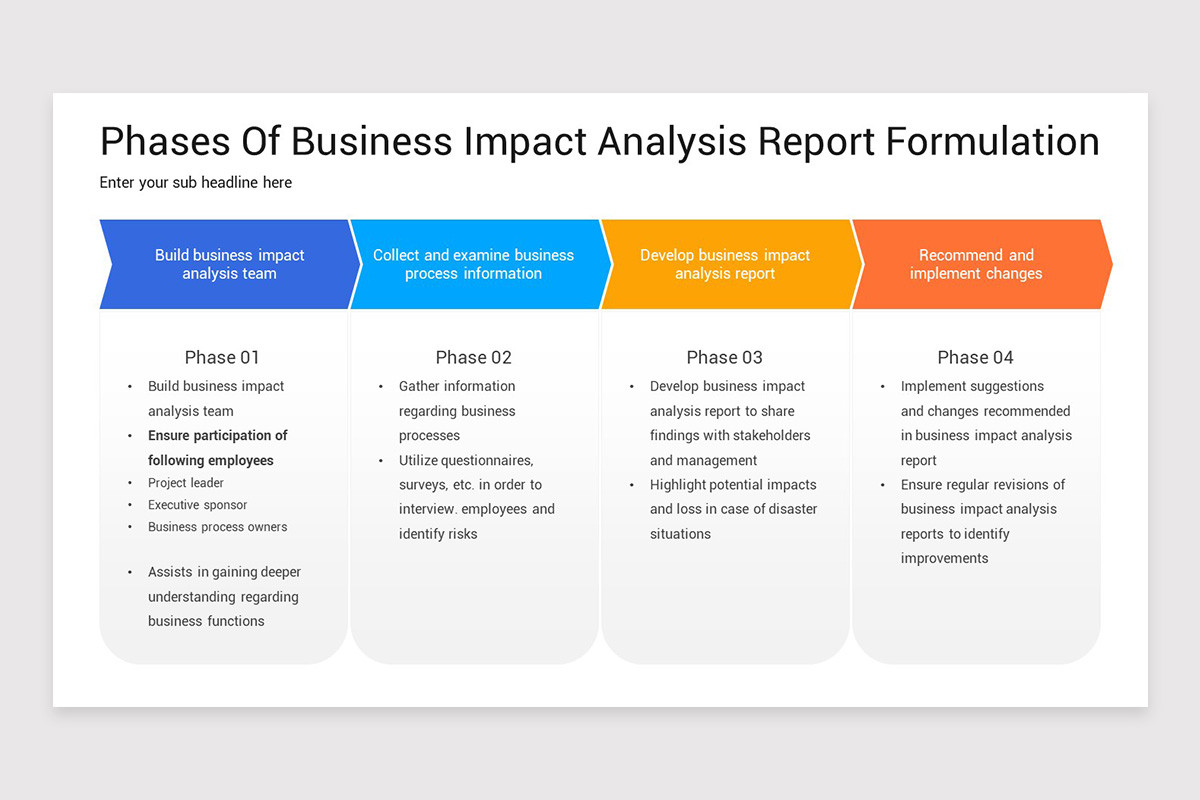
Step‑by‑Step Guide to Filling Out the Template
Below is a practical workflow that takes an organization from data collection to a finalized report.
Step 1: Assemble a Cross‑Functional Team
Include representatives from operations, IT, finance, legal, HR, and procurement. Their collective perspective ensures that all angles of impact are captured.
Step 2: Define the Evaluation Criteria
Agree on a scoring rubric for impact dimensions. For example, a 1‑5 scale where 5 equals catastrophic and 1 is negligible.
Step 3: Conduct Interviews and Surveys
Use structured questionnaires to gather quantitative and qualitative data. Document responses meticulously for later verification.
Step 4: Populate the Process Inventory
List each process with its description, owner, and criticality level. Ensure coverage of all business functions.
Step 5: Complete the Impact Assessment Grid
Apply the scoring rubric to each process. Cross‑verify with historical incident data or financial records where available.
Step 6: Map Dependencies
Use visual aids such as dependency matrices or flowcharts to illustrate interrelations. Highlight any critical single points of failure.
Step 7: Establish RTO and RPO Targets
Discuss with process owners to set realistic objectives. Document these in the template and justify each target with business rationale.
Step 8: Draft Mitigation Strategies
For high‑impact processes, brainstorm alternatives such as redundant systems, cloud backups, or manual workarounds. Record feasibility and cost.
Step 9: Perform Cost‑Benefit Analysis
Calculate the expected cost of disruption against mitigation expenses. Use simple formulas to keep the analysis transparent.
Step 10: Create the Action Plan
Define milestones, responsible owners, resource requirements, and timelines. Include a review schedule to keep the plan current.
Real‑World Example: Small Retail Company
Consider a mid‑size retail chain with 12 stores and an online presence. The BIA report identified the following high‑impact processes:
- Order Fulfillment – RTO: 4 hours; RPO: 15 minutes.
- Point of Sale (POS) System – RTO: 2 hours; RPO: 5 minutes.
- Inventory Management – RTO: 6 hours; RPO: 30 minutes.
Dependency mapping revealed that the POS system relied on a single cloud service provider. The mitigation plan included setting up a secondary POS server with automatic failover, costing $12,000 annually, versus a potential daily revenue loss of $3,000 if the system were down. The cost-benefit analysis justified the investment, leading to a swift implementation within three months.
Integrating the Template into Your Business Continuity Plan
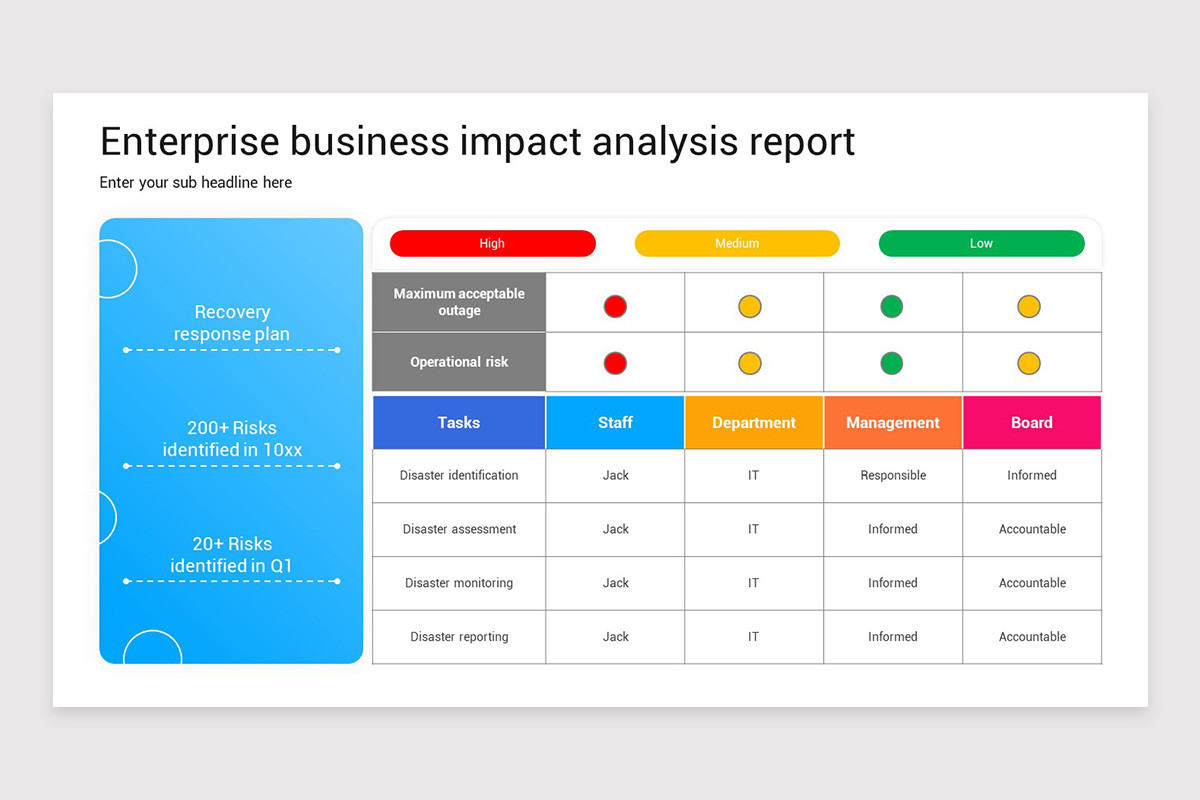
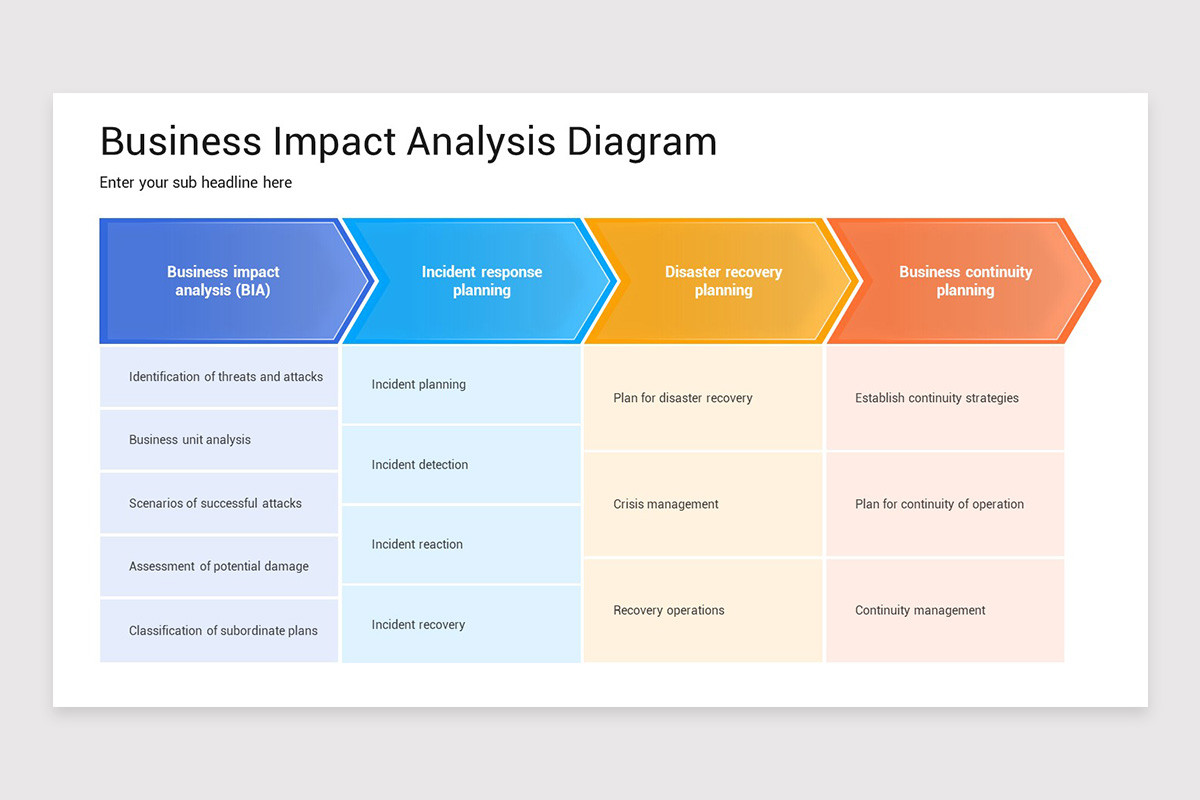
The BIA report is a foundational component of the broader BCP. Once the template is populated:
1. Align with Risk Management Initiatives
Use BIA findings to prioritize risk mitigation efforts and allocate resources accordingly.
2. Update the Incident Response Plan
Translate RTO/RPO targets into specific response actions and escalation procedures.
3. Conduct Regular Testing
Run tabletop exercises and simulations to validate assumptions and refine recovery strategies.
4. Maintain Version Control
Store the BIA report in a centralized repository and schedule quarterly reviews, especially after major changes such as new hires, technology upgrades, or regulatory updates.
Common Mistakes to Avoid

Even well‑intentioned BIAs can suffer from pitfalls that reduce their effectiveness.
Overlooking Low‑Visibility Processes
Processes that seem “non‑critical” may indirectly affect customer experience. Include all functions, no matter how minor they appear.
Using Arbitrary Scales
Adopt a consistent scoring method and ensure that all stakeholders agree on the interpretation of each score.
Ignoring Third‑Party Dependencies
Many organizations rely on external vendors. Their availability can be a significant risk; document these relationships thoroughly.
Failing to Update the Template
A BIA is a living document. As markets, technology, and personnel change, so do the risks and recovery priorities.
Choosing the Right Tools and Resources
While a manual template works for small organizations, larger enterprises benefit from specialized software. Features to look for include:
- Data import/export capabilities for large spreadsheets.
- Built‑in risk scoring algorithms.
- Collaborative editing and version history.
- Automated reporting dashboards.
- Integration with incident management systems.
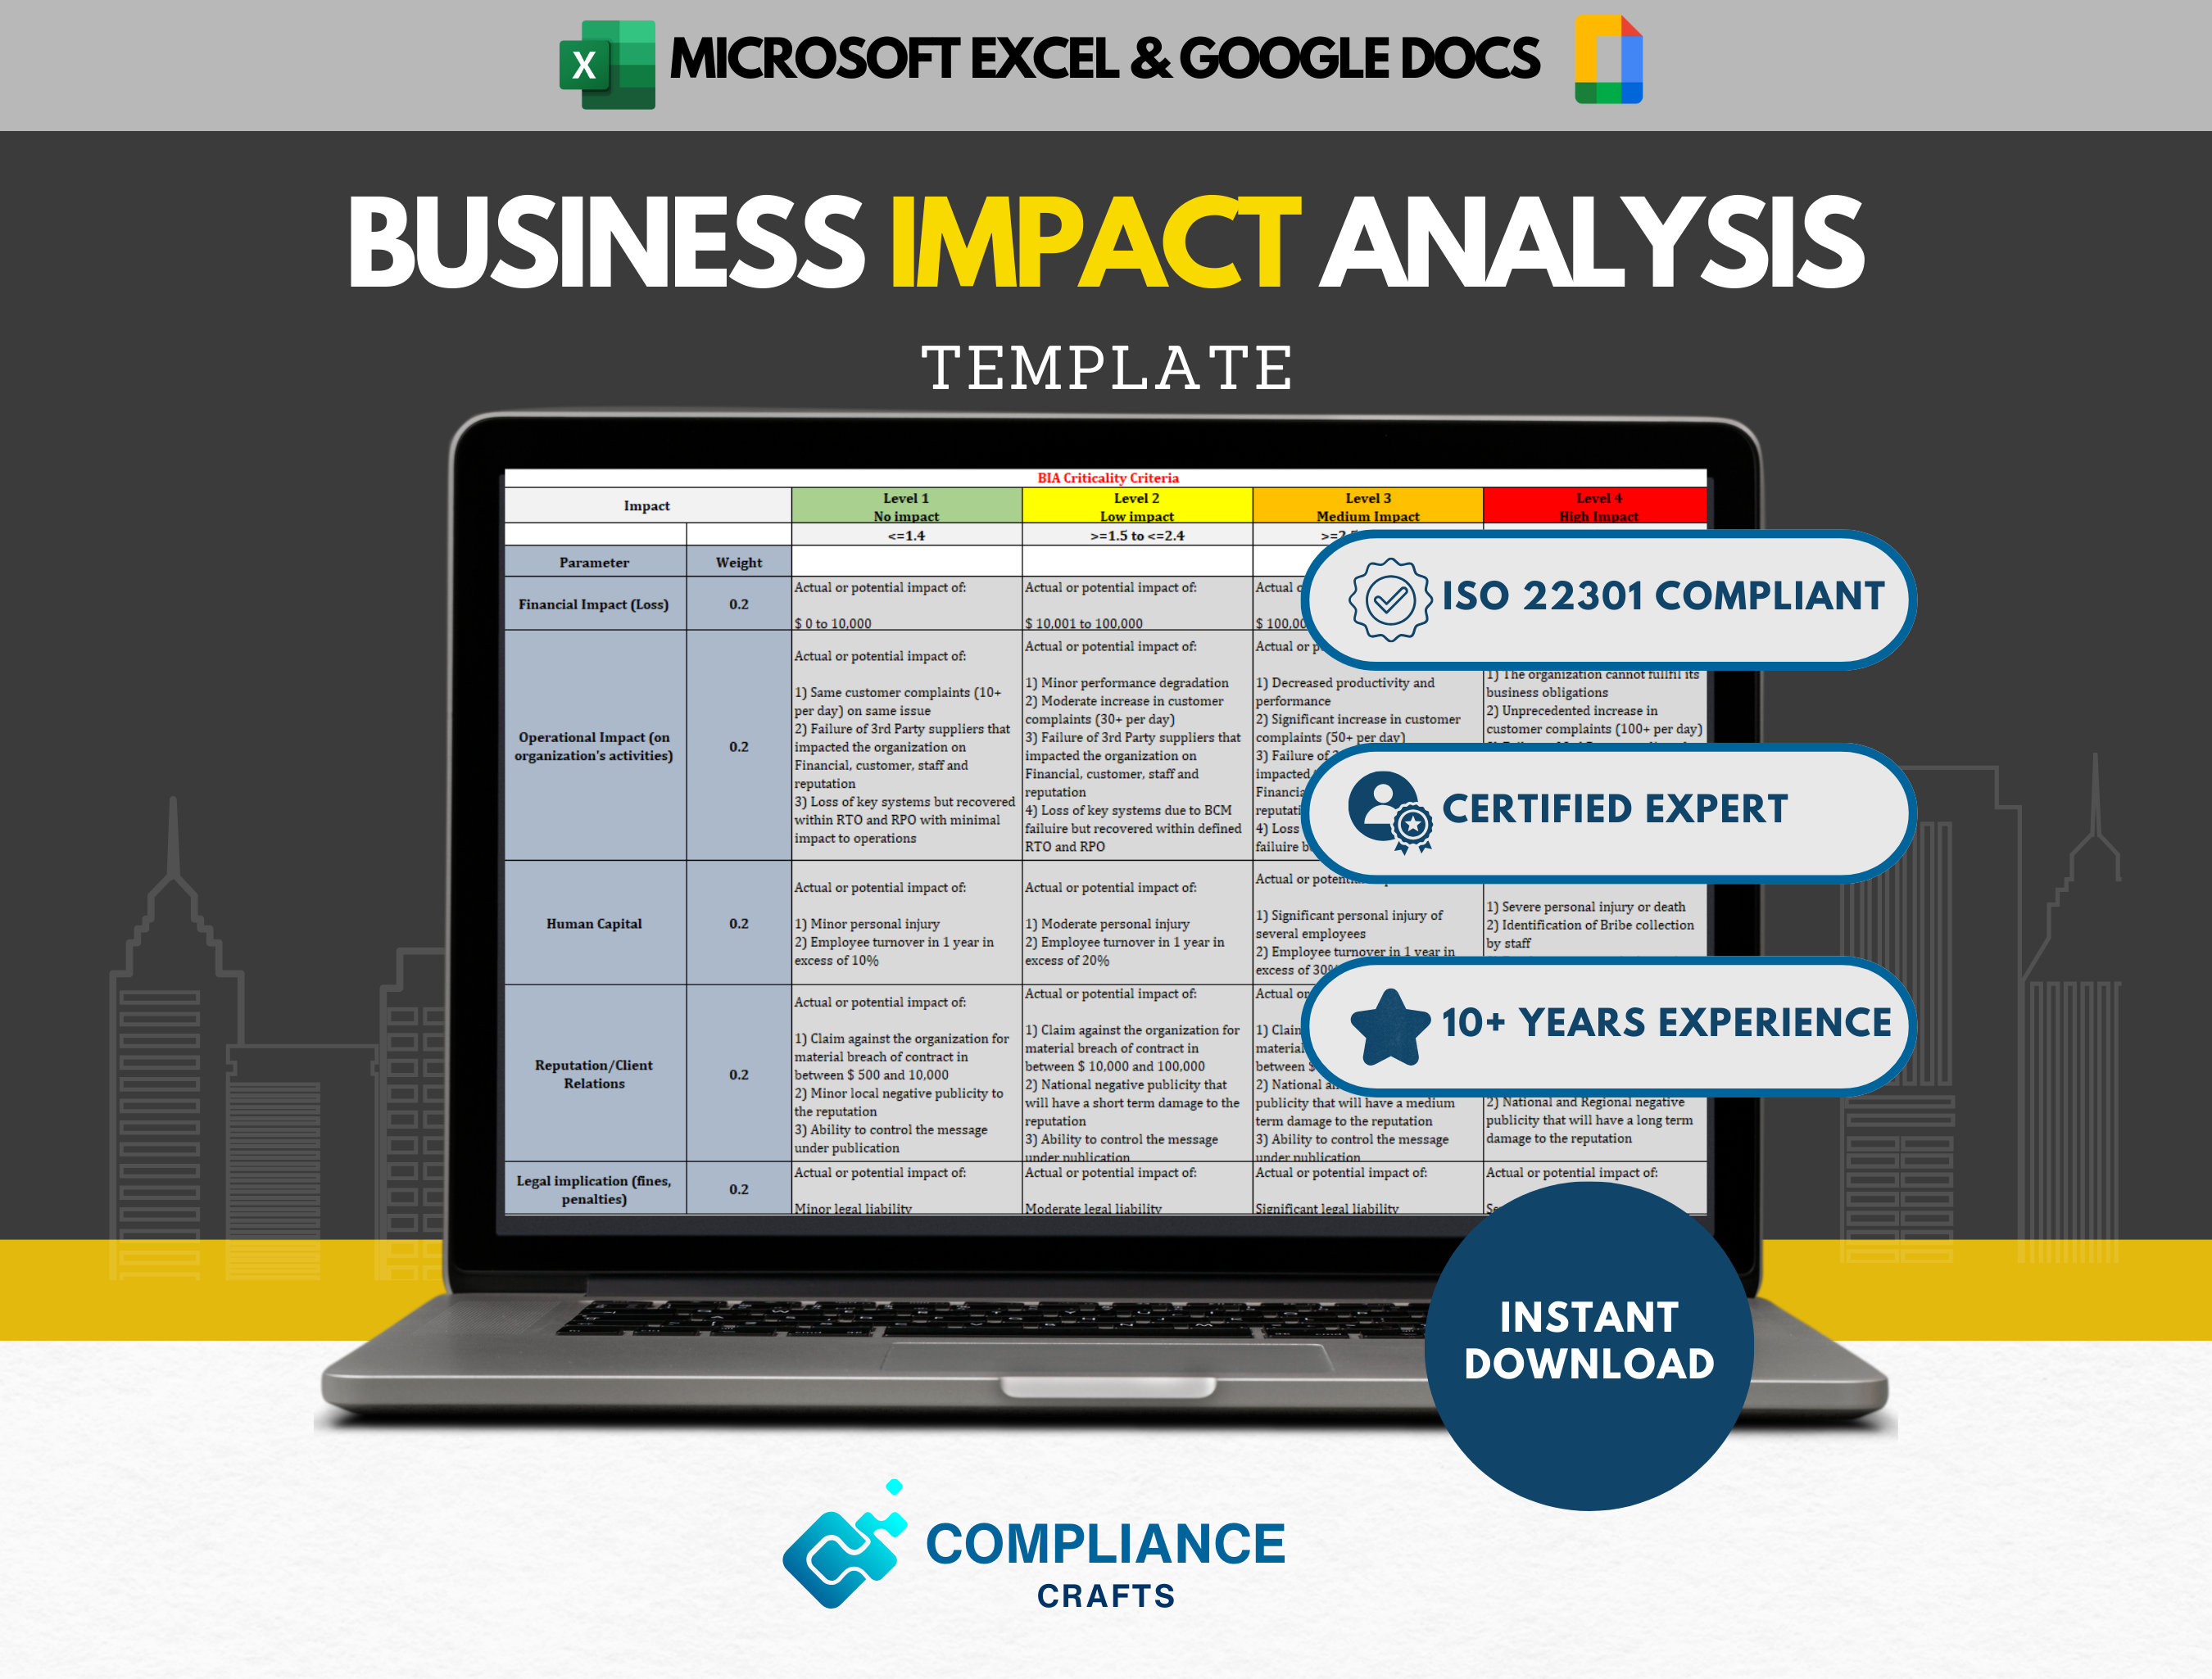
Many platforms also offer pre‑configured BIA templates aligned with standards such as ISO 22301 or NIST 800‑34, ensuring compliance while saving time.
Conclusion
A comprehensive Business Impact Analysis Report Template is the cornerstone of resilient operations. By systematically capturing process criticality, dependencies, and recovery objectives, organizations can quantify risks, prioritize investments, and craft a clear roadmap to continuity. Regularly revisiting the template, engaging cross‑functional teams, and integrating its findings into the broader business continuity framework transforms theoretical resilience into concrete preparedness. Armed with a well‑structured BIA report, businesses can face disruptions not with uncertainty but with confidence and clarity.
Related posts of "Business Impact Analysis Report Template"
