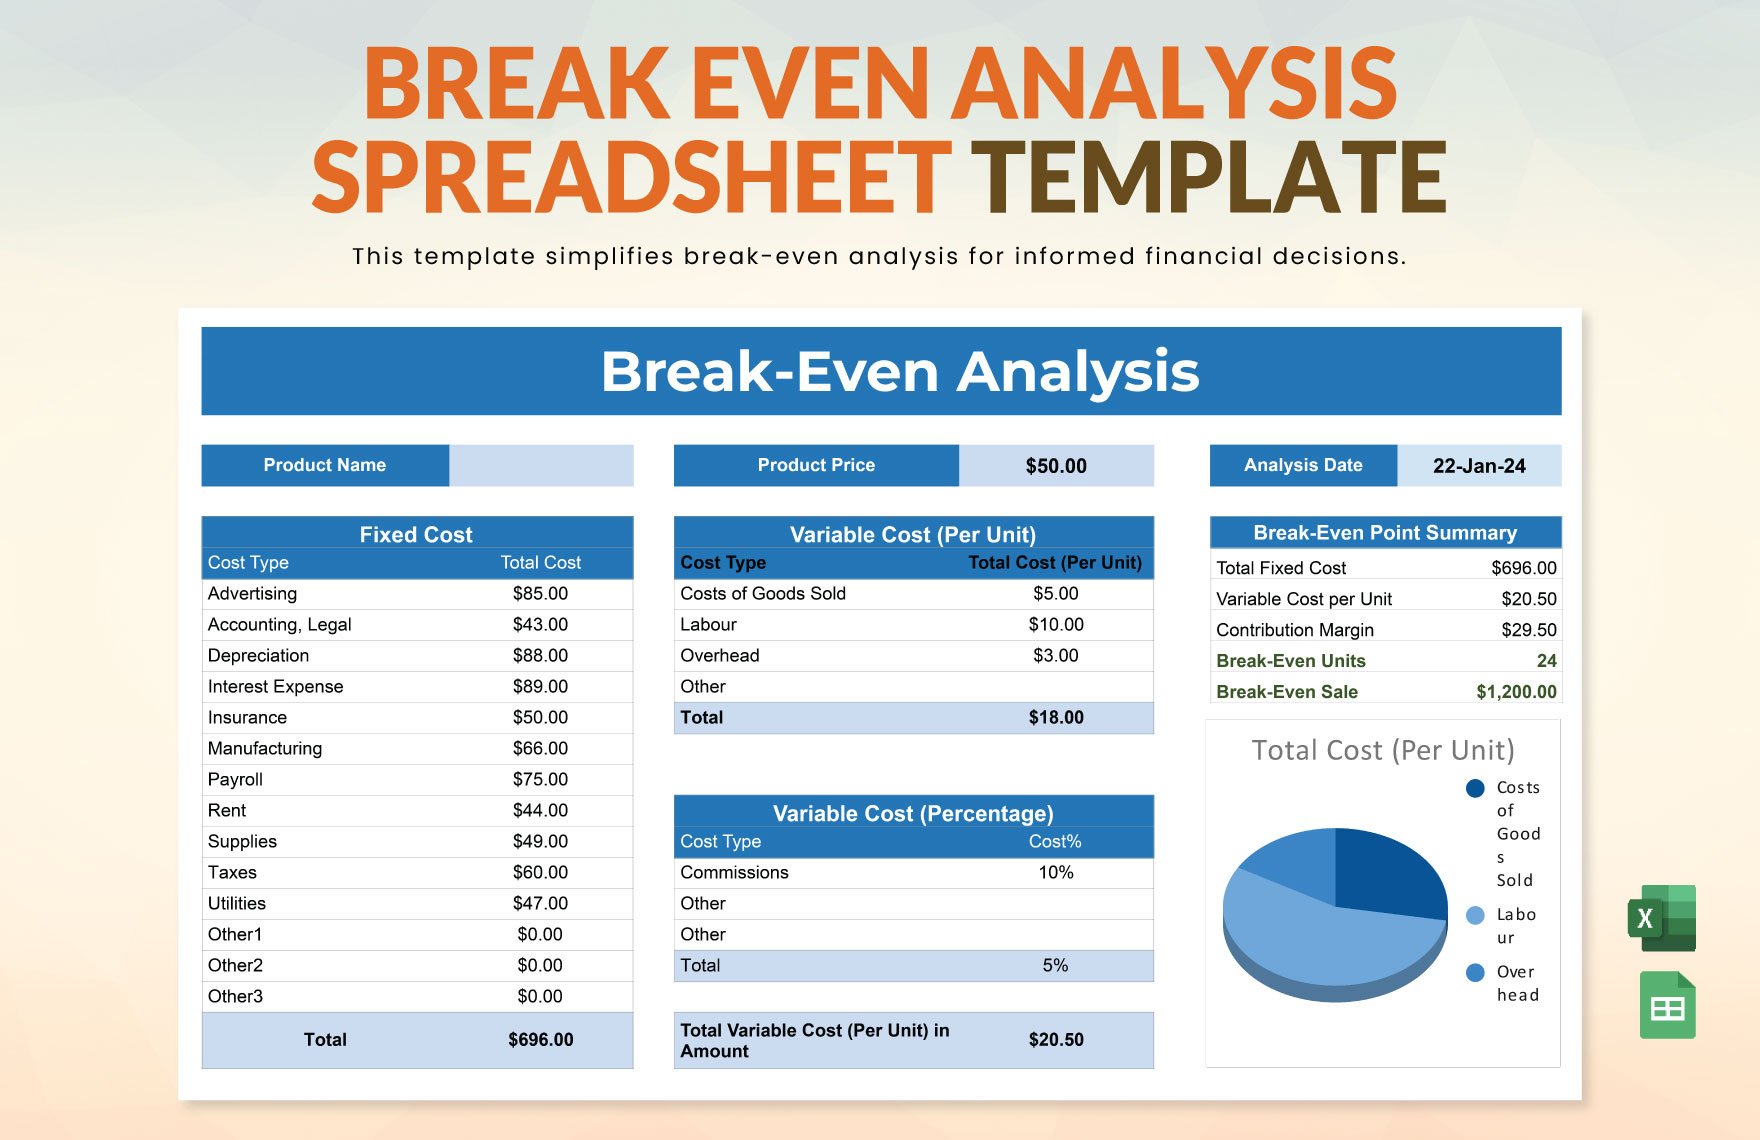
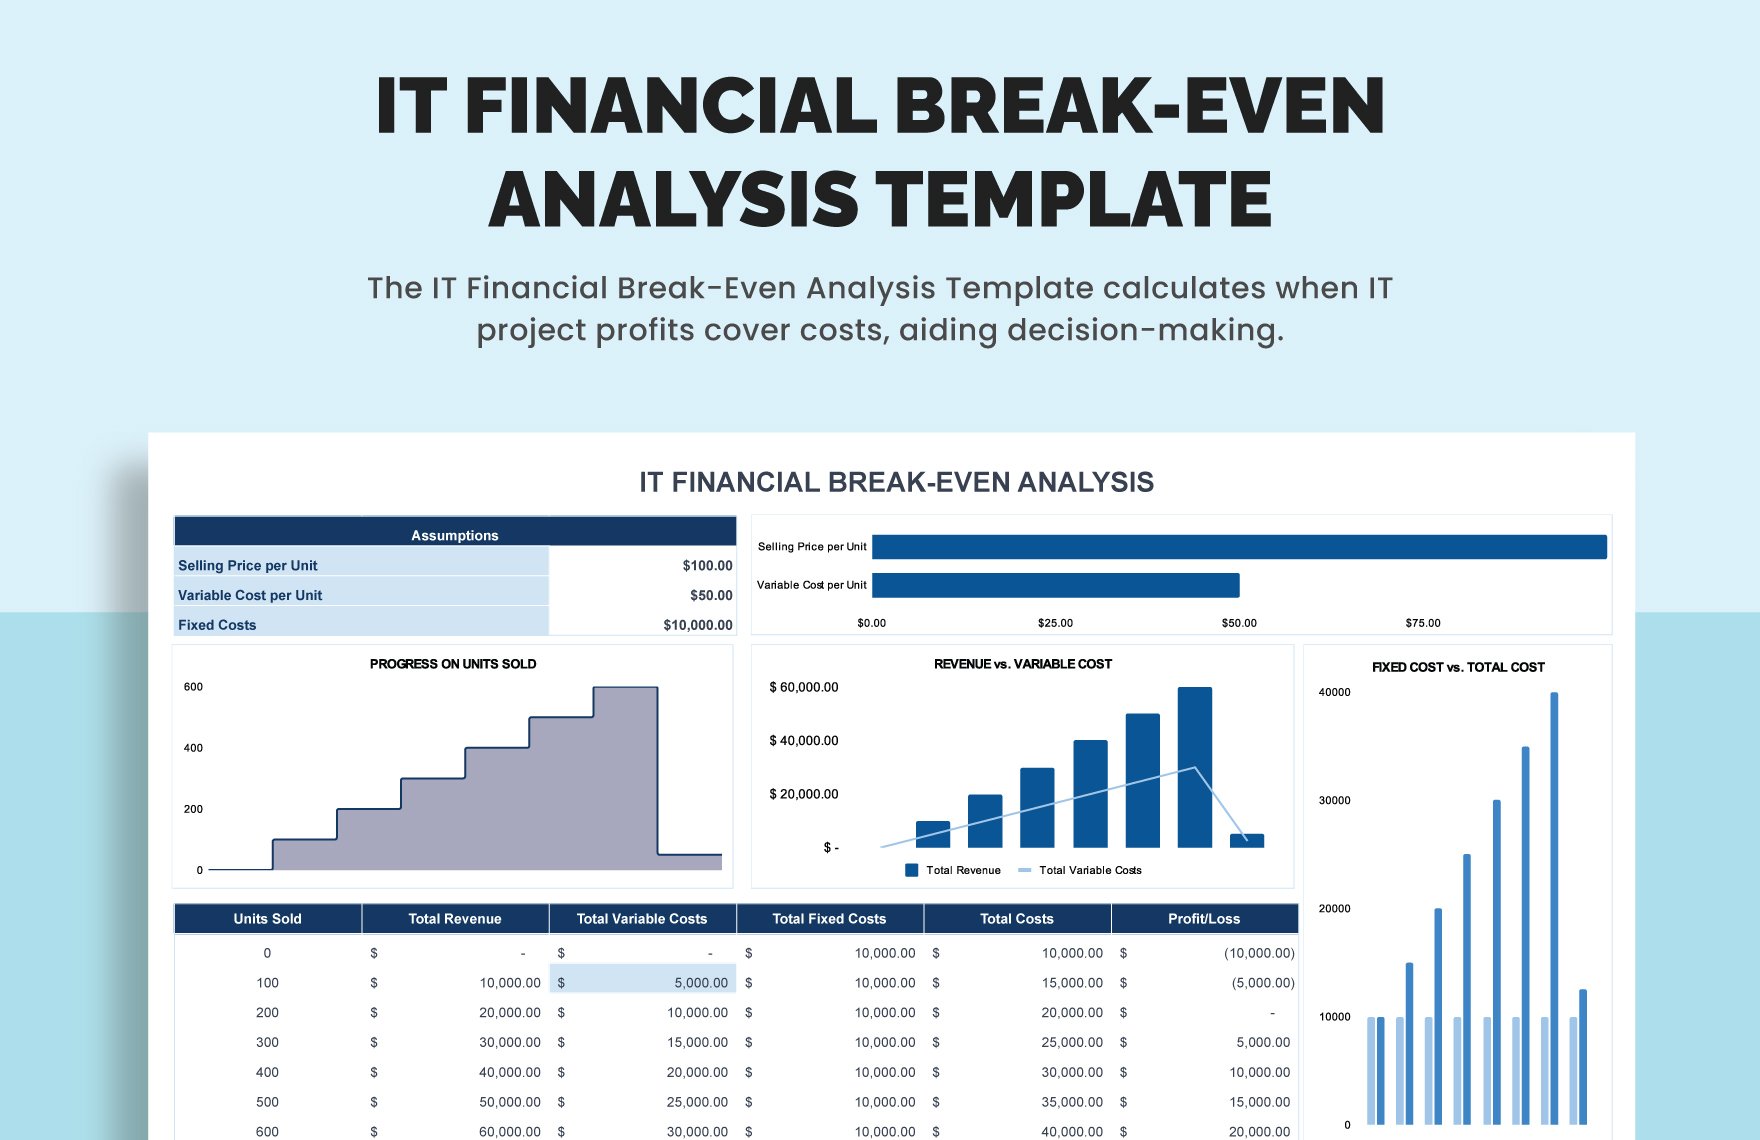
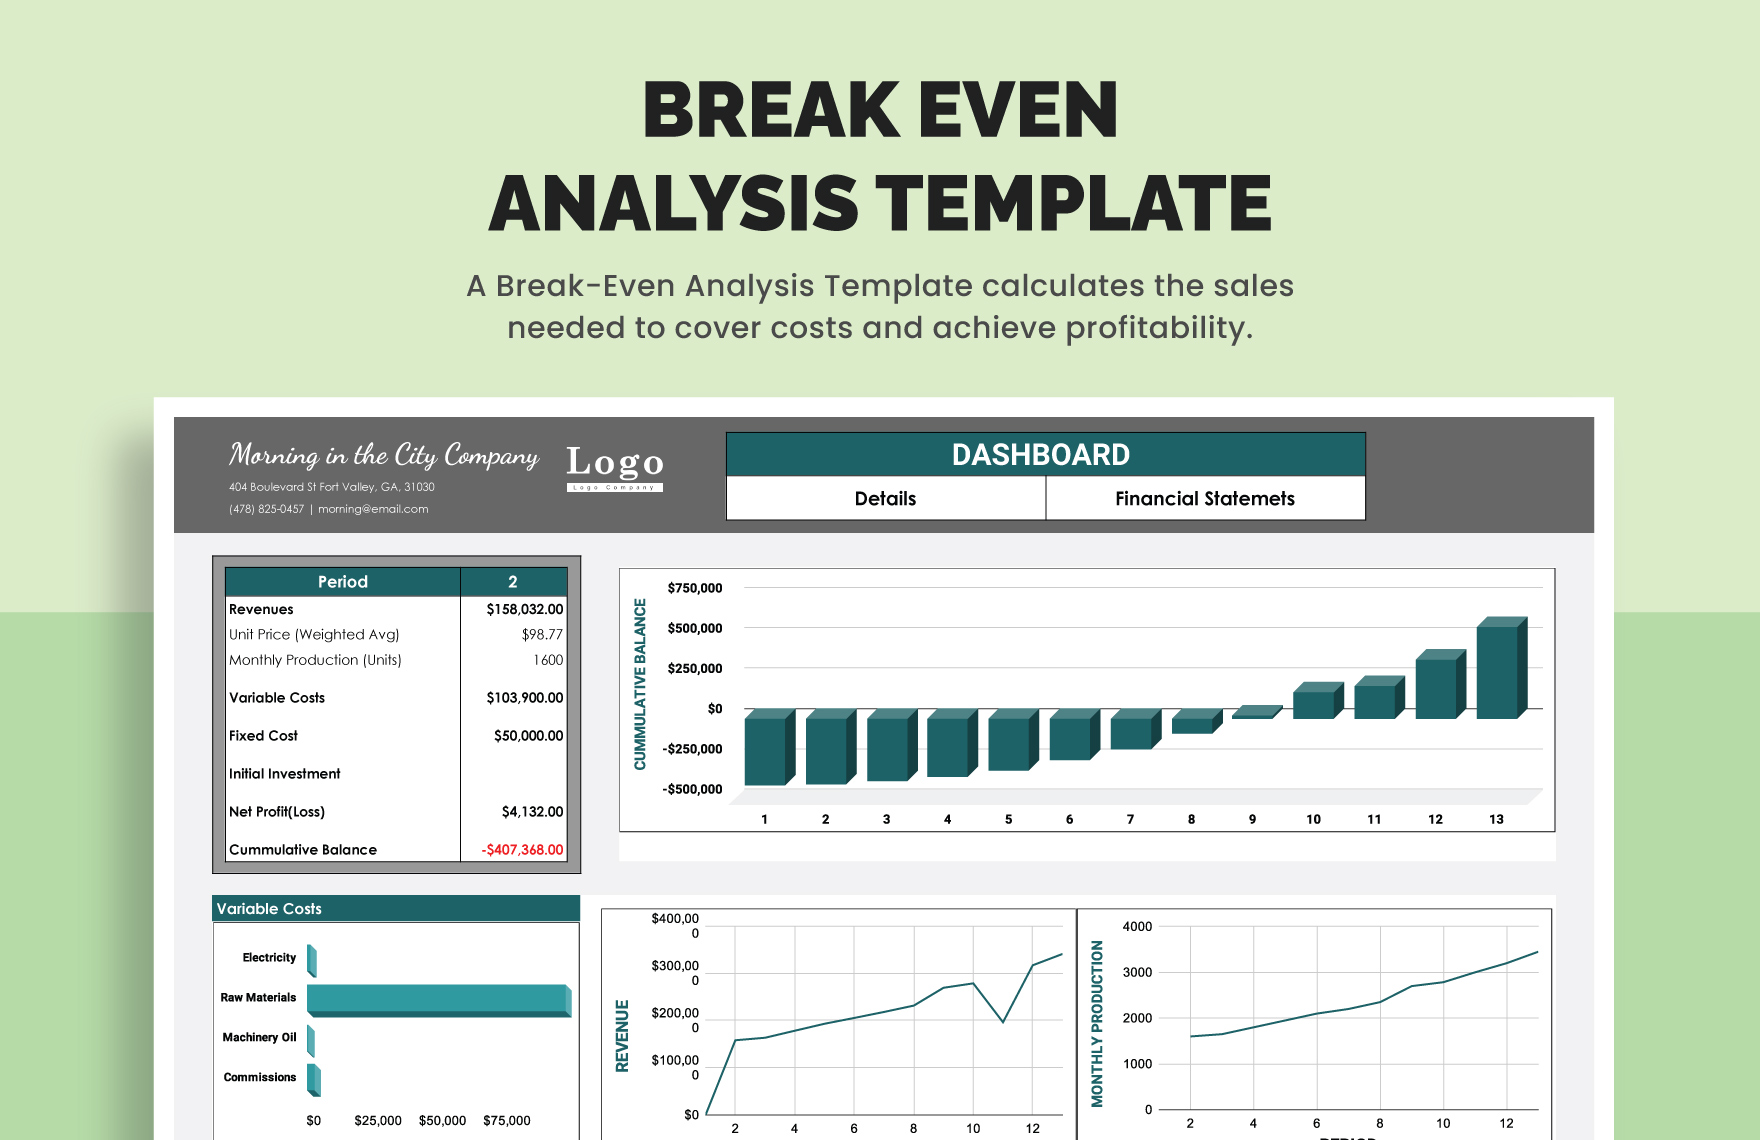
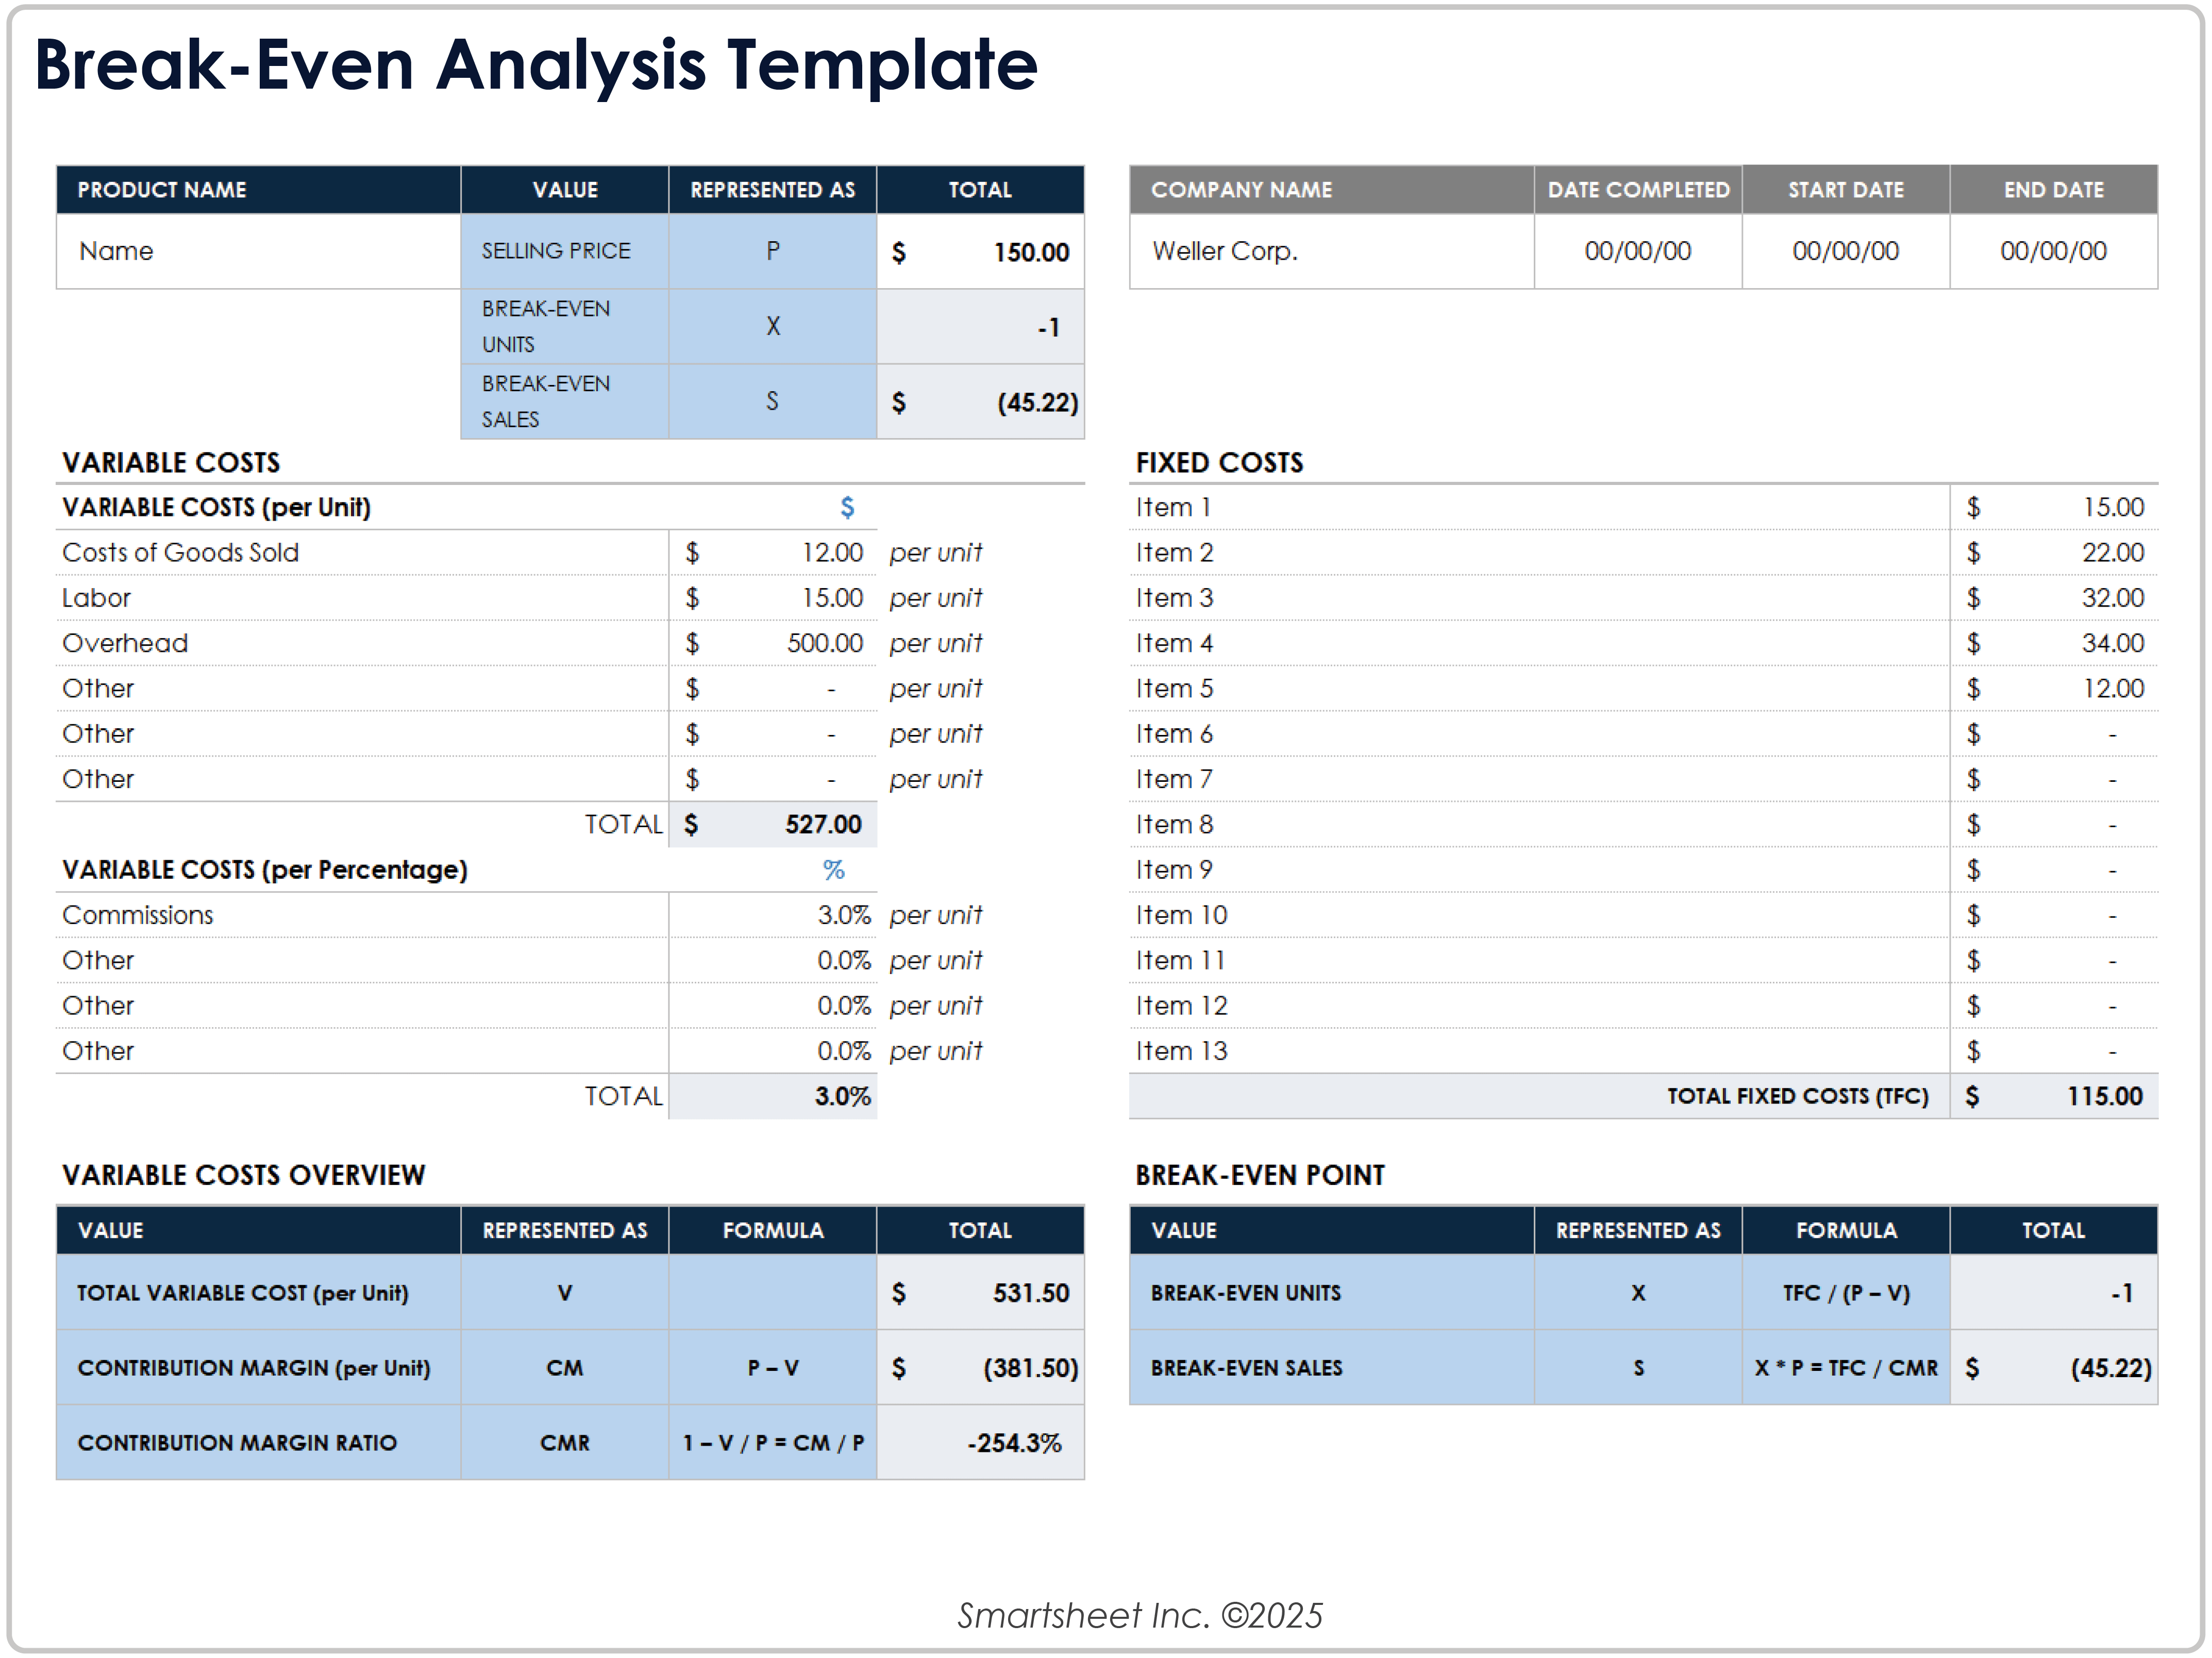
Break Even Analysis Template Business Plan is the cornerstone of any savvy entrepreneur’s financial toolkit, especially when navigating the fast‑paced markets of Asia where every yen, baht, or ringgit counts. Whether you are launching a tech startup in Singapore, opening a boutique café in Bangkok, or scaling a manufacturing operation in Ho Chi Minh City, a well‑crafted break‑even analysis not only demystifies profitability thresholds but also builds confidence among investors, banks, and partners.
Why a Break Even Analysis Is Essential for Asian Business Plans

In the dynamic economic landscape of Asia, businesses face unique challenges: rapid consumer trends, diverse regulatory environments, and intense competition across both online and offline channels. A break‑even analysis helps you:
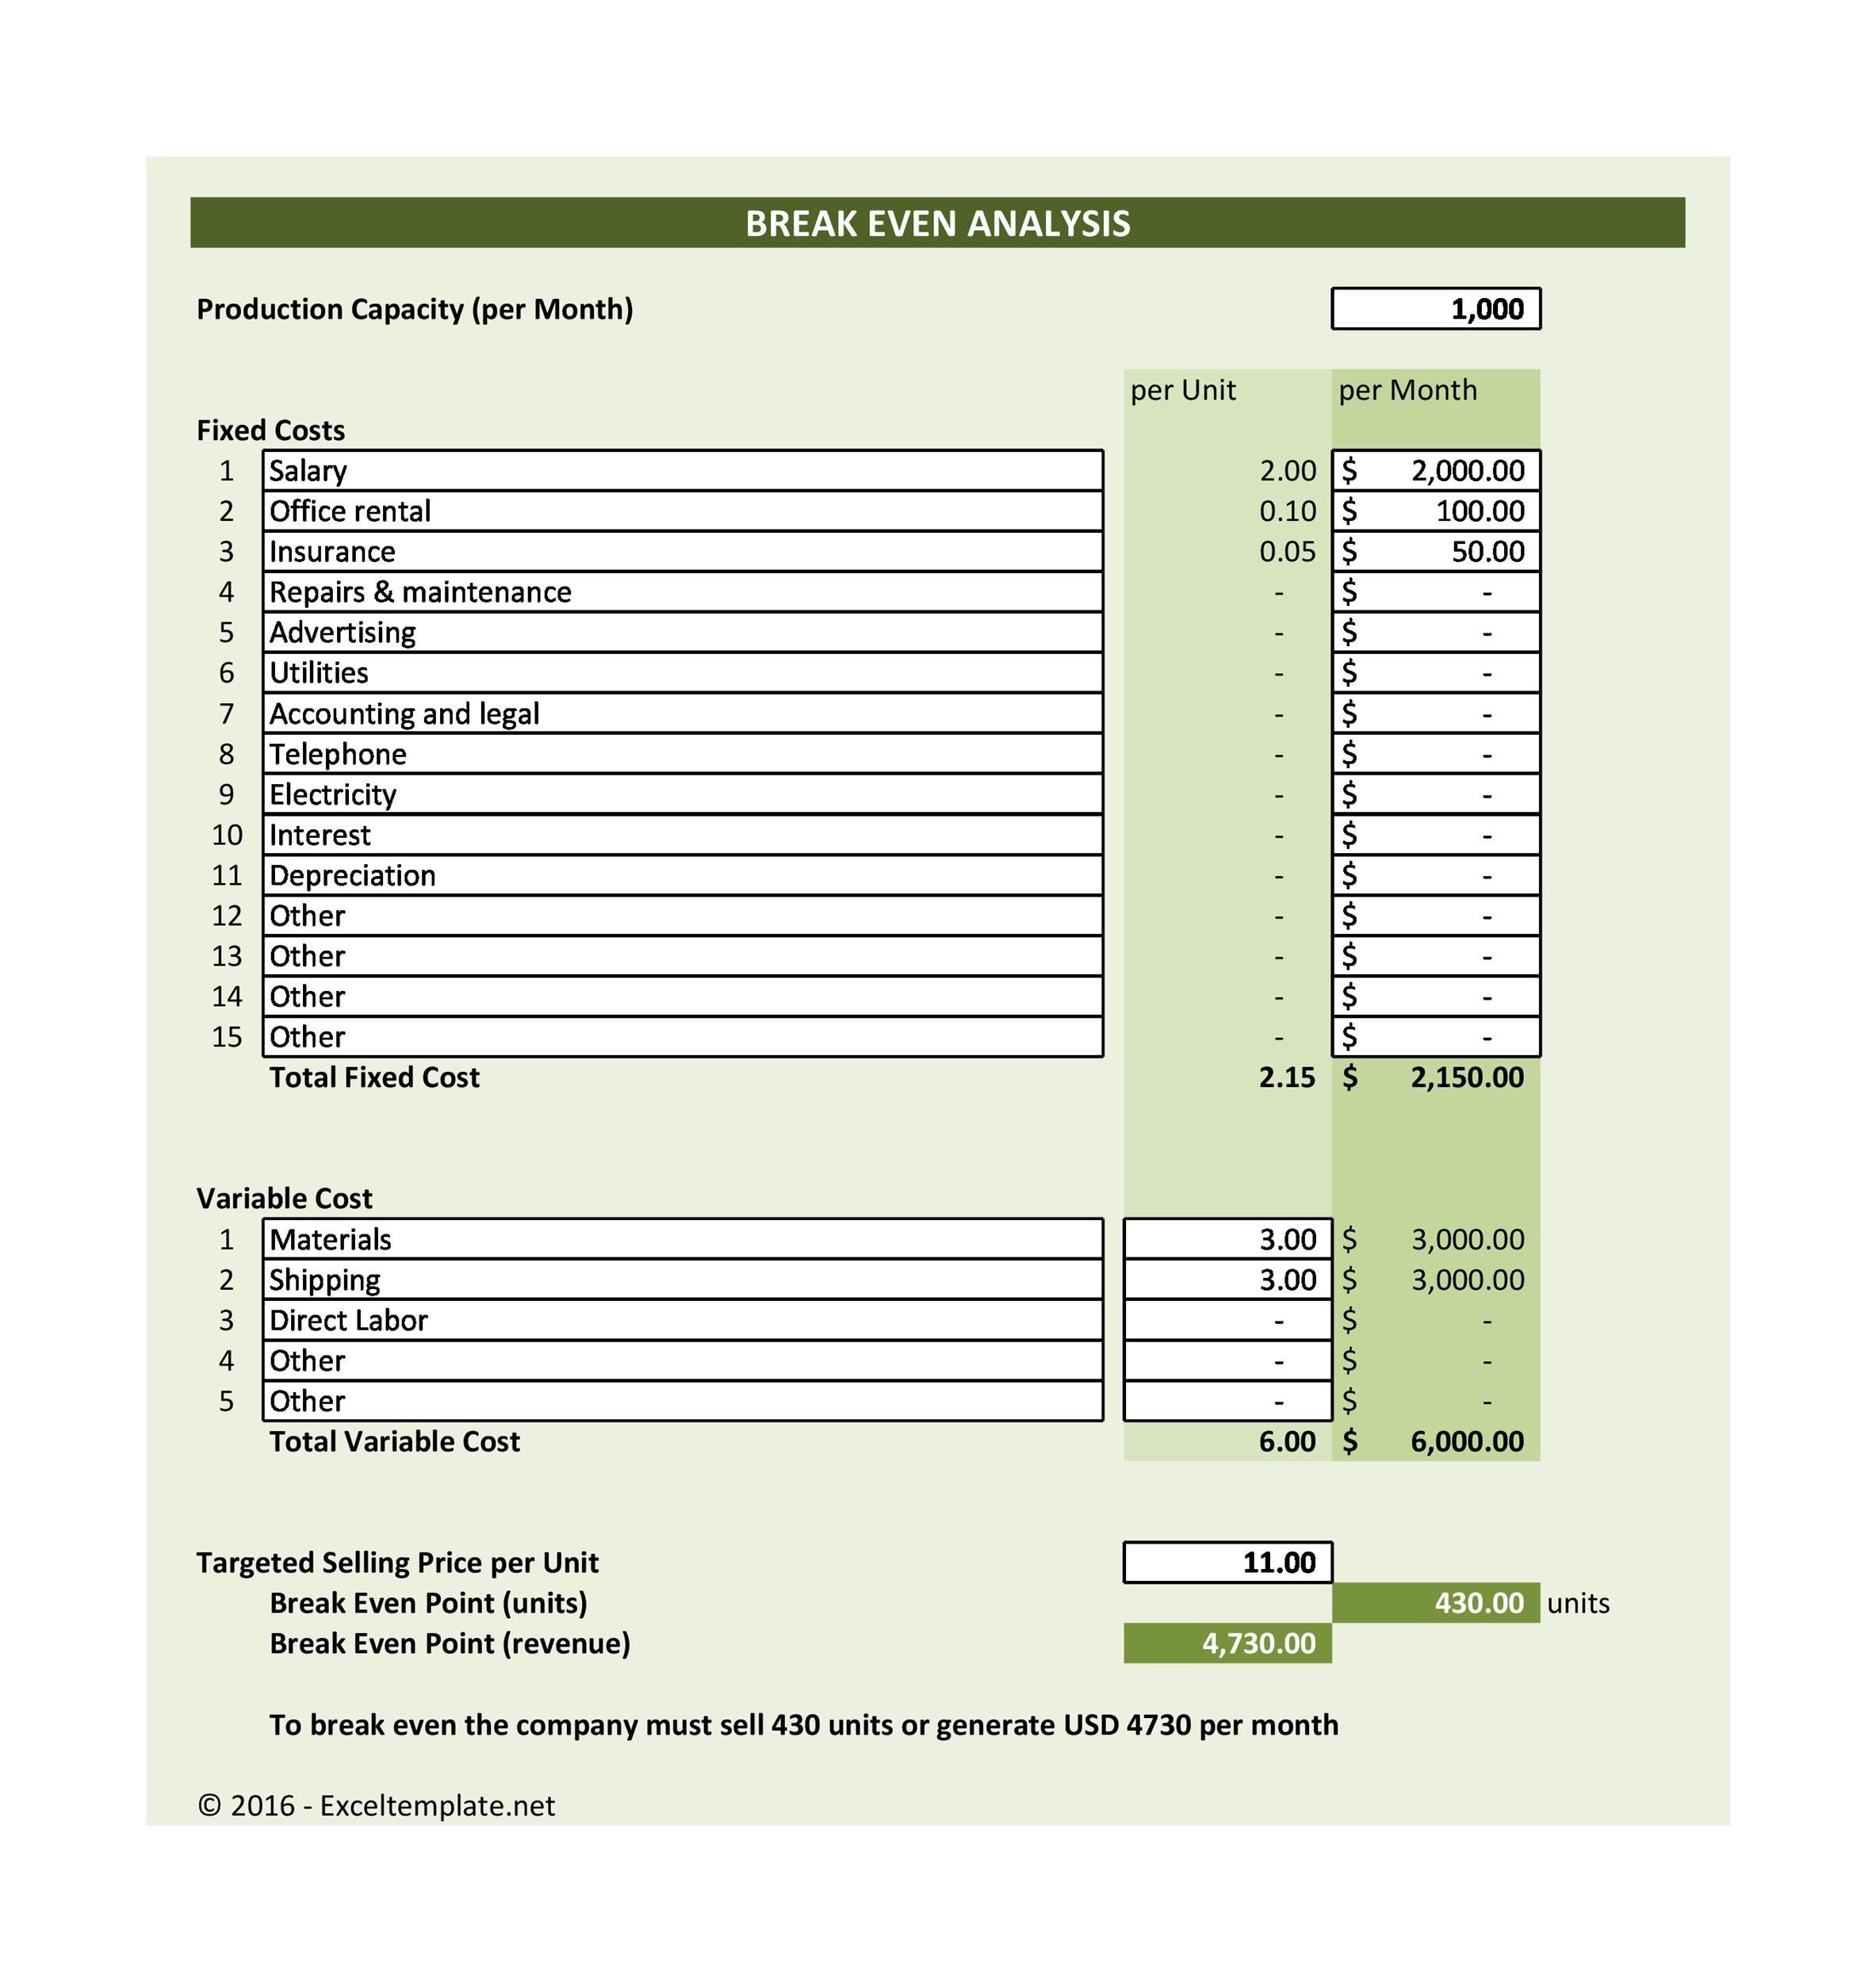
- Identify the exact sales volume needed to cover fixed and variable costs.
- Spot hidden cost drivers such as import duties, local taxes, and labor premiums.
- Make data‑driven decisions on pricing, marketing spend, and expansion timing.
- Communicate financial viability clearly to investors who often scrutinize cash‑flow projections before committing capital.
By integrating these insights into your business plan, you demonstrate a disciplined approach that resonates with the meticulous due‑diligence culture prevalent among Asian financiers.
Core Components of a Break Even Analysis Template
Fixed Costs
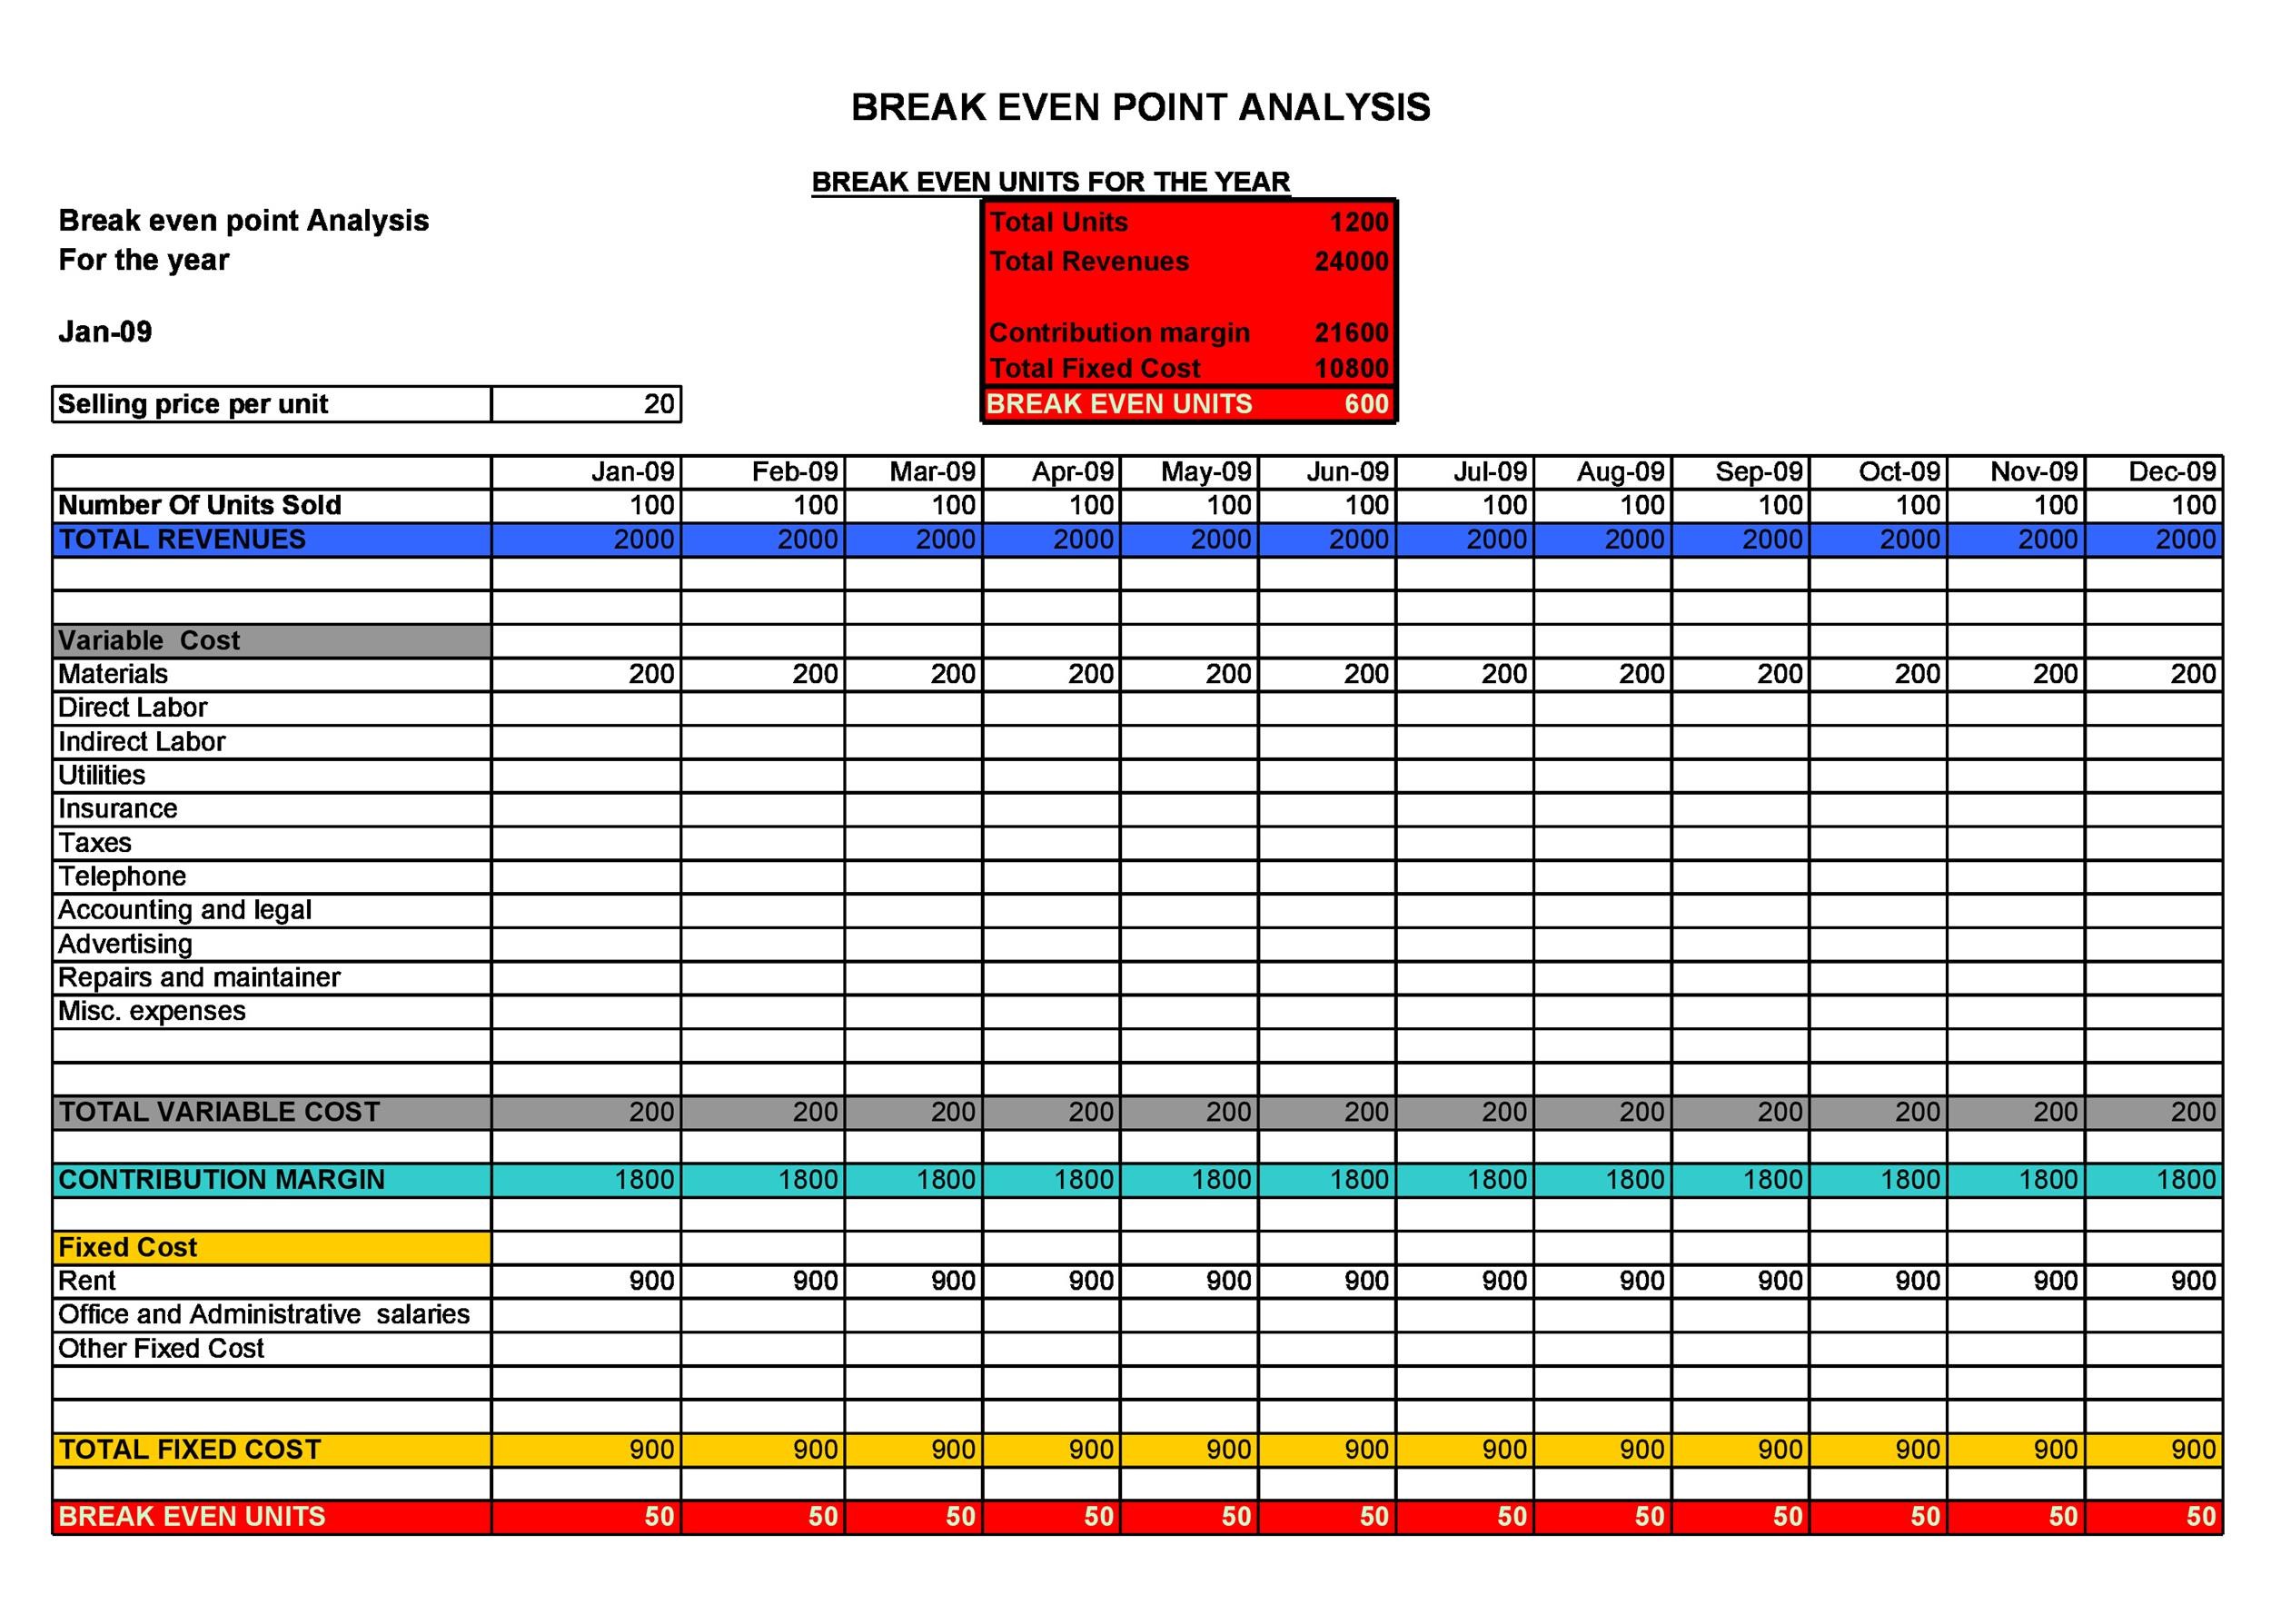
Fixed costs remain constant regardless of production levels. In an Asian context, these may include:
- Rent for storefronts or industrial space, often negotiated on a quarterly basis.
- Utilities and maintenance contracts, especially for climate‑controlled facilities.
- Salaries for core staff, including expatriate managers who may command higher compensation packages.
- Licensing fees, permits, and compliance costs that differ from country to country.
Variable Costs
Variable costs fluctuate directly with output. Typical examples are:
- Cost of raw materials sourced from regional suppliers—think textile fabrics from Vietnam or electronic components from Taiwan.
- Direct labor tied to production lines, often impacted by overtime regulations in countries like Japan.
- Packaging, shipping, and customs duties that scale with volume.
Revenue Assumptions
Accurate revenue forecasting requires a clear understanding of:
- Average selling price (ASP) based on market research and competitor benchmarking.
- Projected sales mix across channels—online marketplaces, brick‑and‑mortar stores, or B2B contracts.
- Seasonality patterns, which are pronounced in Asian markets due to festivals such as Chinese New Year, Diwali, or Ramadan.
Step‑by‑Step Guide to Building Your Break Even Analysis Template
Step 1: Gather Historical Financial Data
If you are a startup, use industry benchmarks and pilot project data. For established businesses, pull the last 12 months of expense reports, payroll records, and sales invoices. This foundation ensures your template reflects real‑world numbers rather than optimistic estimates.
Step 2: List All Fixed Costs
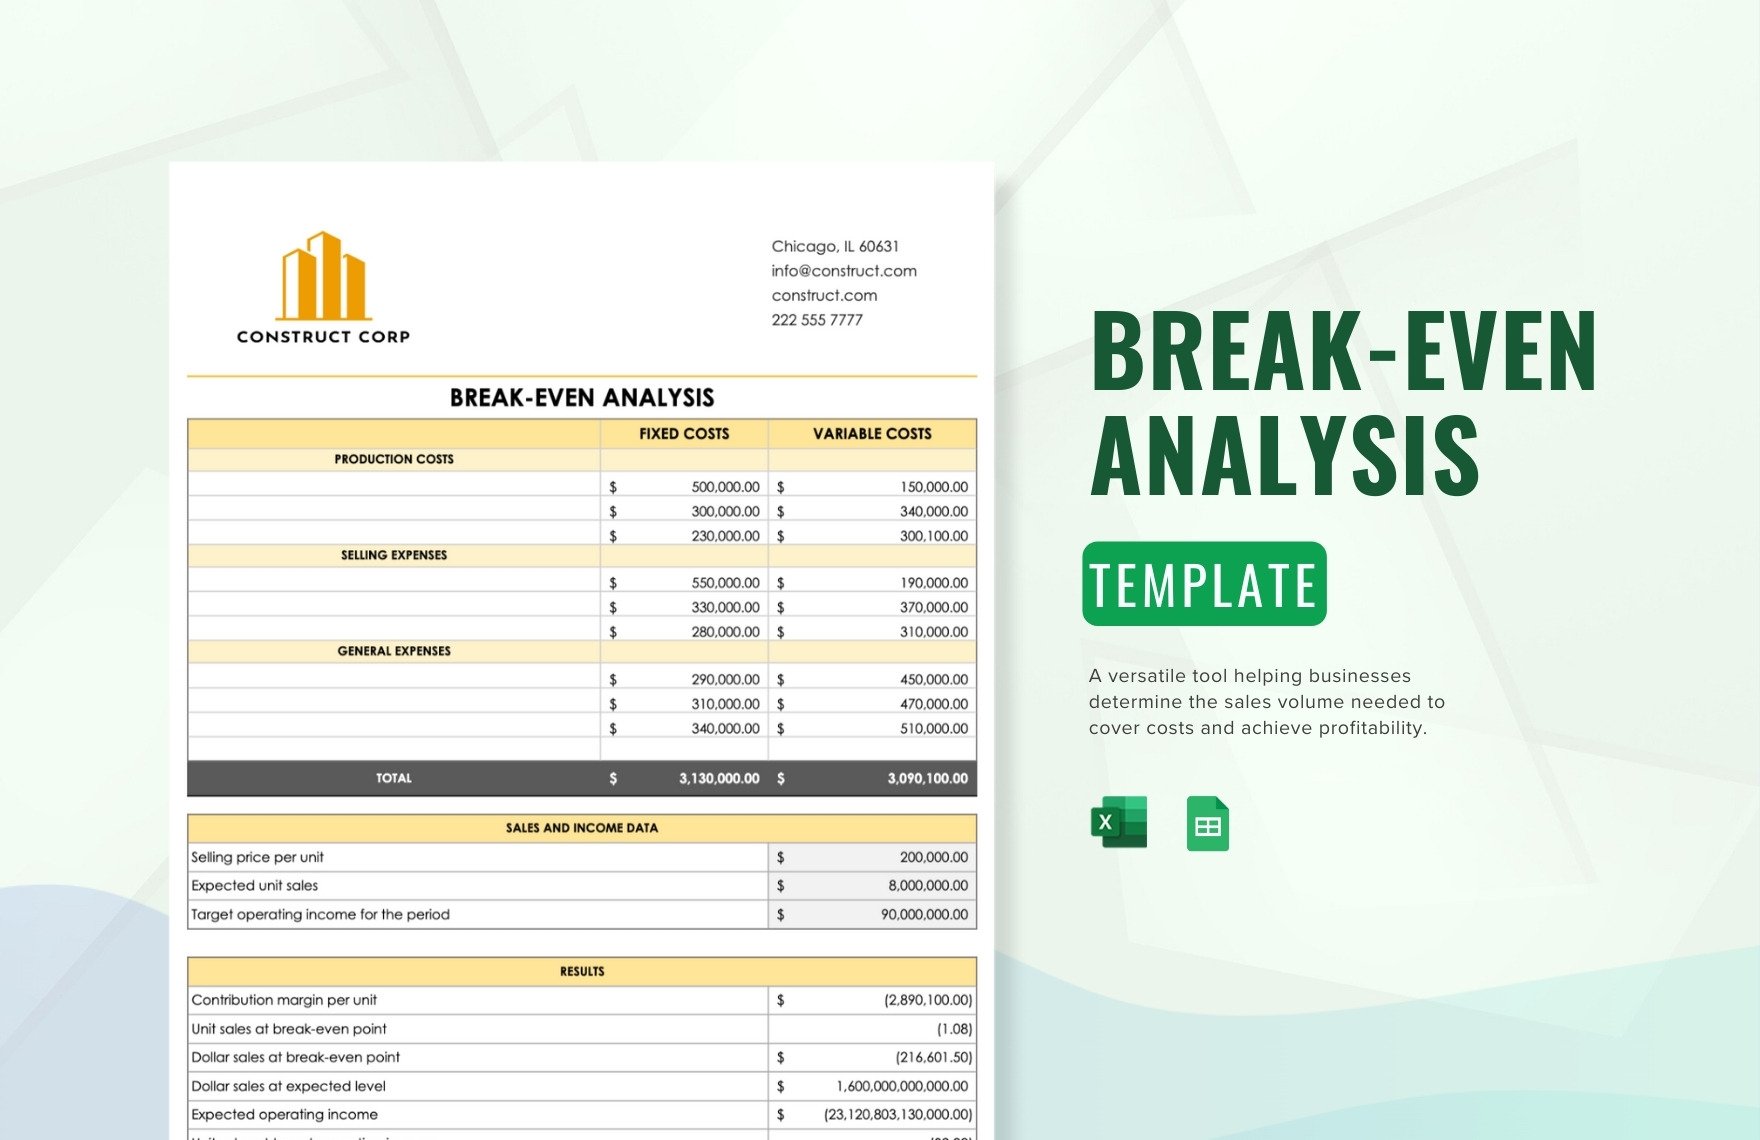
Create a table with two columns: “Cost Category” and “Monthly Amount.” Include every recurring expense, no matter how small. In Asian markets, don’t forget to add “Government Grants” or “Subsidies” as negative entries if applicable, since many Southeast Asian governments offer incentives for export‑oriented firms.
Step 3: Calculate Variable Cost per Unit
Divide the total variable expenses by the number of units produced or sold in the same period. For example, if you spent $30,000 on raw materials to produce 10,000 units, the variable cost per unit is $3.00. Adjust this figure for expected fluctuations in commodity prices, which can be volatile in Asian commodity markets.
Step 4: Determine Your Contribution Margin
The contribution margin is the difference between the selling price per unit and the variable cost per unit. This metric tells you how much each unit contributes toward covering fixed costs. Use the formula:
Contribution Margin = Selling Price per Unit – Variable Cost per Unit
Step 5: Compute the Break‑Even Point (Units)
Apply the classic break‑even formula:
Break‑Even Units = Total Fixed Costs ÷ Contribution Margin
For instance, if fixed costs total $50,000 and the contribution margin is $7, you need to sell 7,143 units to break even.
Step 6: Translate Units into Revenue
Multiply the break‑even units by the selling price to find the break‑even revenue figure. This helps you visualize the sales target in monetary terms, which is often more intuitive for investors reviewing your business plan.
Step 7: Sensitivity Analysis
Asian markets can shift quickly due to currency fluctuations, trade policy changes, or sudden consumer trend spikes. Run “what‑if” scenarios by adjusting key inputs—such as a 10% increase in raw material costs or a 5% discount on pricing—to see how the break‑even point moves. Document these scenarios in separate columns of your template for easy reference.
Step 8: Visualize the Data
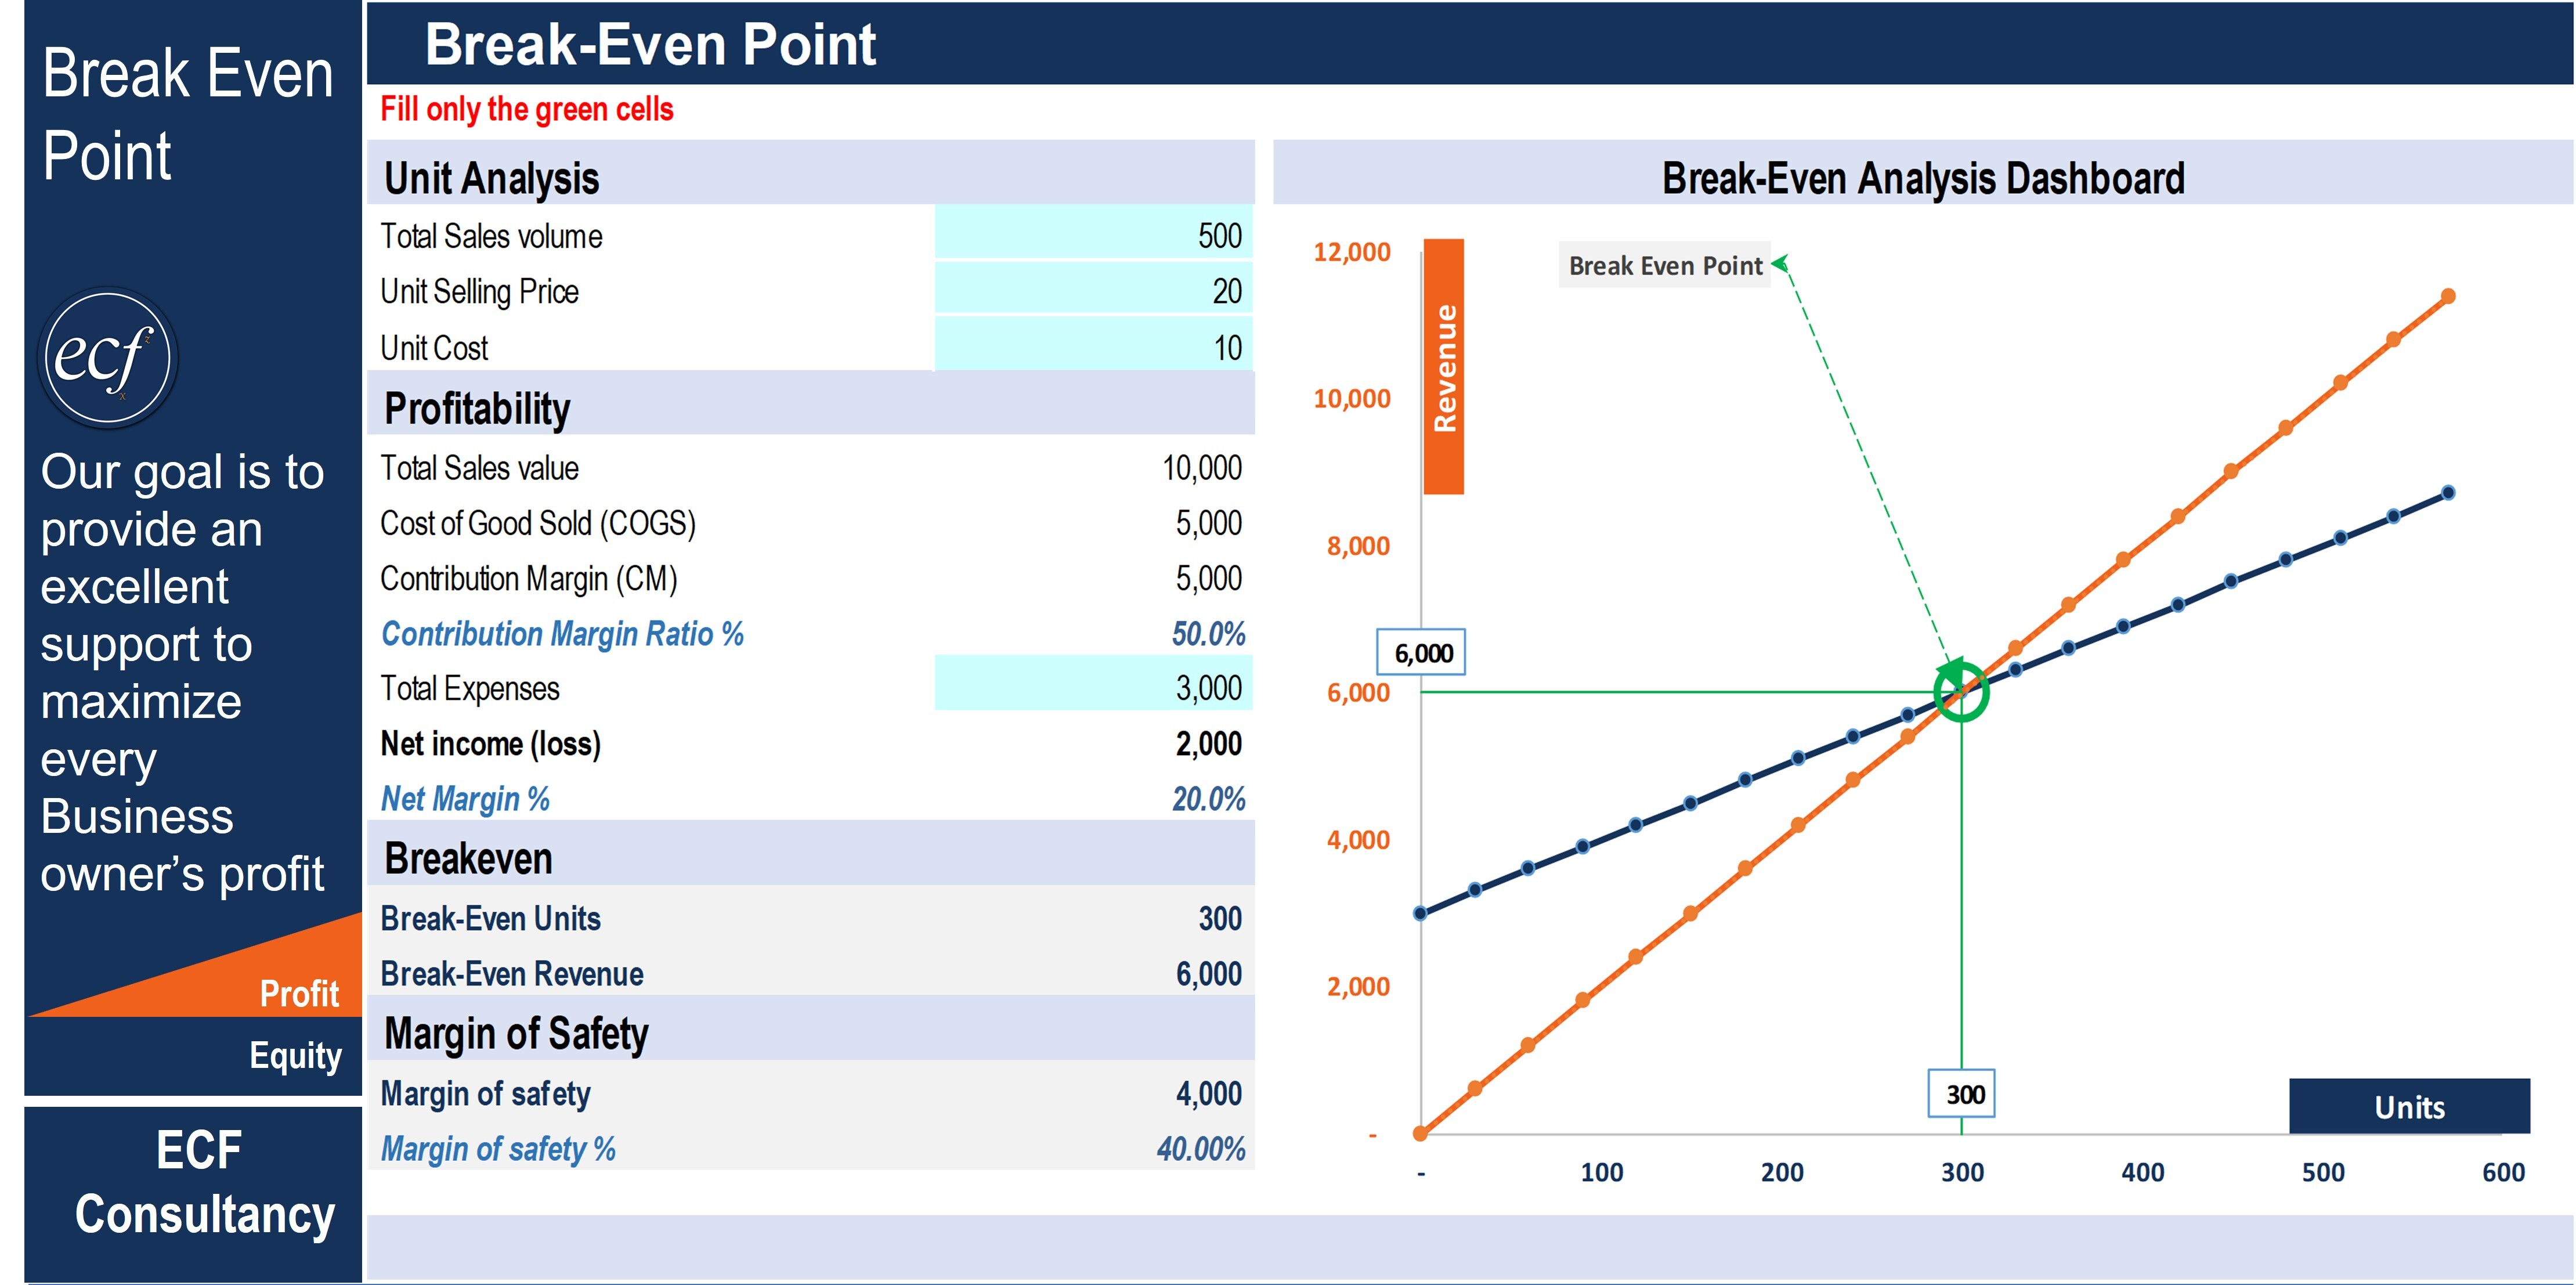
Charts are powerful storytelling tools. Include a break‑even chart that plots total costs, total revenue, and the break‑even point on the same graph. Use distinct colors: red for costs, green for revenue, and a bold line for the break‑even intersection. Visuals resonate with Asian investors who often appreciate clear, concise data representation.
Integrating the Template Into Your Business Plan

Executive Summary Alignment
Briefly mention the break‑even point in your executive summary. Highlight how quickly the venture reaches profitability compared to industry averages, emphasizing the robustness of your financial model.
Financial Projections Section
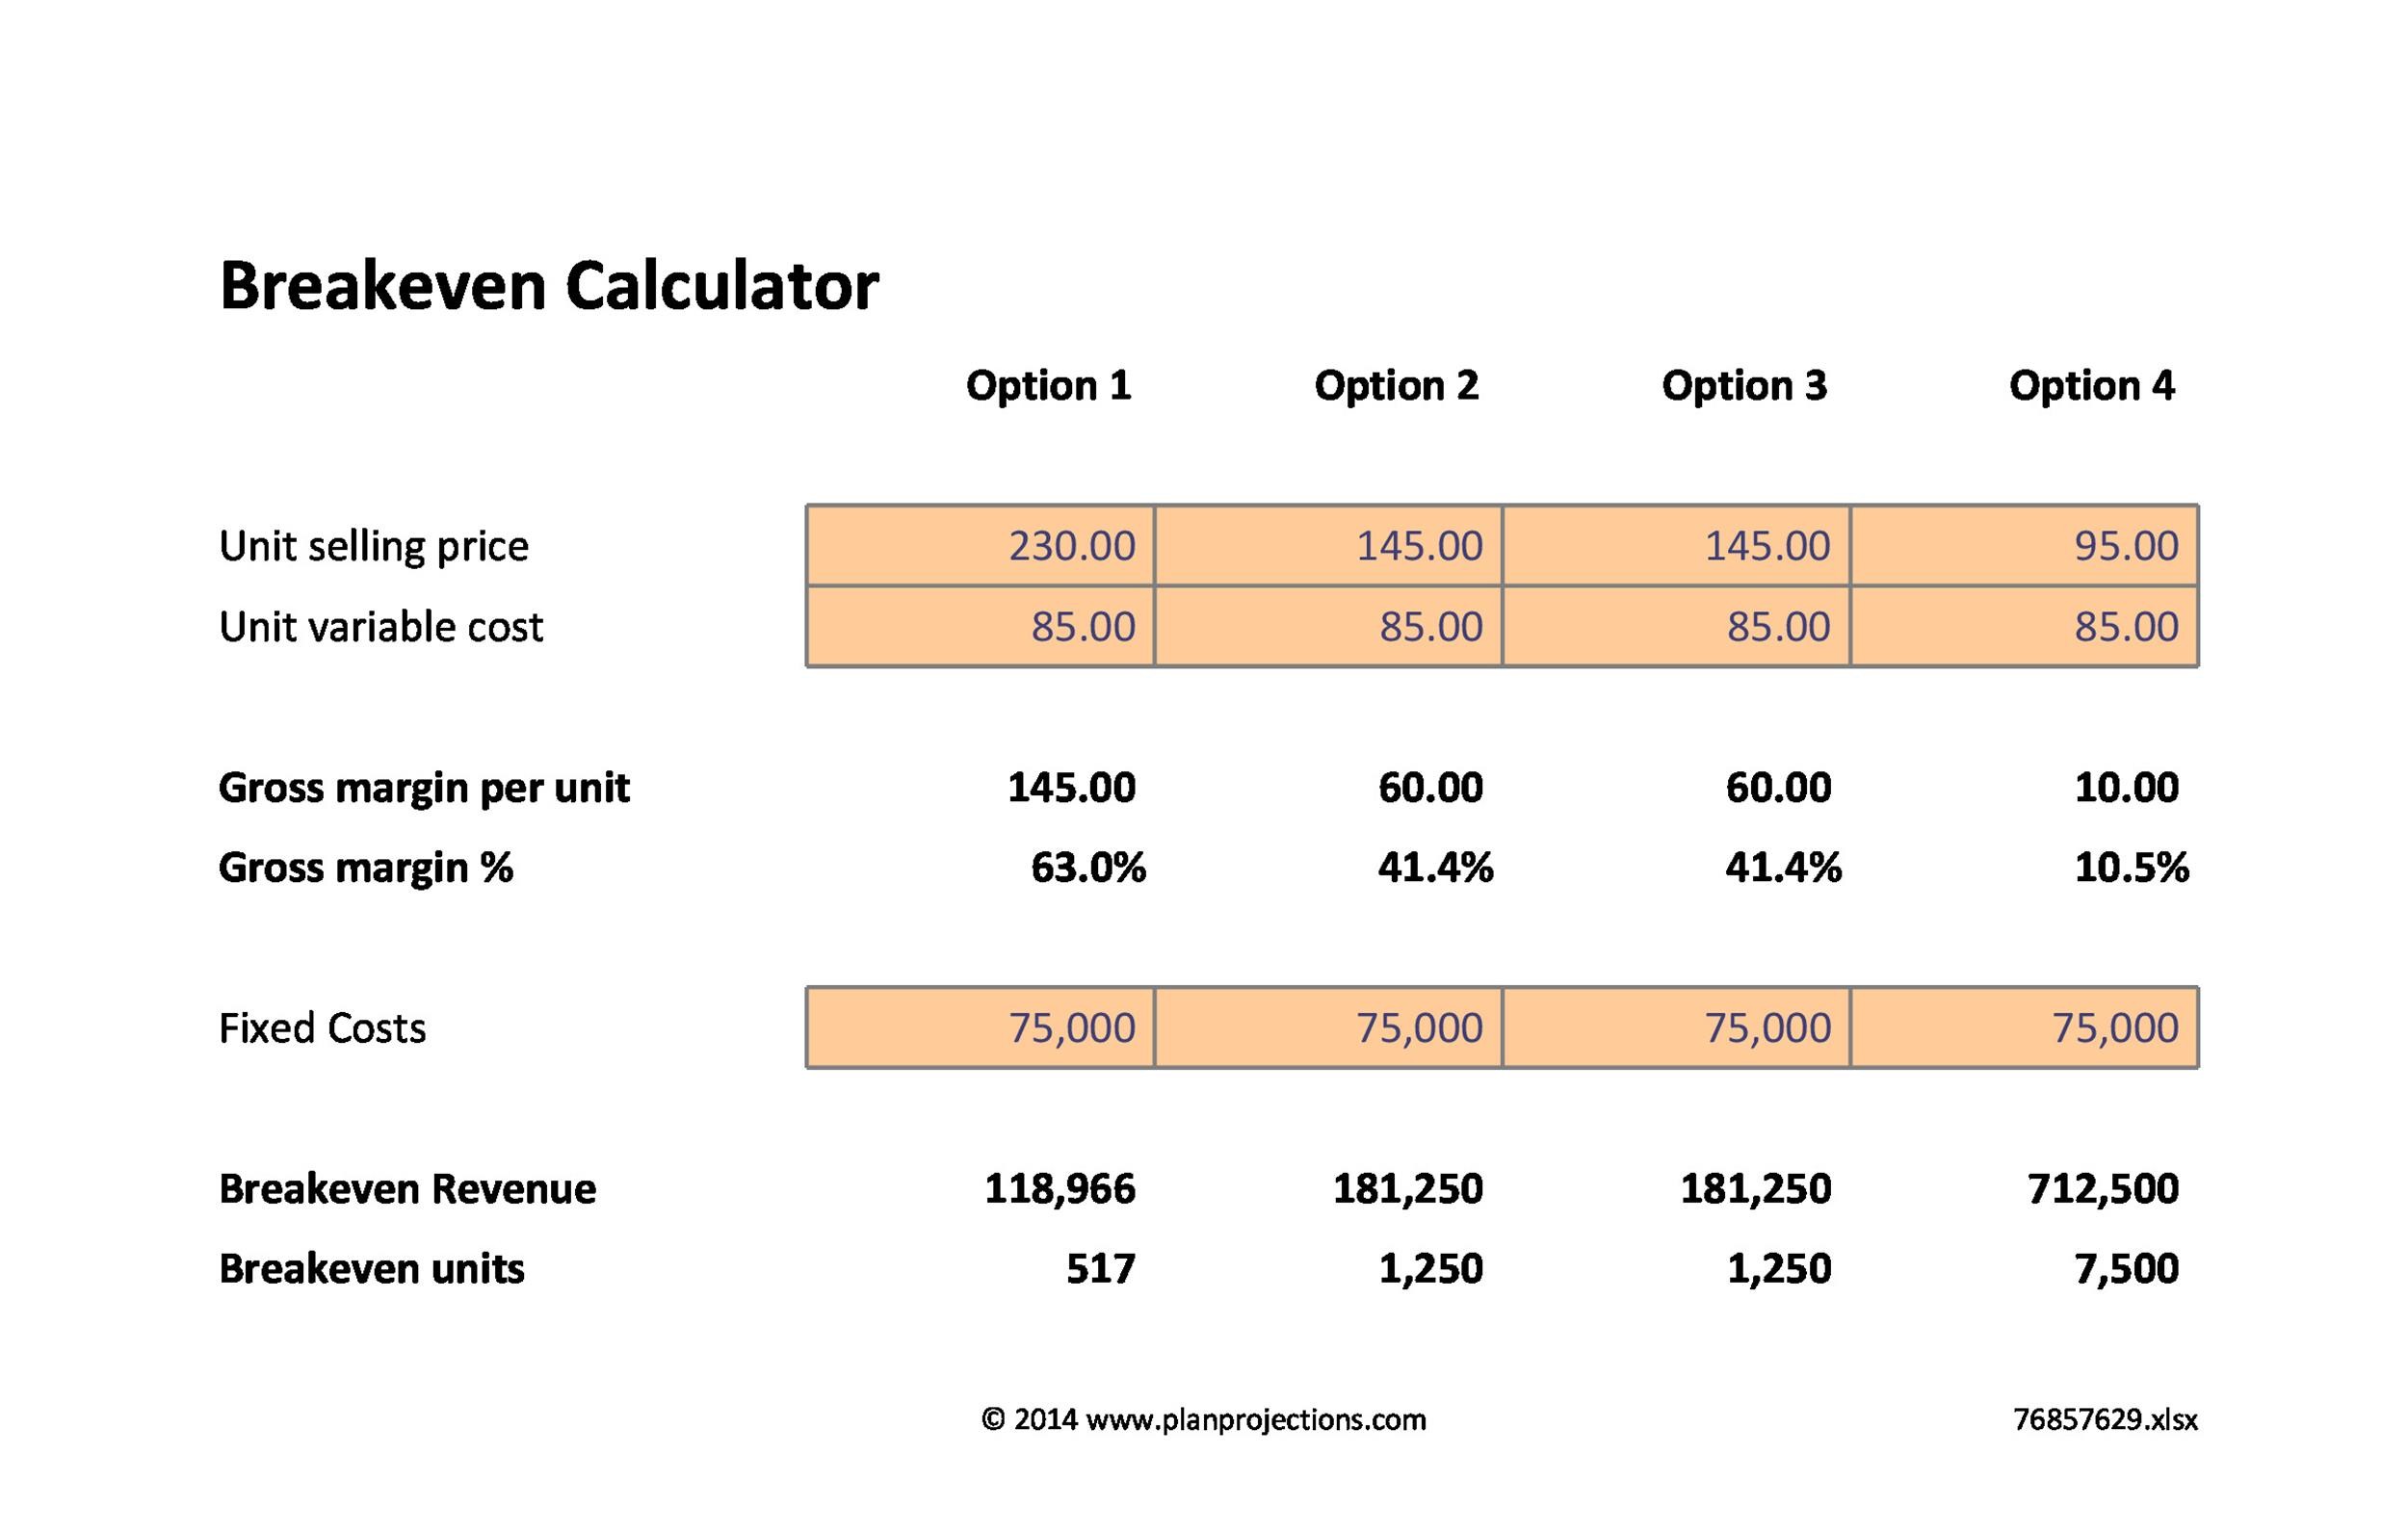
Insert the complete break‑even analysis table under a dedicated “Break‑Even Analysis” subsection. Follow it with three‑year profit and loss forecasts that demonstrate how surpassing the break‑even threshold translates into net profit growth.
Risk Management Chapter
Explain how you will mitigate risks identified in the sensitivity analysis. For example, negotiate long‑term supplier contracts to lock in raw material prices, or diversify sales channels to reduce reliance on a single market.
Appendix and Supporting Documents
Provide the raw spreadsheet or template file as an appendix for stakeholders who wish to conduct deeper due‑diligence. Including a brief user guide on how to update the template ensures transparency and ongoing accuracy.
Real‑World Example: A Taiwanese Snack Manufacturer

Consider a small‑scale snack producer in Taichung, Taiwan, launching a line of premium seaweed chips. The entrepreneur used a break‑even analysis template to map out costs:
- Fixed Costs: factory lease $8,000/month, equipment depreciation $2,500/month, salaries $12,000/month, insurance $1,000/month.
- Variable Costs per 500‑gram bag: raw seaweed $1.20, seasoning $0.30, packaging $0.25, labor $0.15.
- Selling Price per bag: $3.50.
Calculating the contribution margin ($3.50 – $1.90 = $1.60) and total fixed costs ($23,500), the break‑even volume came to 14,688 bags per month. By targeting retail chains and leveraging a promotional campaign during the Mid‑Autumn Festival, the company sold 18,000 bags in the first month, surpassing the break‑even point and generating a net profit of $4,800. This concrete example illustrates how a simple template can turn a modest idea into a profitable venture.
Tips for Customizing the Template for Different Asian Industries
Technology Startups
Focus on SaaS subscription revenue and factor in customer acquisition cost (CAC) as a variable expense. Include churn rate in the sensitivity analysis to gauge its impact on the break‑even timeline.
Retail and E‑Commerce
Account for logistics costs such as last‑mile delivery fees and platform commission rates (e.g., Lazada, Shopee). Seasonal promotions can be modeled as temporary reductions in contribution margin.
Manufacturing and Export
Incorporate exchange rate risk by converting foreign supplier costs into local currency using average rates. Add export duties and freight charges as variable costs that scale with volume.
Service‑Based Businesses
Identify billable hours versus non‑billable administrative time. Fixed costs may include office rent and software licenses, while variable costs could be freelance contractor fees tied directly to project delivery.
Common Pitfalls and How to Avoid Them

Underestimating Fixed Costs
Many entrepreneurs forget to include hidden expenses like corporate tax deposits, employee training, or IT support contracts. Conduct a thorough audit of all recurring payments before finalizing the template.
Over‑Optimistic Pricing
Setting the selling price too high can inflate the contribution margin, making the break‑even point appear unrealistic. Benchmark against local competitors and test pricing through pilot sales.
Neglecting Currency Fluctuations
In cross‑border operations, a sudden devaluation of the local currency can raise variable costs dramatically. Use a buffer (e.g., 5%–10%) in your cost assumptions to protect against volatility.
Failing to Update the Template
The break‑even analysis is a living document. Schedule monthly reviews to adjust for changes in rent, labor rates, or supplier pricing, ensuring the model stays relevant as the business evolves.
Best Practices for Presenting the Break Even Analysis to Stakeholders

Keep It Concise but Comprehensive
Summarize key numbers in a one‑page snapshot: total fixed costs, contribution margin, break‑even units, and break‑even revenue. Follow with detailed tables in the appendix for those who want depth.
Use Clear Visuals
Bar charts, line graphs, and waterfall diagrams help convey complex financial relationships at a glance. Ensure colors are accessible (high contrast) for audiences who may view the presentation on mobile devices.
Tell a Story
Frame the analysis as part of a larger narrative: “Our market research shows a demand for eco‑friendly packaging, and our cost structure allows us to achieve profitability after 6 months, positioning us for rapid regional expansion.” Stories resonate with Asian investors who value strategic foresight.
Highlight Risk Mitigation
Show that you have contingency plans for each sensitivity scenario. Mention supplier diversification, flexible pricing strategies, and reserve funds to cover unexpected cost spikes.
Conclusion
A meticulously crafted Break Even Analysis Template Business Plan equips Asian entrepreneurs with the financial clarity needed to launch, sustain, and scale their ventures in a competitive environment. By systematically accounting for fixed and variable costs, accurately projecting revenue, and visualizing the break‑even point, you build credibility with investors, reduce uncertainty, and set a solid foundation for long‑term profitability. Remember to tailor the template to your industry’s nuances, regularly update assumptions, and communicate findings through clear visuals and concise narratives. With these practices in place, your business will not only reach the break‑even milestone but also thrive beyond it, turning every challenge into an opportunity for growth.