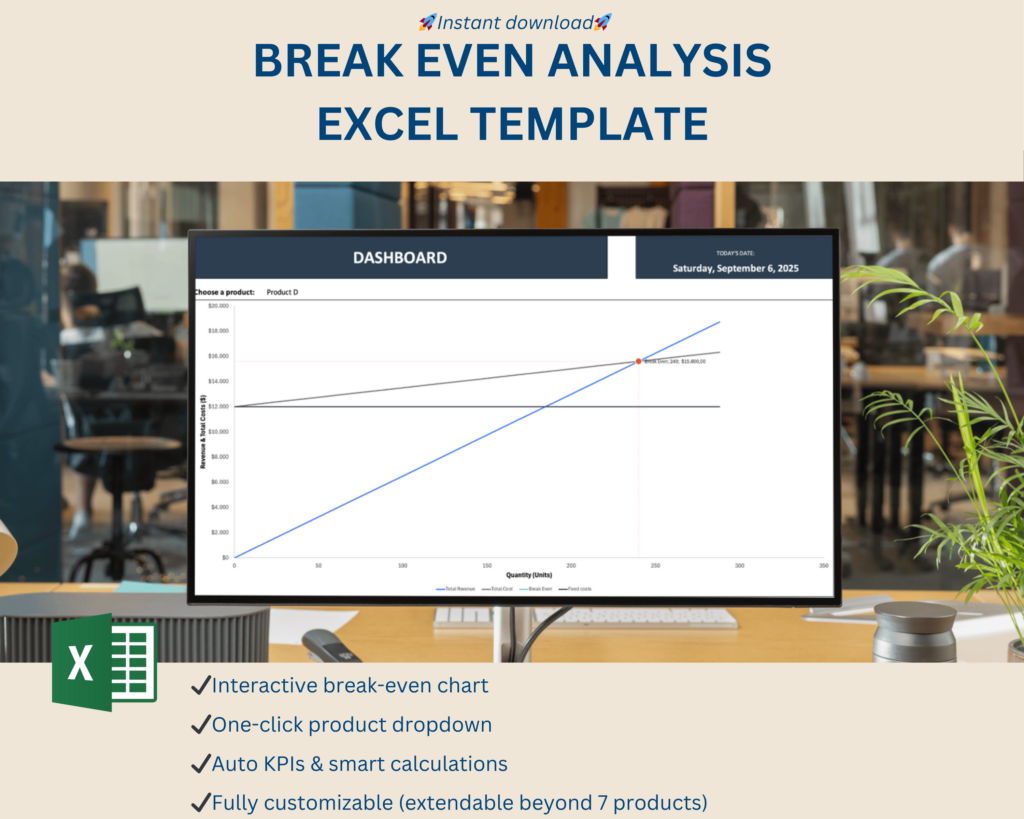
Break Even Analysis Chart Template is not just another spreadsheet; it’s the ultimate life‑saver for entrepreneurs who want to know whether they’re going to make a profit, a loss, or just a respectable cup of coffee‑money. In a world where every penny counts, this tool lets you see the point where your sales cover all costs and the sweet spot where the cash register starts to chirp instead of squeak. Ready to turn your numbers into a witty, eye‑catching chart? Let’s dive in.
What Is a Break Even Analysis?
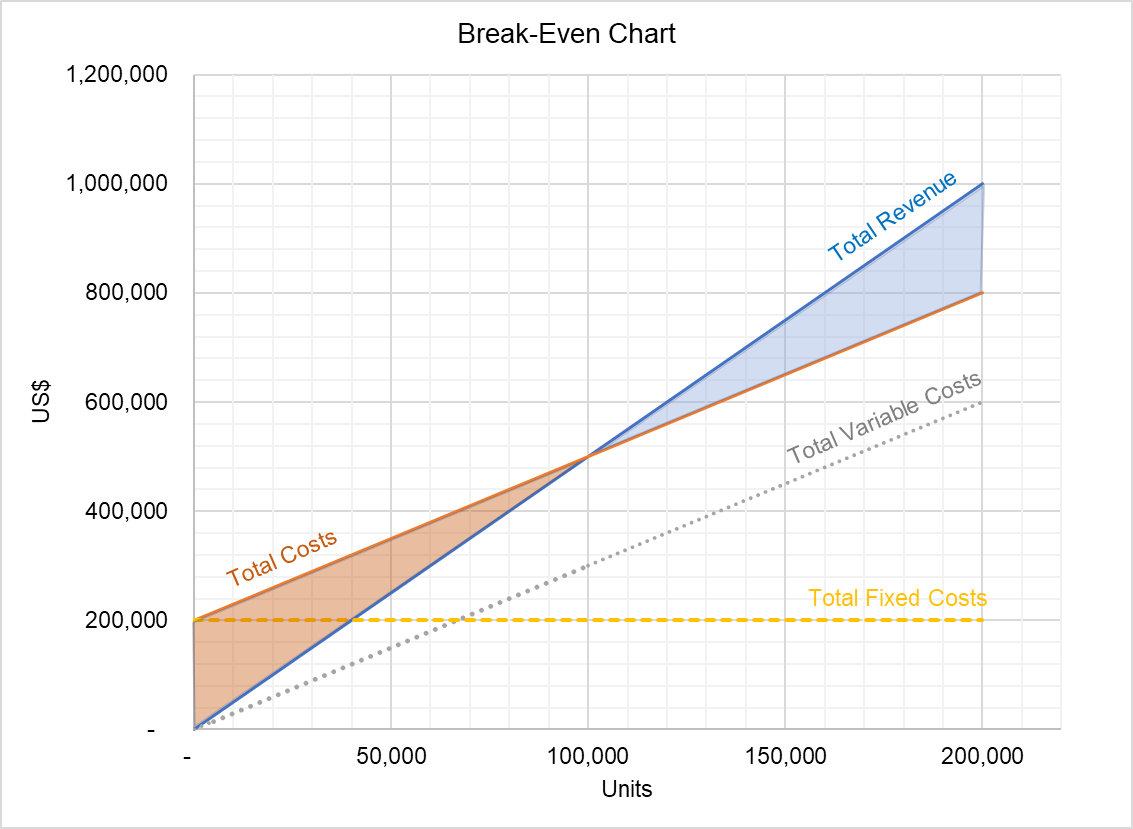
Imagine a tiny, invisible line on a graph that tells you, in plain sight, whether you’re about to win big or drown in debt. That line is the break‑even point. It’s the exact quantity of products or services you need to sell before you start turning a profit. Everything before that line is a polite “we’re still learning,” and everything after it is a triumphant “we’re finally making money!”
The Anatomy of the Equation
- Fixed Costs: These are the non‑moving targets like rent, salaries, and insurance. Think of them as the stubborn wall you can’t move.
- Variable Costs: Per‑unit costs that wiggle and jiggle—raw materials, shipping, or hourly labor.
- Sales Price per Unit: The amount your customer pays. If you’re selling coffee, it might be $4 per cup.
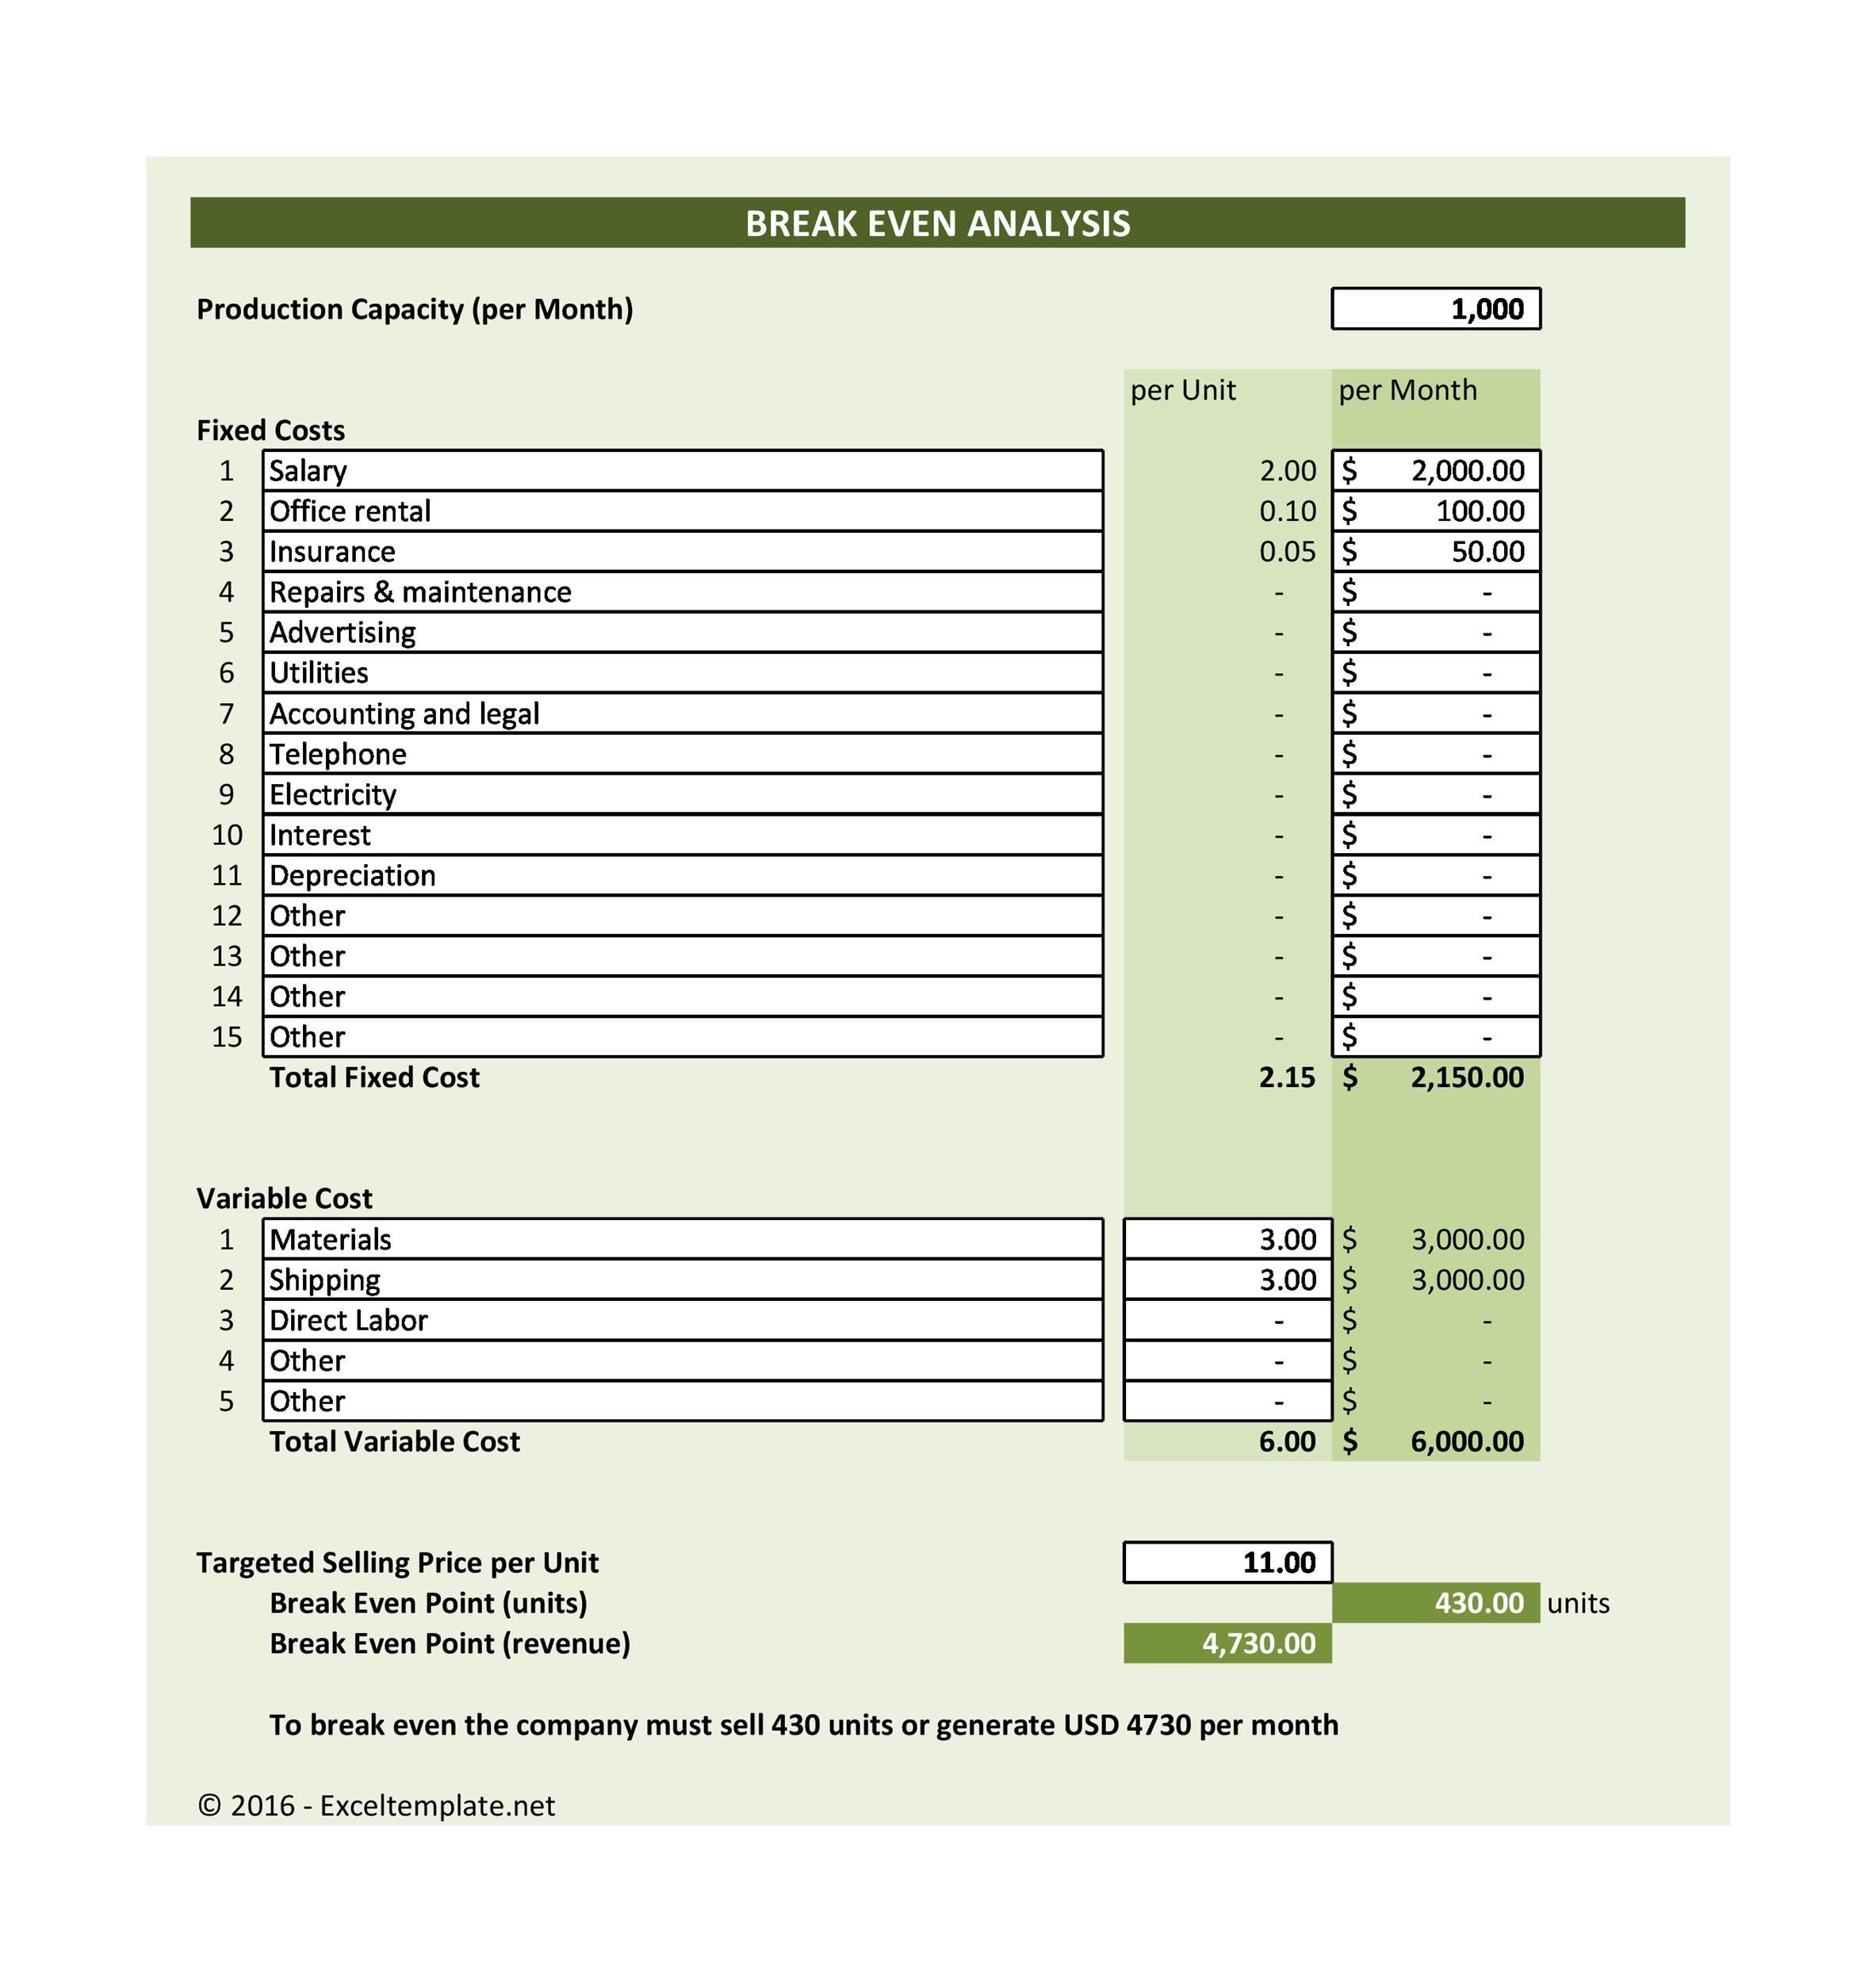
- Break‑Even Quantity (QBE): The sweet spot where revenue equals total costs. Formula: Fixed Costs ÷ (Sales Price – Variable Cost per Unit).
Why Bother with Numbers?
Knowing your break‑even point lets you:
- Set realistic sales targets.
- Adjust pricing or costs without fearing a financial cliff.
- Communicate confidence to investors—or at least look confident while you’re crunching numbers.
Why a Template Saves Your Sanity

Crafting a break‑even chart from scratch can feel like assembling IKEA furniture blindfolded. A ready‑made template removes the guesswork, gives you a clean aesthetic, and turns the whole process into a walk in the park—if that park were a spreadsheet with charts and color‑coding.
Instant Professionalism
Clients love visuals. A template provides pre‑formatted charts that pop—think bar graphs with a “sweet spot” line, or a line chart that tracks costs versus sales. You save time, avoid clutter, and look like a wizard.
Accuracy Is Key
Templates often come with built‑in formulas that guard against manual errors. A single typo in a cell can send your whole chart into the abyss of misinformation; a template catches that by default.
Customization Without Tears
Don’t feel trapped. Templates usually let you edit labels, colors, and ranges. If your business sells more than one product, you can create multiple rows and let the software do the math.
Building Your Own Excel or Google Sheet Wonder
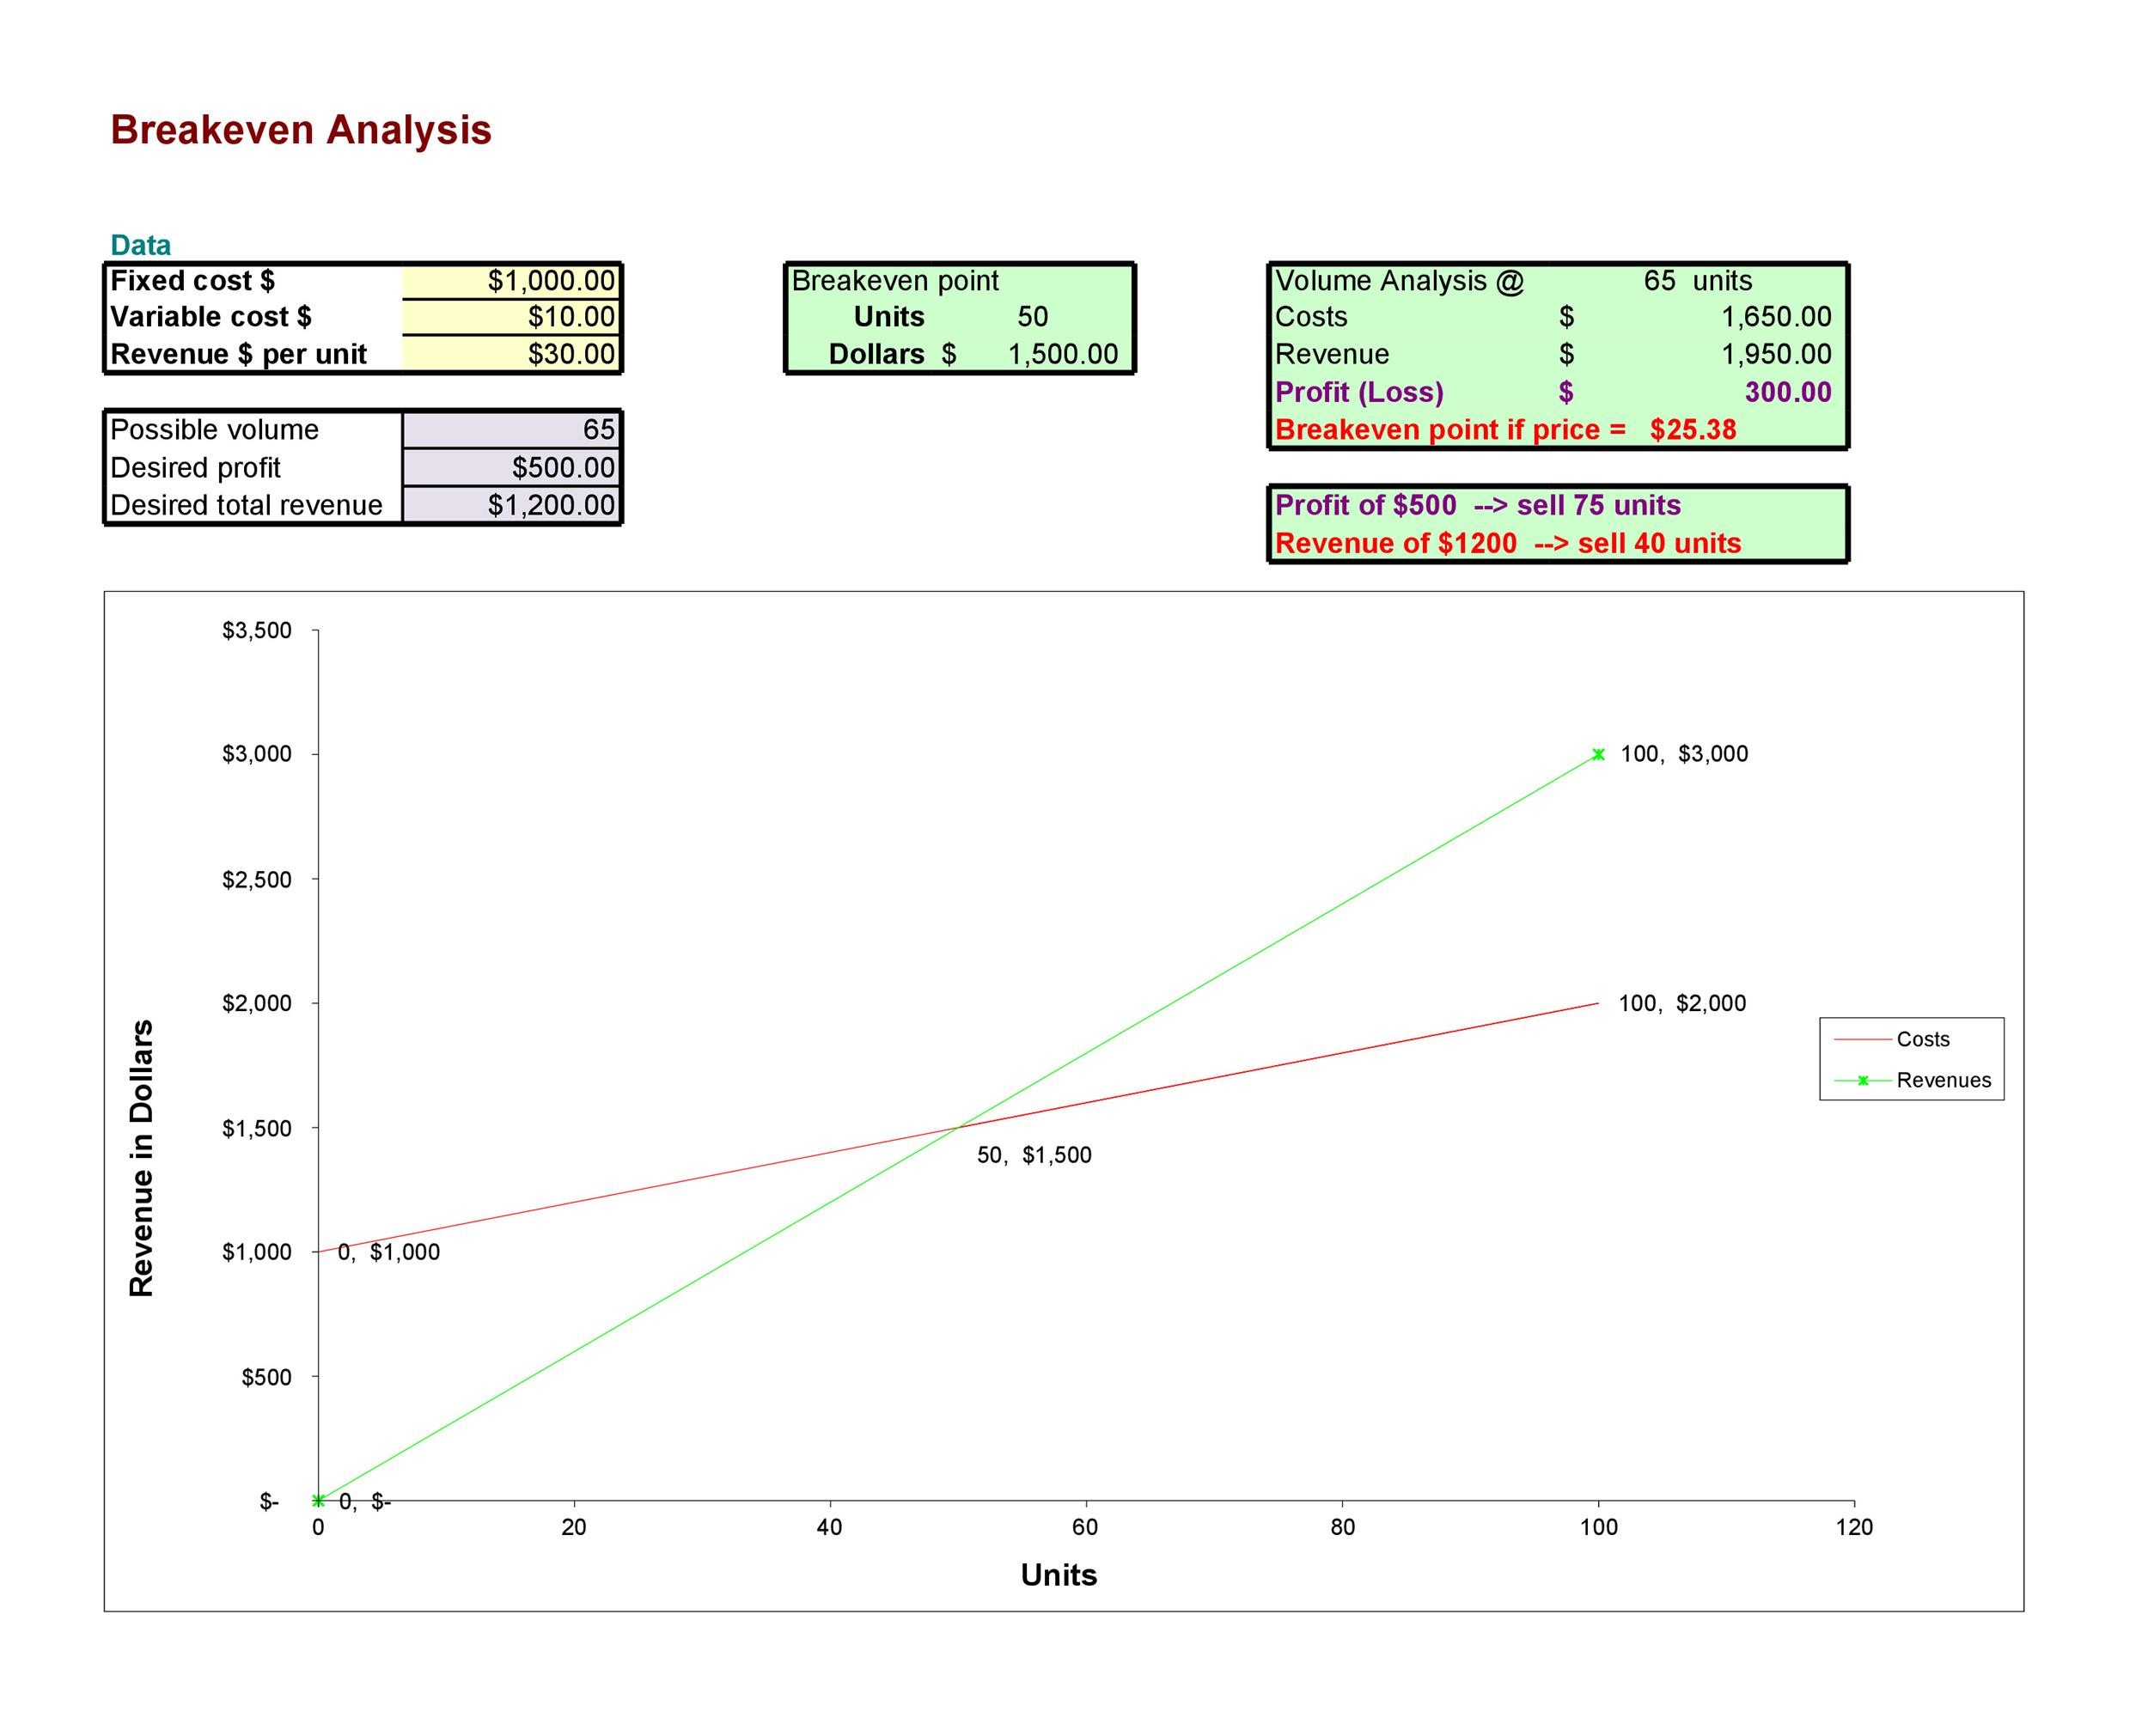
All right, you’re ready to flex those spreadsheet muscles. Let’s walk through the steps that make a template not just a template, but a masterpiece.
1. Set Up Your Data Table
Start with a clean sheet and create columns for:
- Item/Service Name
- Fixed Cost per Month
- Variable Cost per Unit
- Sales Price per Unit
- Projected Units Sold
- Contribution Margin (Price – Variable Cost)
2. Insert the Core Formula
In a new cell, enter:
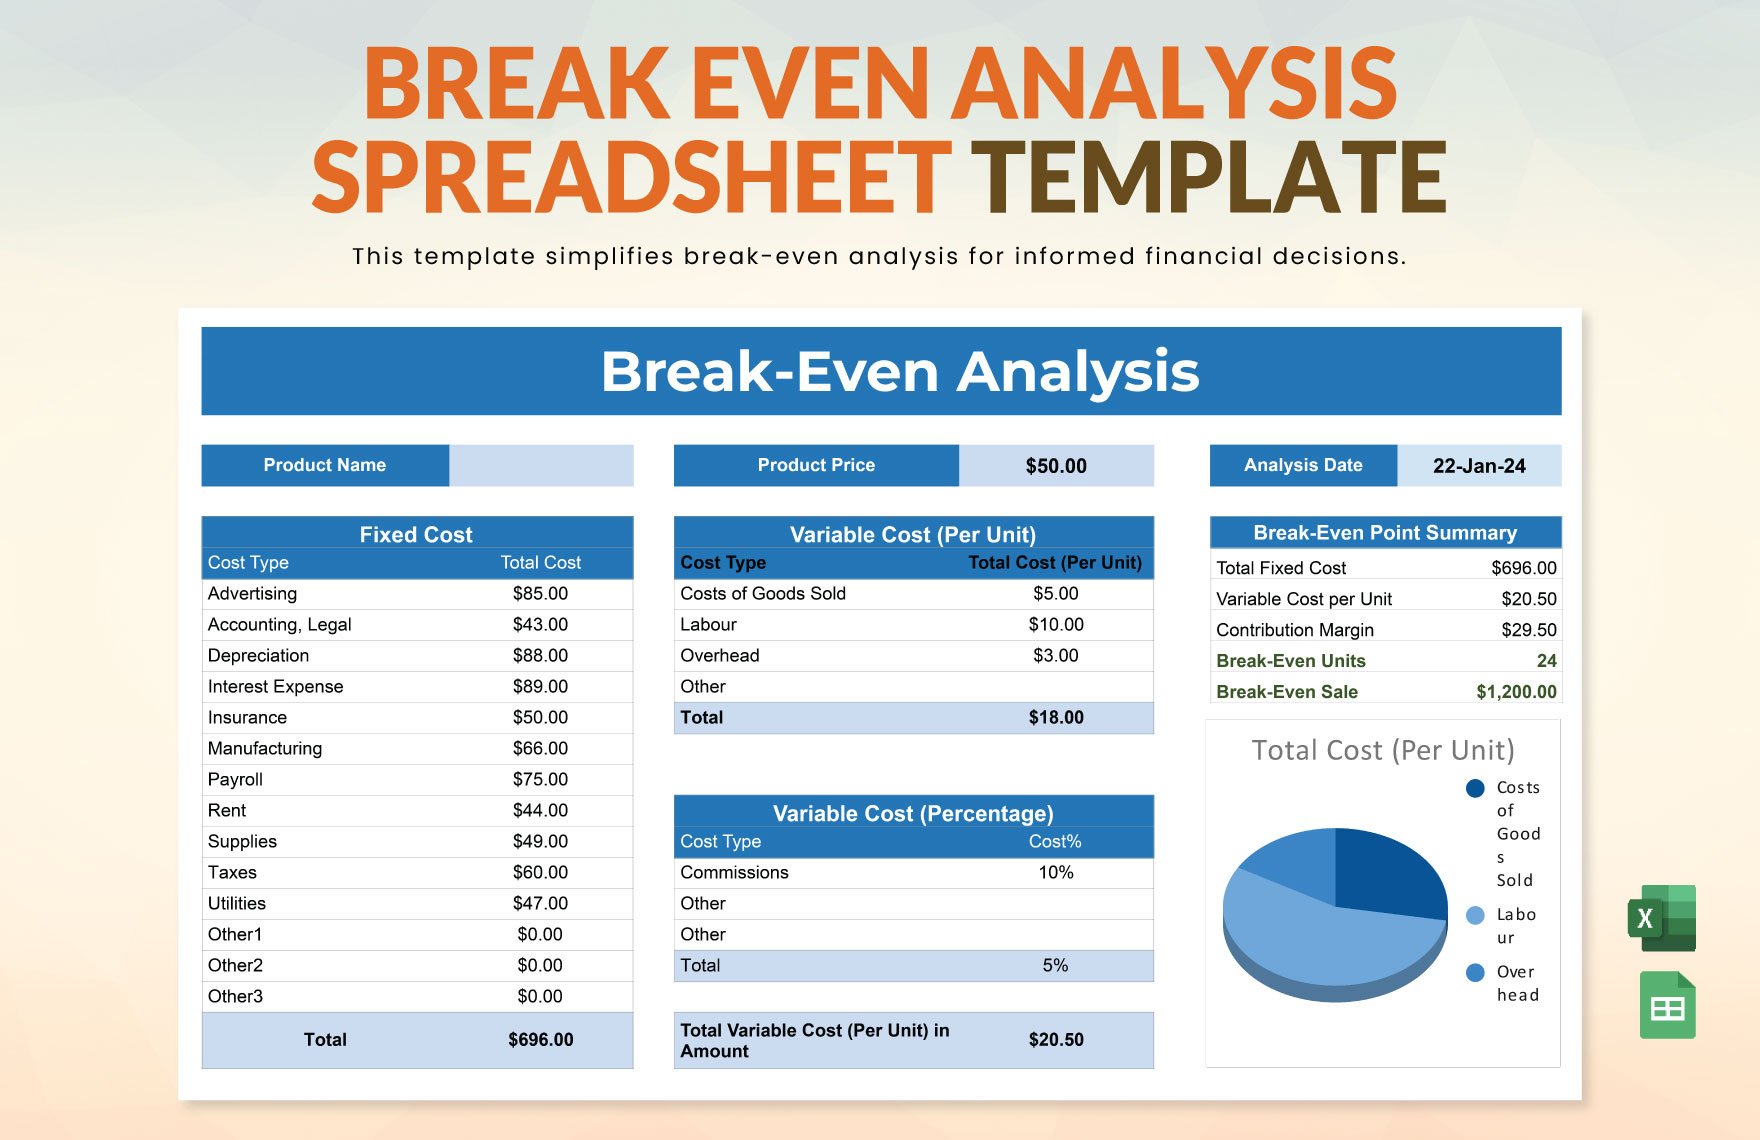
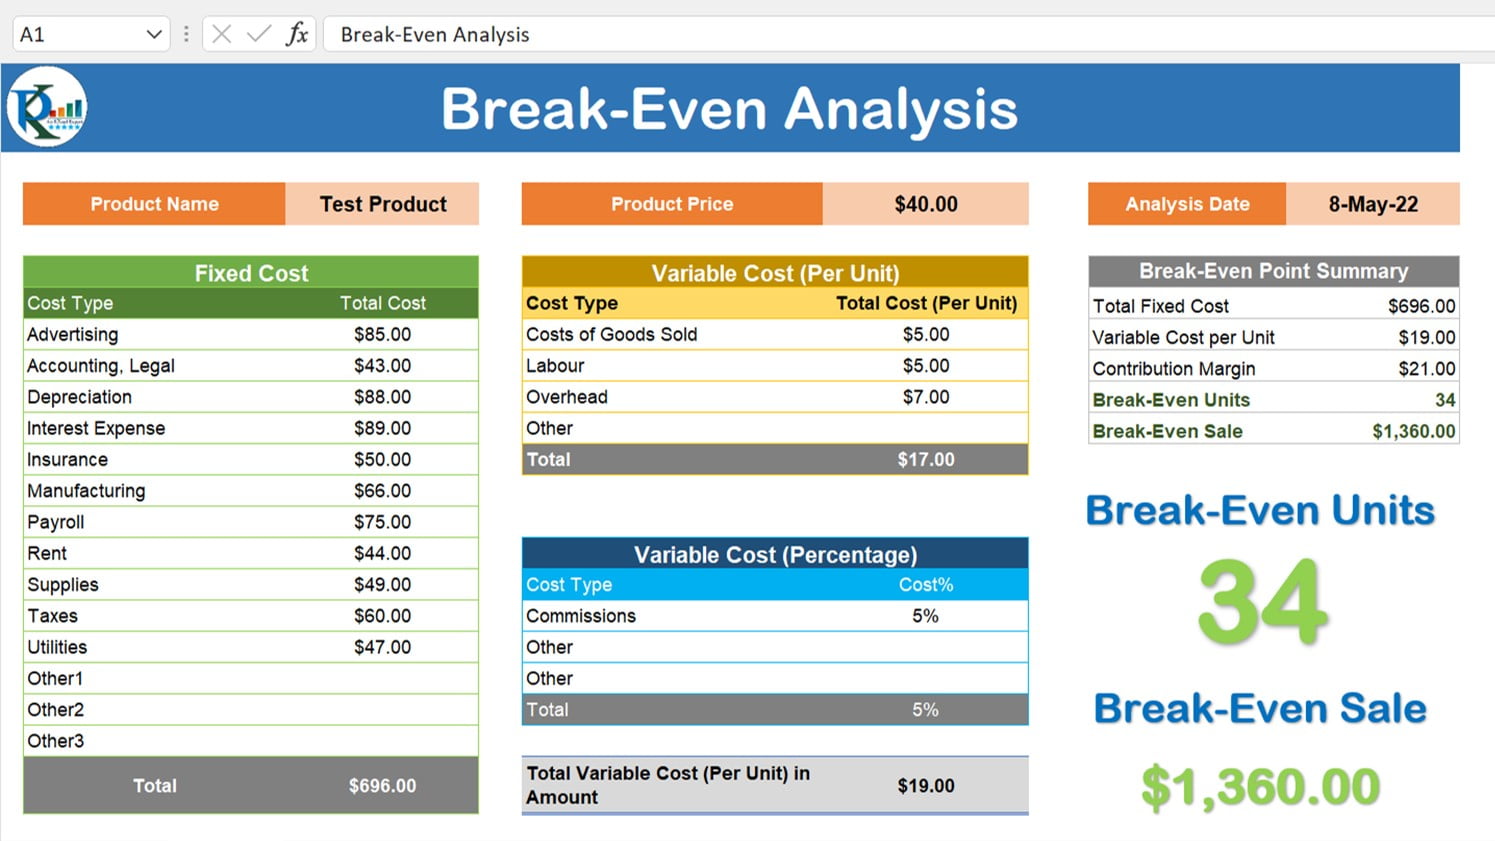
- Break‑Even Units (BEU) = Fixed Cost ÷ Contribution Margin. Format the cell as a number, no decimals for whole units.
3. Build the Graph
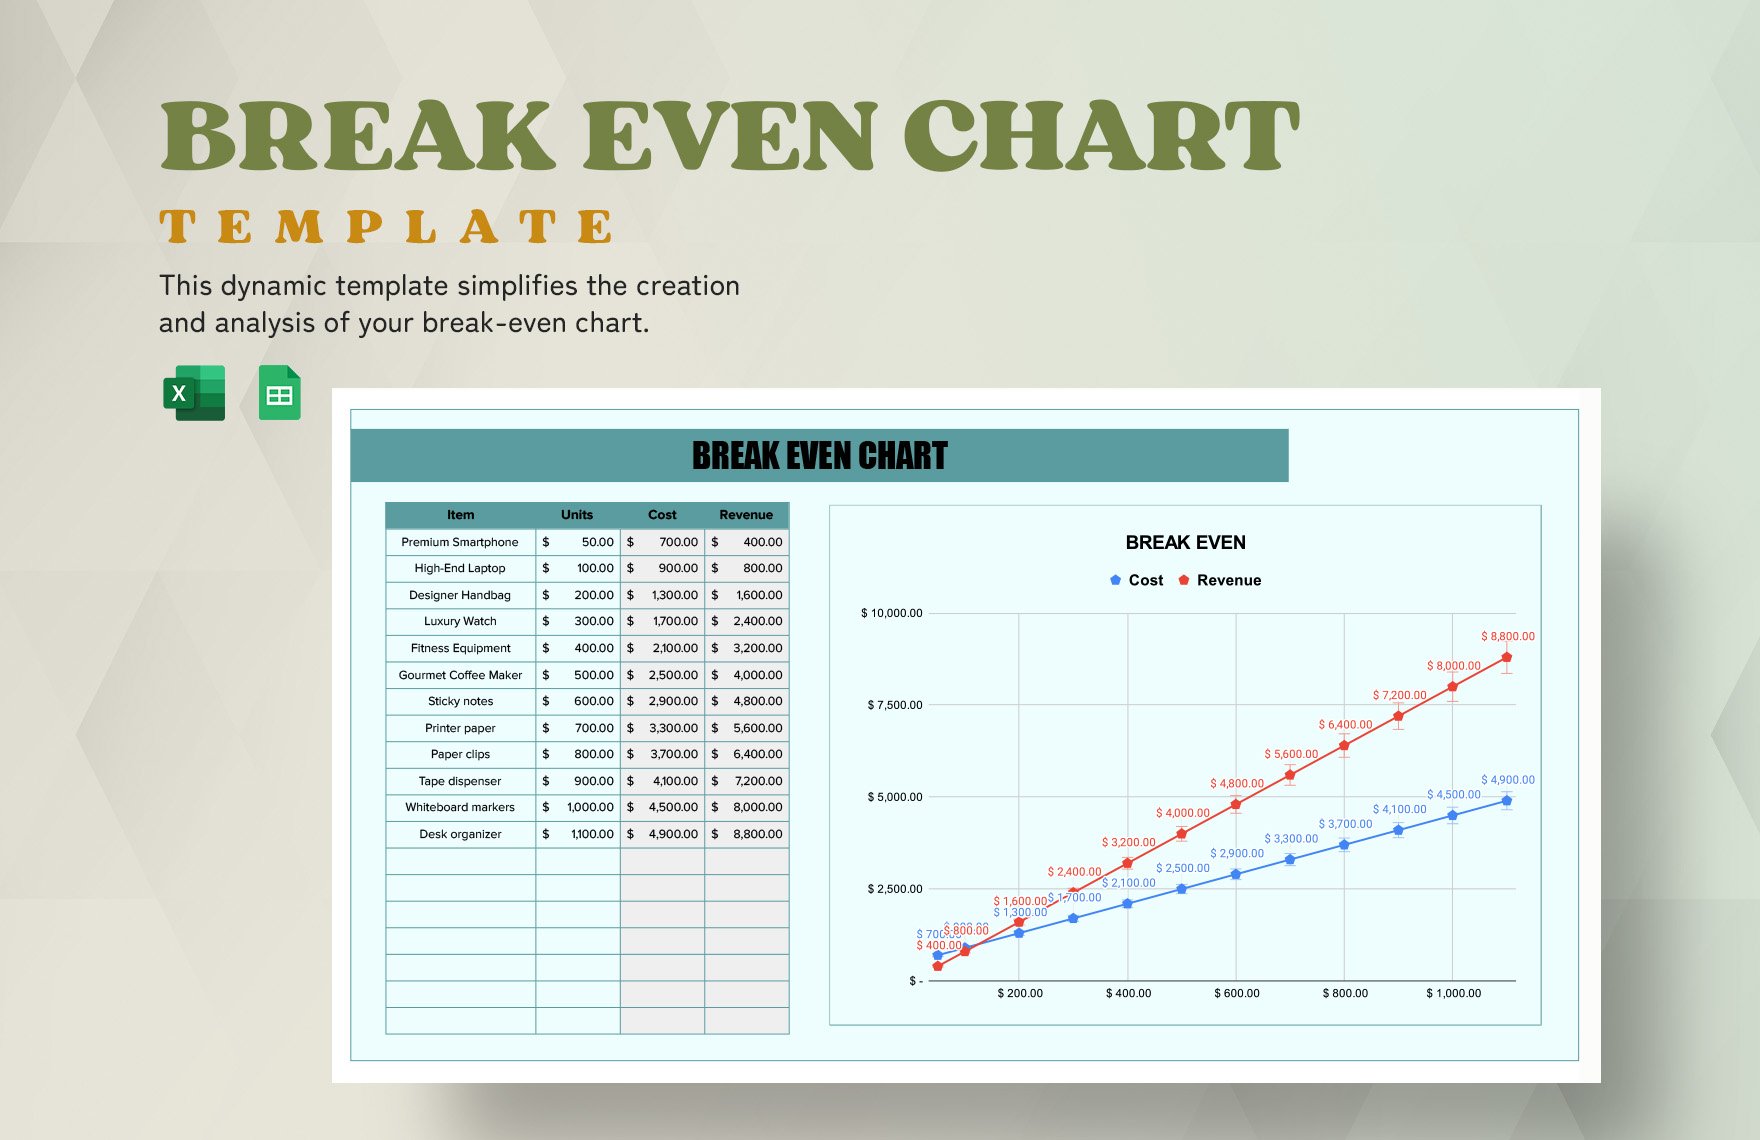
With your data in place, insert a scatter with smooth lines chart:
- X‑Axis: Units Sold (0 to a little beyond the BEU).
- Y‑Axis: Cumulative Cost and Cumulative Revenue.
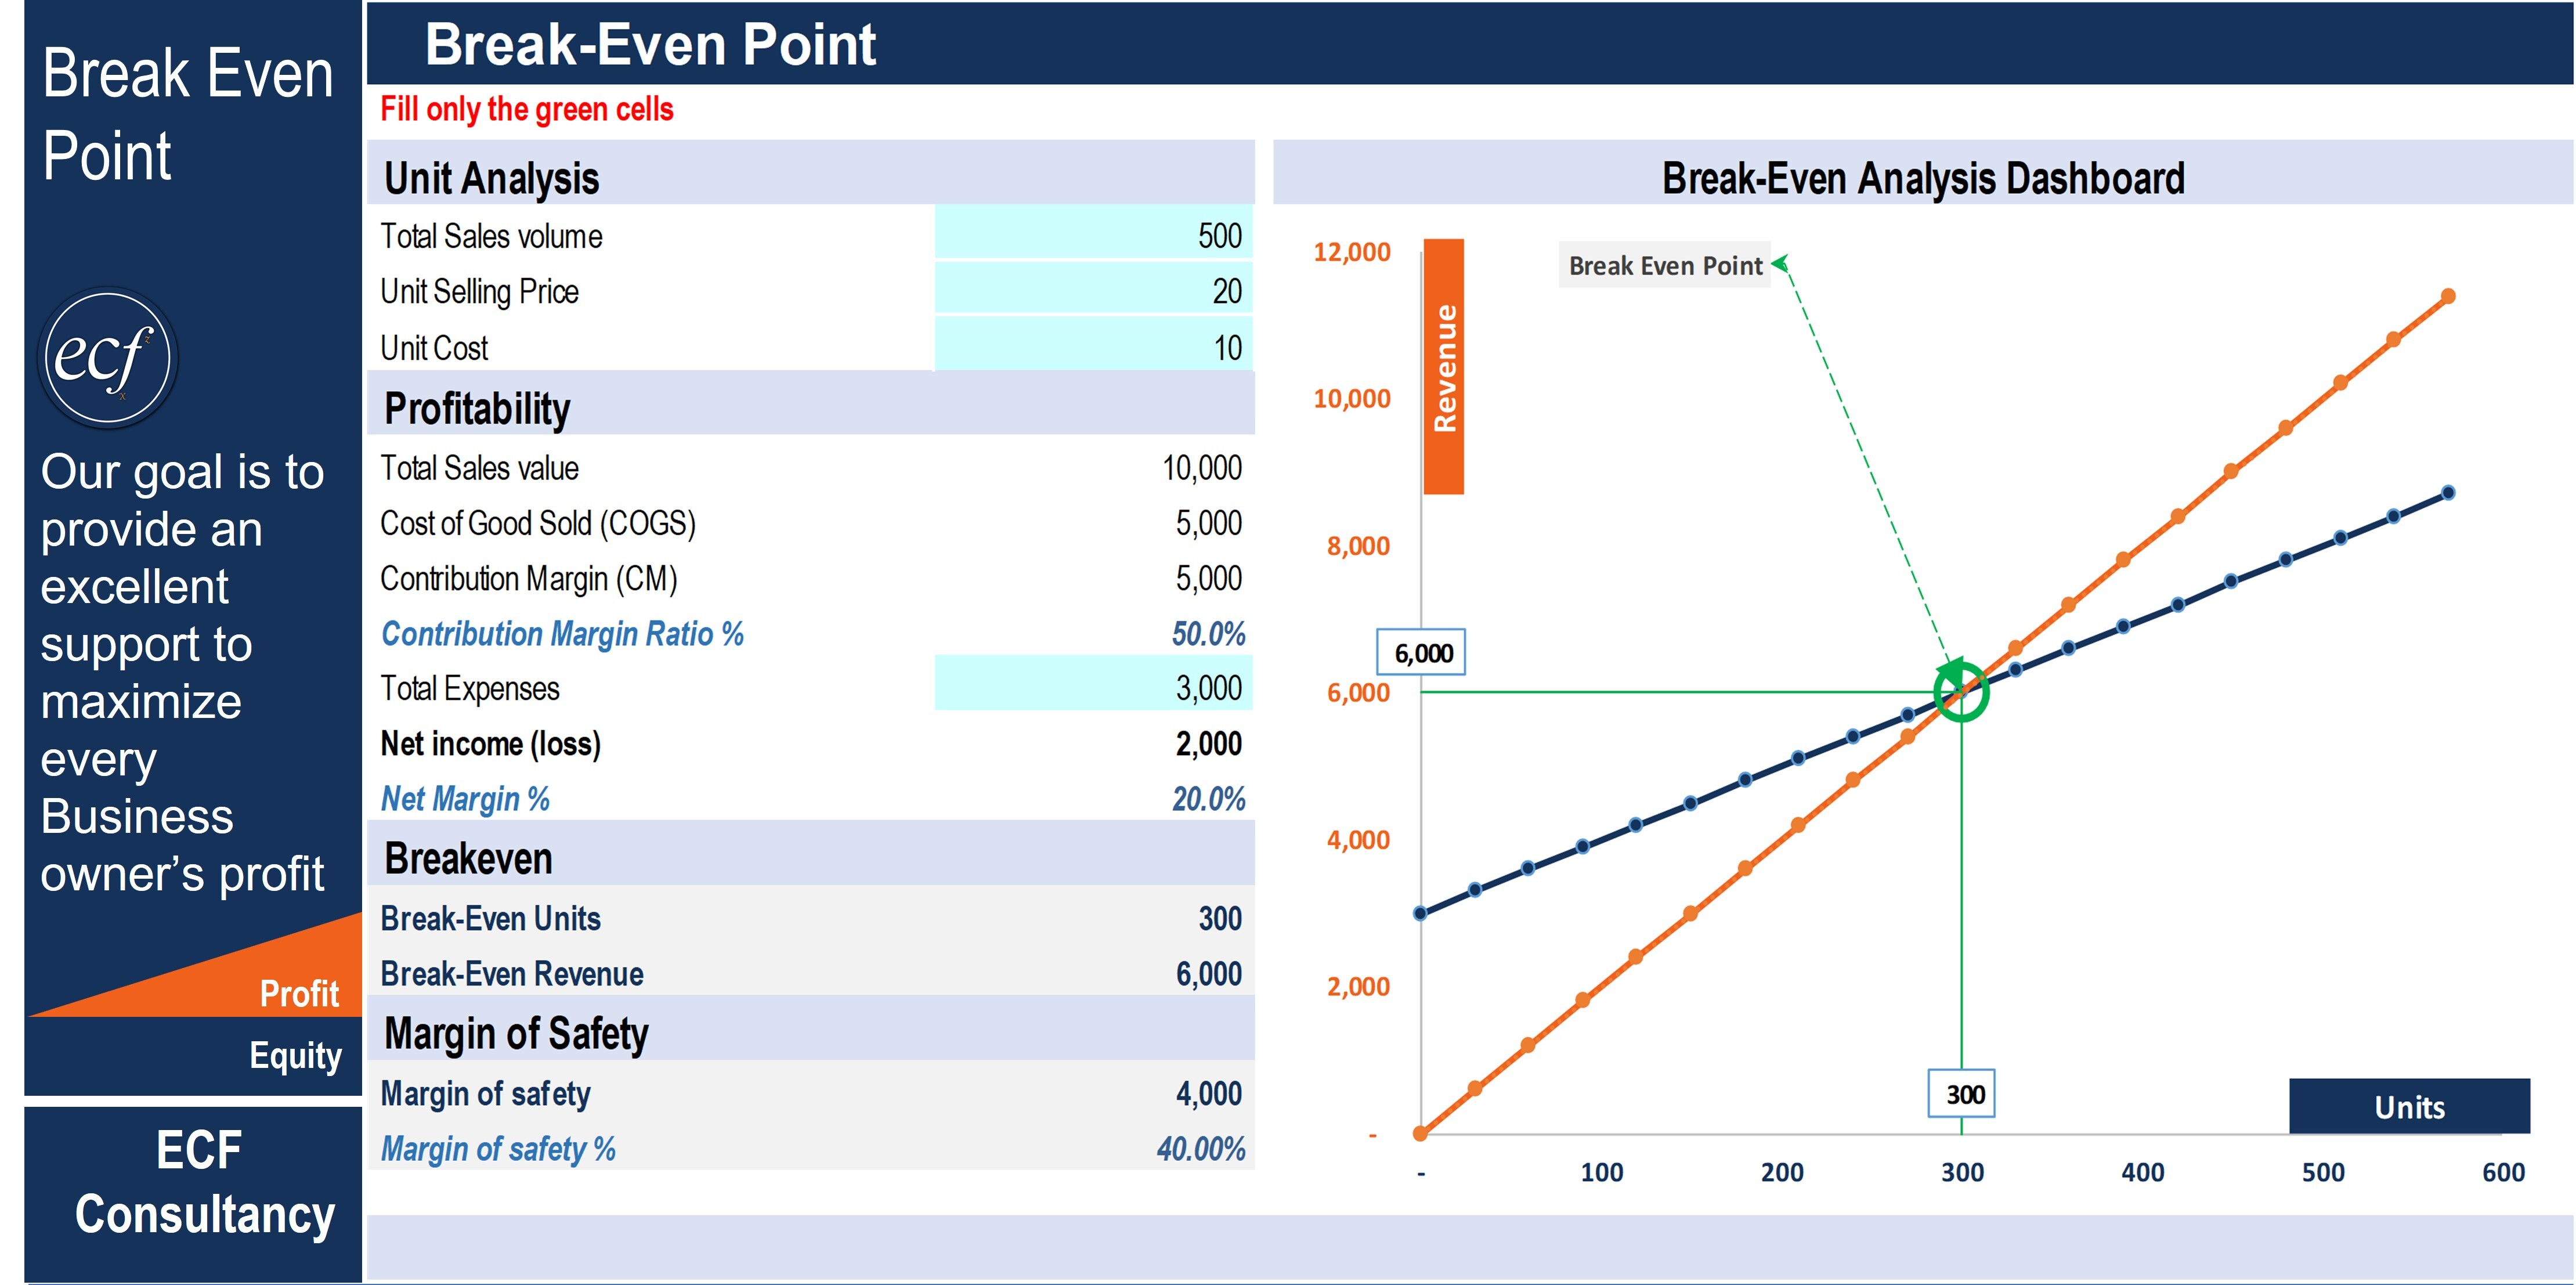
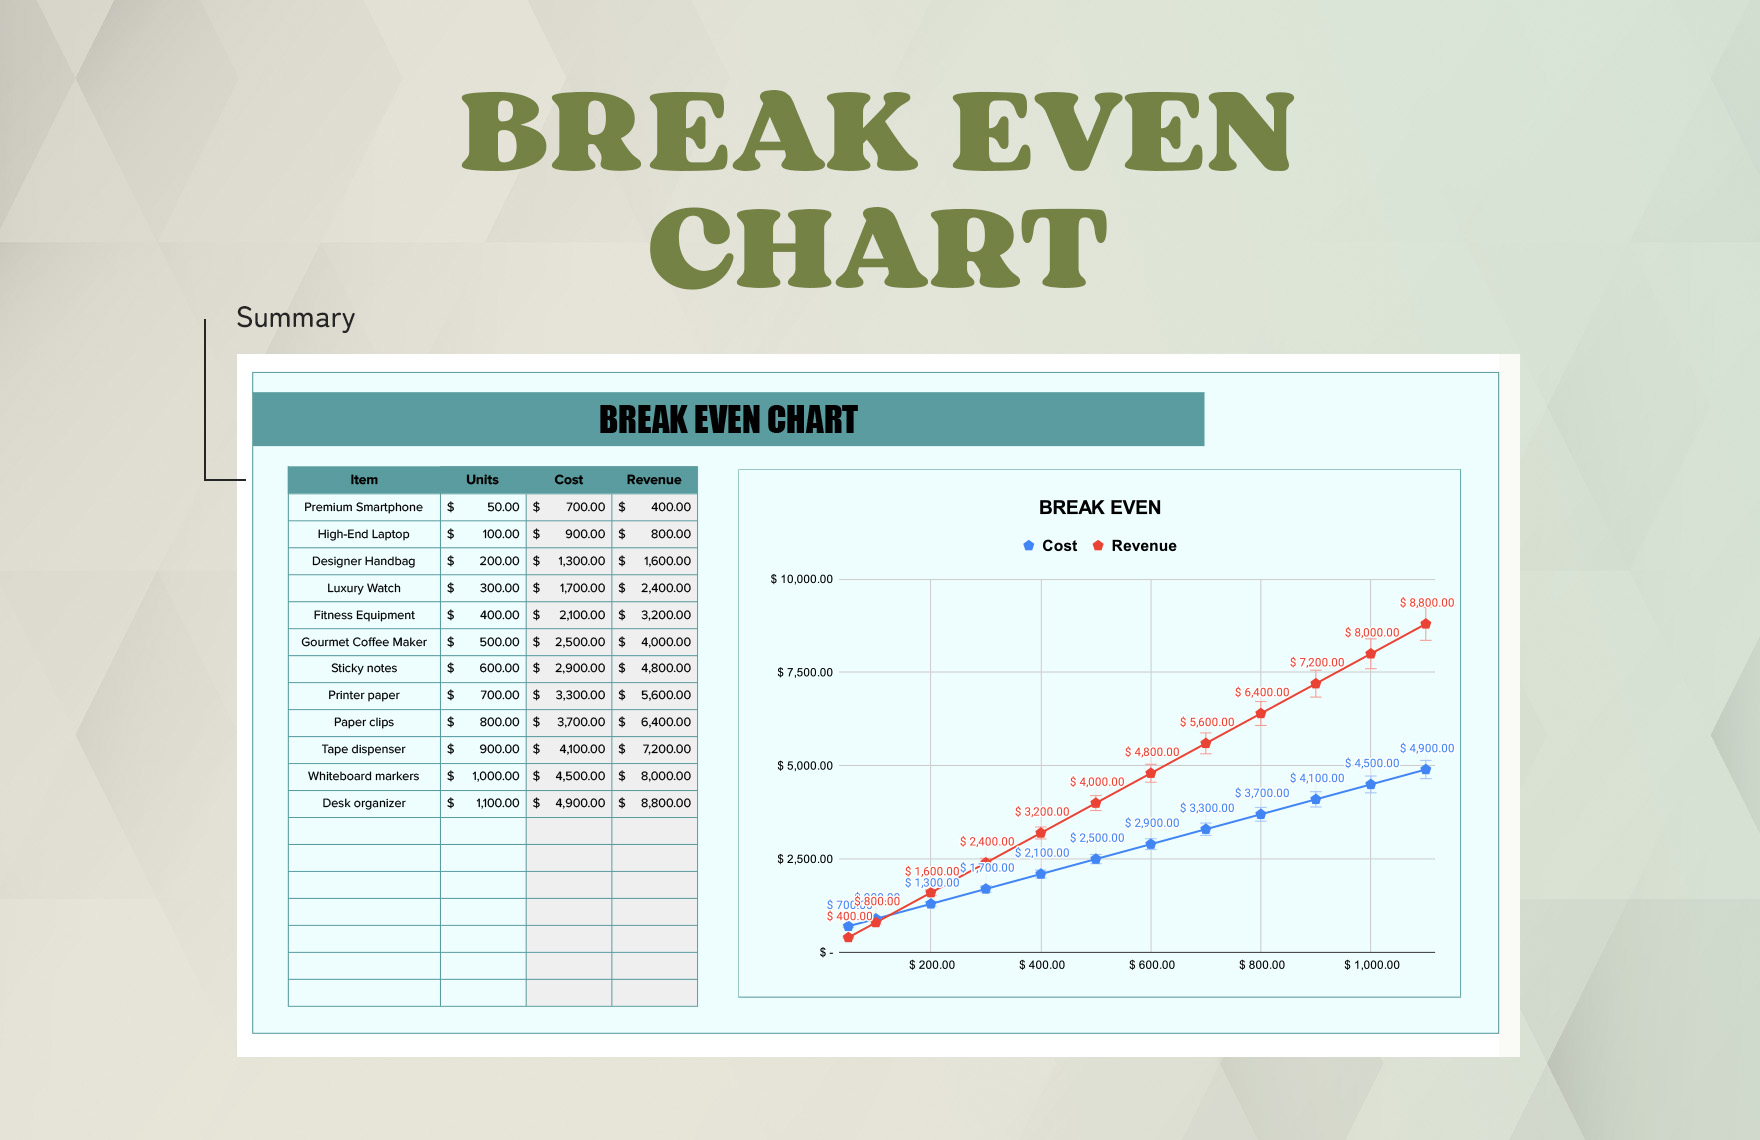
- Add a break‑even line where the two curves intersect.
4. Style Like a Pro
- Use bright colors for revenue, muted for costs.
- Label the intersection point: “BREAK‑EVEN.”
- Add a trendline for visual flair.
5. Add a Sensitivity Analysis (Optional)
Introduce sliders or data tables that show how a price change or a variable cost shift moves the break‑even point. A quick way to say “Hey, we can afford to drop the price by 10% without hurting profits.”
Step‑by‑Step: Filling the Formulas
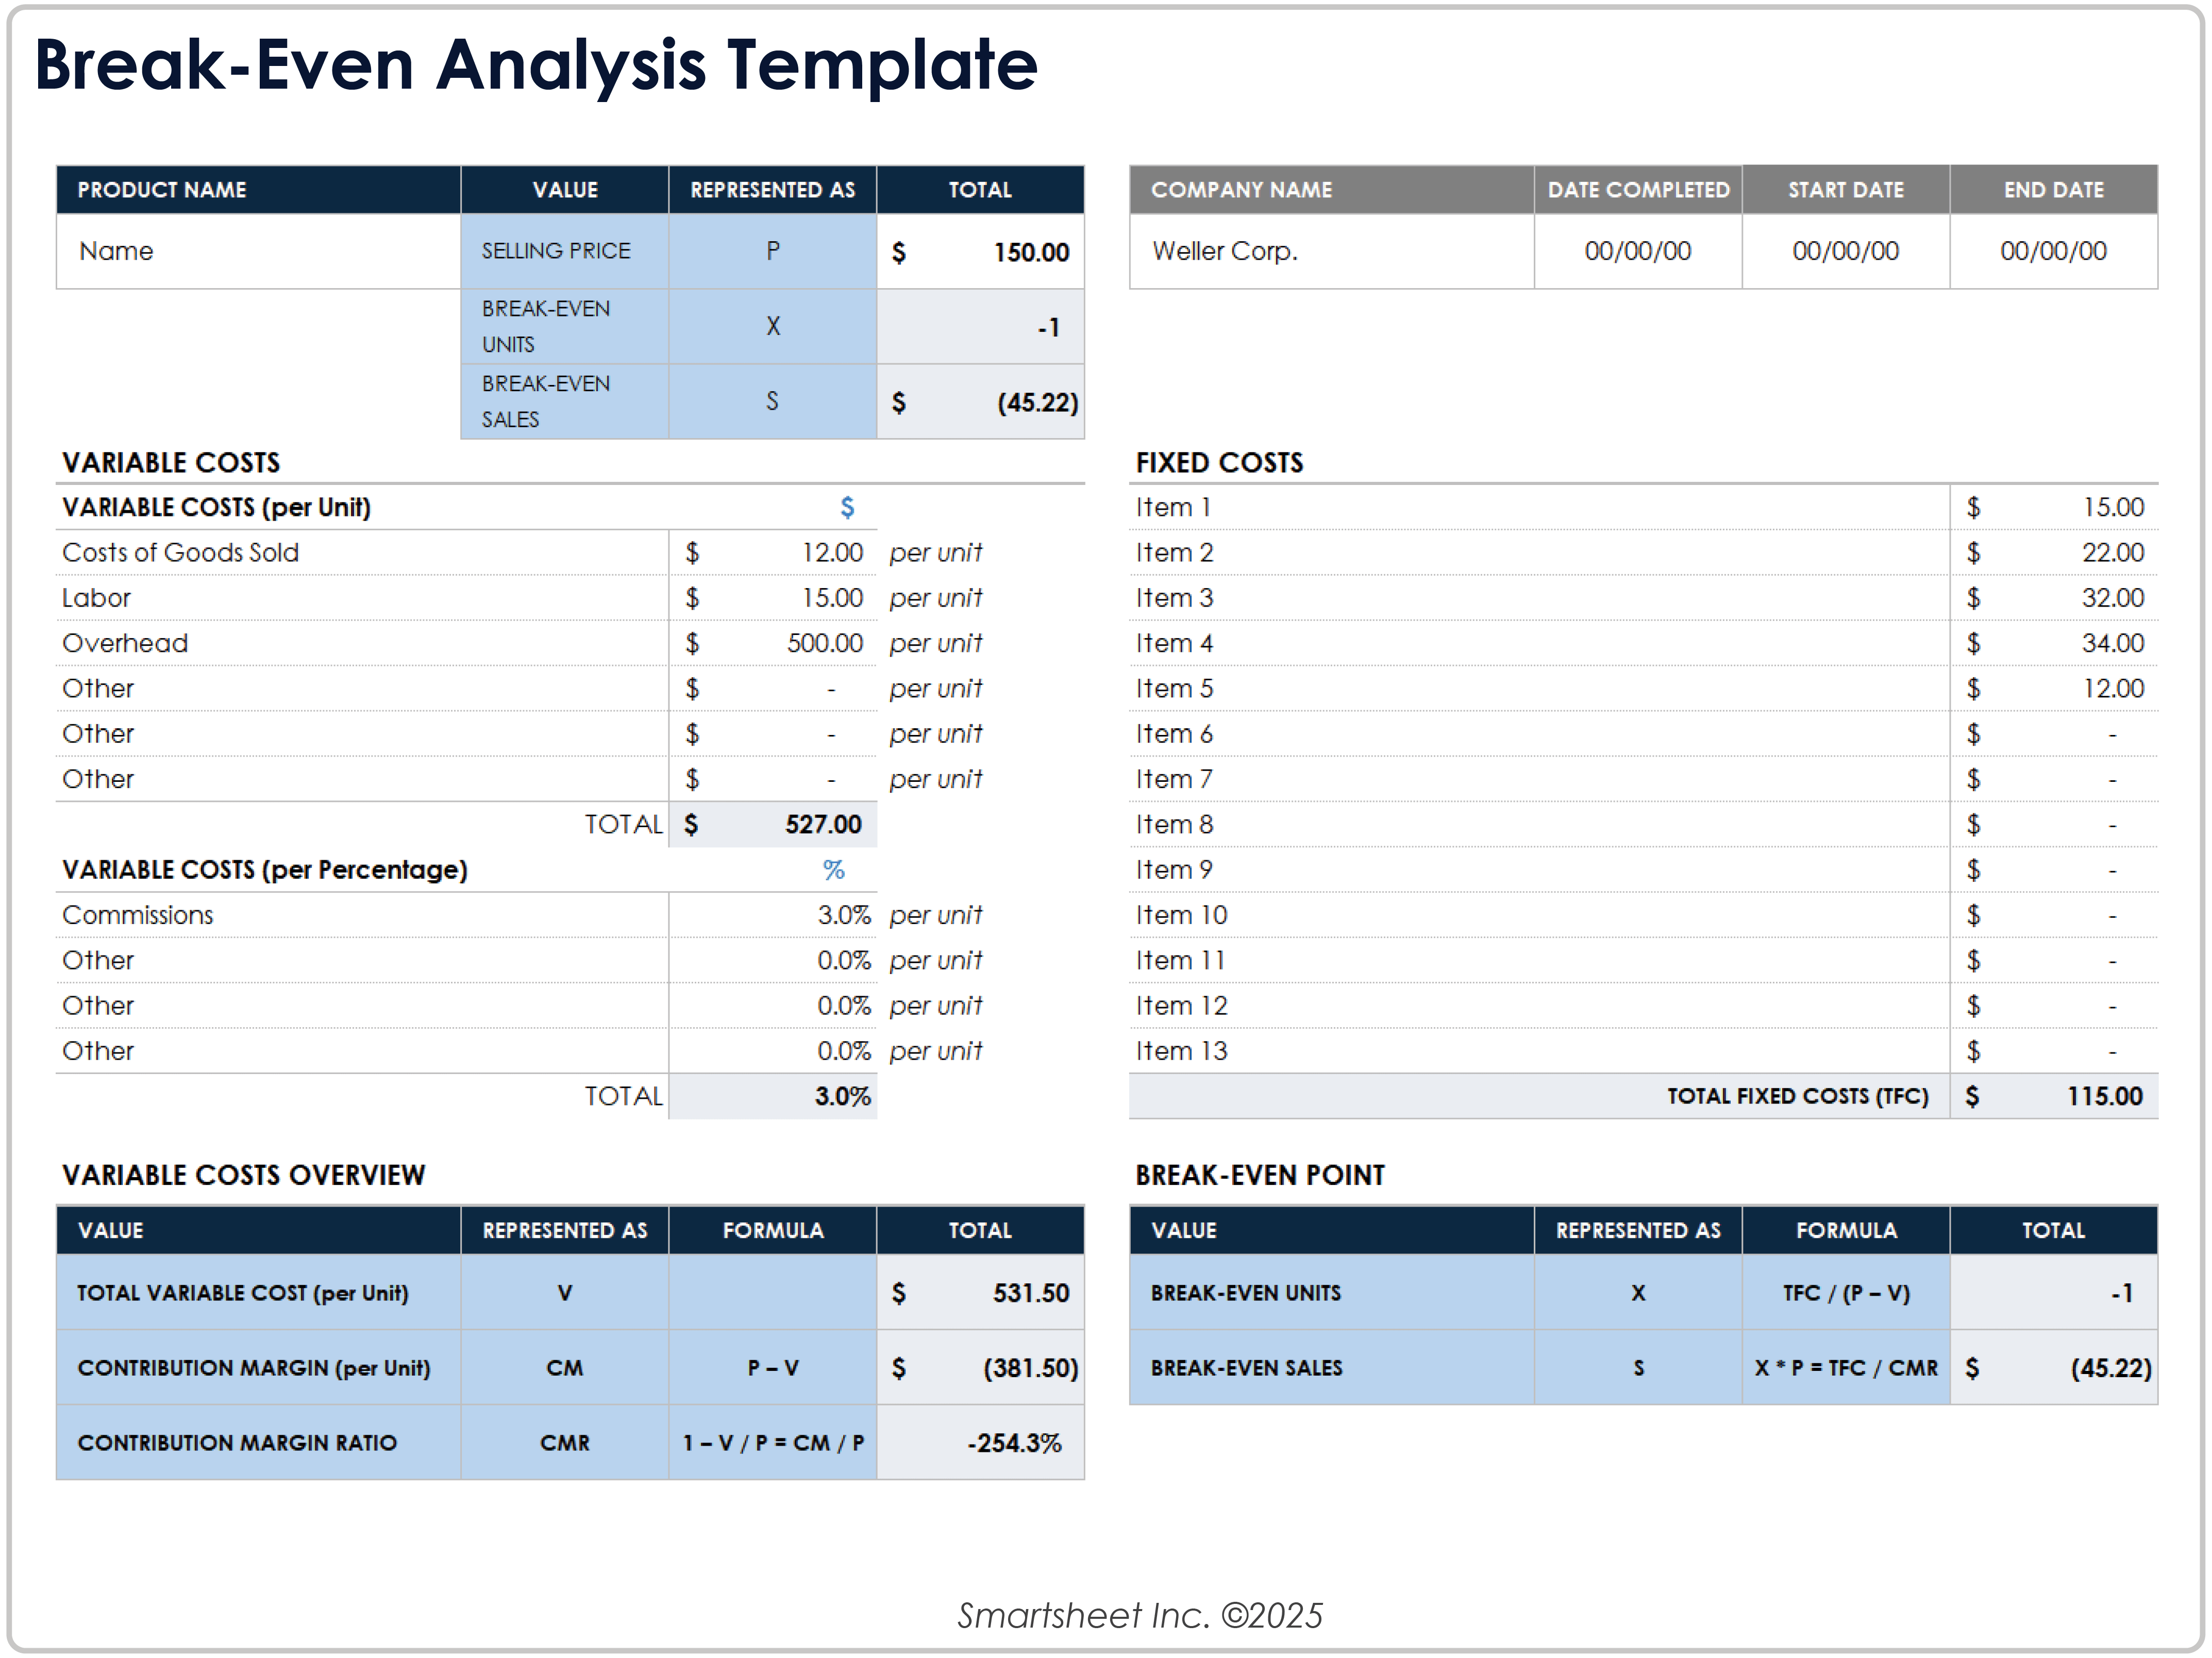
Let’s walk through a real example: a small coffee shop that sells a single item—a latte.
Case Study: The Latte Shop
- Fixed Costs: Rent $4,000/month, salaries $8,000/month, utilities $1,200/month. Total Fixed Cost = $13,200.
- Variable Cost per Latte: Coffee beans $0.50, milk $0.30, labor $0.20. Variable Cost = $1.00.
- Sales Price per Latte: $5.00.
Calculations
- Contribution Margin = $5.00 – $1.00 = $4.00.
- Break‑Even Units = $13,200 ÷ $4.00 = 3,300 lattes per month.
- Daily break‑even = 3,300 ÷ 30 ≈ 110 lattes/day.
Chart Interpretation
Plot revenue and costs. The line where they touch is at 3,300 lattes. Everything below is a loss; everything above is profit. This visual helps you see that if you’re serving 150 lattes a day, you’re already over the break‑even mark—time to throw a party!
Visualizing with Charts and Colors

Numbers are great, but charts are the magic that turns dry data into storytelling.
The Power of Color Coding
- Red for losses (below break‑even).
- Green for profits (above break‑even).
- Use a gradient to show how profit grows with sales volume.
Annotations and Callouts
Add a text box that says “You’re breaking even!” at the intersection. You can also add a “Target Profit” line, maybe $5,000 monthly, to show how many extra units you need to hit that goal.
Dashboard Friendly
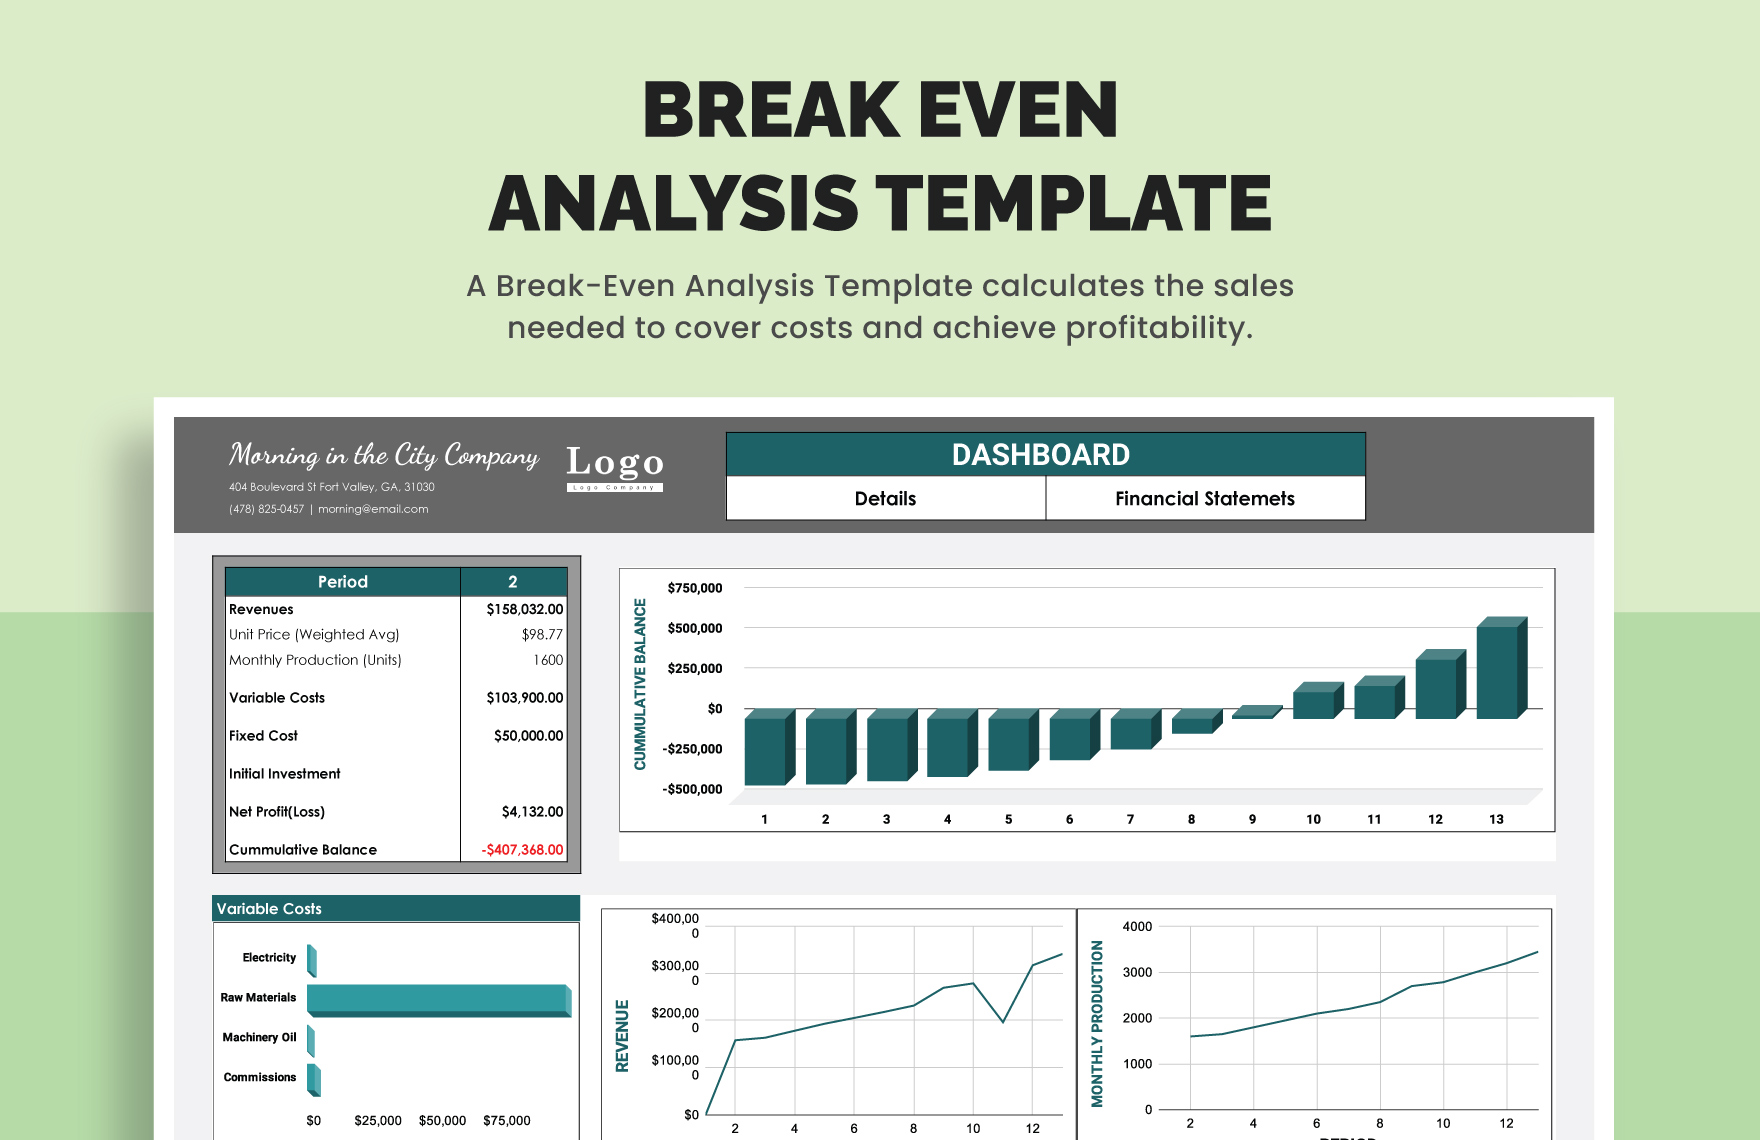
If you’re building a dashboard, keep the break‑even chart front and center. Add slicers for different product lines, months, or seasons so managers can see instant impact.
Common Pitfalls and How to Avoid Them
1. Mixing Monthly and Unit Costs
Make sure all costs are in the same period. A $1,200 monthly utility cost and a $1.00 per latte variable cost should not be compared directly; convert them to per unit or per period consistently.
2. Ignoring Depreciation
Fixed costs should include depreciation of equipment. A coffee machine that costs $5,000 and lasts five years contributes a $83/month expense. Forgetting this will make your break‑even point unrealistically low.
3. Over‑Optimistic Sales Assumptions
Use realistic projections. An ambitious sales target of 10,000 units when you can only handle 4,000 is a recipe for disaster.
4. Not Updating Costs
Variable costs can rise—think ingredient price hikes. Update your template regularly. A one‑time use of the template becomes a living document.
Real‑World Scenarios Where It Saves the Day
Startup Food Truck
A food truck owner used a break‑even chart to decide whether to launch a new menu item. By plugging in the expected variable cost of a new burger ($3.50) and the sales price ($9.00), the chart instantly showed a break‑even of 700 units per week. This helped the owner set a sales target of 1,000 units to justify the marketing spend.
E‑Commerce Store
For an online boutique, shipping costs per item were variable. The template helped the owner adjust shipping rates and see how it shifted the break‑even point. When shipping rates increased, the owner could quickly tweak the product price or reduce the marketing budget.
Event Planner
Event planners have high fixed costs (venue, equipment rental) and variable costs per guest (food, drinks). A break‑even chart clarified how many guests were required to cover the event and suggested pricing tiers that ensured profit.
Beyond the Basics: Advanced Tweaks

Scenario Analysis
Use Excel’s Goal Seek or Google Sheets’ What‑If Analysis to see how changing one variable—like a price hike—affects the break‑even point. This is useful for negotiations with suppliers or price changes to stay competitive.
Multi‑Product Break‑Even
When you sell more than one product, calculate a combined contribution margin or create separate charts. Weighted averages help you see which product drives the business forward.
Incorporating Taxes
Include a tax line on the chart to see how after‑tax profit looks. Some businesses prefer to calculate pre‑tax break‑even, but adding taxes can reveal hidden costs.
Automation with Scripts
For large datasets, consider using Google Apps Script or VBA macros to auto‑populate the chart whenever new data arrives. That way, the break‑even point updates in real time as you add sales data.
Conclusion

A Break Even Analysis Chart Template is more than just a spreadsheet—it’s your financial compass, your budgetary BFF, and the comedic relief that turns accounting from a chore into a visual delight. By following the steps above, you’ll craft a chart that not only tells you where you stand but also invites your team to celebrate when you surpass that critical point. Keep your data fresh, your colors bold, and your humor alive, and watch that line shift from “we’re barely breathing” to “profit parade!”.




Related posts of "Break Even Analysis Chart Template"
